Austin Airbnb Market Analysis 2026: Short Term Rental Data & Vacation Rental Statistics in Texas, United States
Is Airbnb profitable in Austin in 2026? Explore comprehensive Airbnb analytics for Austin, Texas, United States to uncover income potential. This 2026 STR market report for Austin, based on AirROI data from February 2025 to January 2026, reveals key trends in the bustling market of 8,553 active listings.
Whether you're considering an Airbnb investment in Austin, optimizing your existing vacation rental, or exploring rental arbitrage opportunities, understanding the Austin Airbnb data is crucial. Leveraging the low regulation environment is key to maximizing your short term rental income potential. Let's dive into the specifics.
Key Austin Airbnb Performance Metrics Overview
Monthly Airbnb Revenue Variations & Income Potential in Austin (2026)
Understanding the monthly revenue variations for Airbnb listings in Austin is key to maximizing your short term rental income potential. Seasonality significantly impacts earnings. Our analysis, based on data from the past 12 months, shows that the peak revenue month for STRs in Austin is typically March, while January often presents the lowest earnings, highlighting opportunities for strategic pricing adjustments during shoulder and low seasons. Explore the typical Airbnb income in Austin across different performance tiers:
- Best-in-class properties (Top 10%) achieve $8,201+ monthly, often utilizing dynamic pricing and superior guest experiences.
- Strong performing properties (Top 25%) earn $4,767 or more, indicating effective management and desirable locations/amenities.
- Typical properties (Median) generate around $2,724 per month, representing the average market performance.
- Entry-level properties (Bottom 25%) see earnings around $1,328, often with potential for optimization.
Average Monthly Airbnb Earnings Trend in Austin
Austin Airbnb Occupancy Rate Trends (2026)
Maximize your bookings by understanding the Austin STR occupancy trends. Seasonal demand shifts significantly influence how often properties are booked. Typically, Marchsees the highest demand (peak season occupancy), while January experiences the lowest (low season). Effective strategies, like adjusting minimum stays or offering promotions, can boost occupancy during slower periods. Here's how different property tiers perform in Austin:
- Best-in-class properties (Top 10%) achieve 83%+ occupancy, indicating high desirability and potentially optimized availability.
- Strong performing properties (Top 25%) maintain 66% or higher occupancy, suggesting good market fit and guest satisfaction.
- Typical properties (Median) have an occupancy rate around 44%.
- Entry-level properties (Bottom 25%) average 24% occupancy, potentially facing higher vacancy.
Average Monthly Occupancy Rate Trend in Austin
Average Daily Rate (ADR) Airbnb Trends in Austin (2026)
Effective short term rental pricing strategy in Austin involves understanding monthly ADR fluctuations. The Average Daily Rate (ADR) for Airbnb in Austin typically peaks in October and dips lowest during February. Leveraging Airbnb dynamic pricing tools or strategies based on this seasonality can significantly boost revenue. Here's a look at the typical nightly rates achieved:
- Best-in-class properties (Top 10%) command rates of $540+ per night, often due to premium features or locations.
- Strong performing properties (Top 25%) achieve nightly rates of $307 or more.
- Typical properties (Median) charge around $187 per night.
- Entry-level properties (Bottom 25%) earn around $120 per night.
Average Daily Rate (ADR) Trend by Month in Austin
Get Live Austin Market Intelligence 👇

Explore Real-time Analytics
Airbnb Seasonality Analysis & Trends in Austin (2026)
Peak Season (March, October, November)
- Revenue averages $4,971 per month
- Occupancy rates average 50.2%
- Daily rates average $306
Shoulder Season
- Revenue averages $3,800 per month
- Occupancy maintains around 45.2%
- Daily rates hold near $266
Low Season (January, February, December)
- Revenue drops to average $3,245 per month
- Occupancy decreases to average 42.8%
- Daily rates adjust to average $265
Seasonality Insights for Austin
- The Airbnb seasonality in Austin shows moderate seasonality with distinct peak and low periods. While the sections above show seasonal averages, it's also insightful to look at the extremes:
- During the high season, the absolute peak month showcases Austin's highest earning potential, with monthly revenues capable of climbing to $5,399, occupancy reaching a high of 55.2%, and ADRs peaking at $335.
- Conversely, the slowest single month of the year, typically falling within the low season, marks the market's lowest point. In this month, revenue might dip to $2,817, occupancy could drop to 36.2%, and ADRs may adjust down to $249.
- Understanding both the seasonal averages and these monthly peaks and troughs in revenue, occupancy, and ADR is crucial for maximizing your Airbnb profit potential in Austin.
Seasonal Strategies for Maximizing Profit
- Peak Season: Maximize revenue through premium pricing and potentially longer minimum stays. Ensure high availability.
- Low Season: Offer competitive pricing, special promotions (e.g., extended stay discounts), and flexible cancellation policies. Target off-season travelers like remote workers or budget-conscious guests.
- Shoulder Seasons: Implement dynamic pricing that balances peak and low rates. Target weekend travelers or specific events. Offer slightly more flexible terms than peak season.
- Regularly analyze your own performance against these Austin seasonality benchmarks and adjust your pricing and availability strategy accordingly.
Best Areas for Airbnb Investment in Austin (2026)
Exploring the top neighborhoods for short-term rentals in Austin? This section highlights key areas, outlining why they are attractive for hosts and guests, along with notable local attractions. Consider these locations based on your target guest profile and investment strategy.
| Neighborhood / Area | Why Host Here? (Target Guests & Appeal) | Key Attractions & Landmarks |
|---|---|---|
| Downtown Austin | The heart of the city, known for its vibrant nightlife, restaurants, cultural venues, and proximity to major attractions like the Texas State Capitol. It attracts both tourists and business travelers. | Texas State Capitol, Lady Bird Lake, 6th Street, Zilker Park, Austin Convention Center |
| South Congress (SoCo) | A beloved neighborhood filled with quirky shops, food trailers, and live music venues. It offers a unique Austin experience that attracts tourists looking for local culture and charm. | South Congress Avenue shops, Twenty-One Pilots mural, Bats under Congress Avenue Bridge, Guadalupe Street, Lou Neff Point |
| East Austin | An up-and-coming area known for its cool vibe, art galleries, craft breweries, and eclectic music scene. It attracts young vacationers and locals alike looking for something different. | East 6th Street, Lady Bird Lake Hike-and-Bike Trail, Luminations at the Wildflower Center, Brewery tour spots, Street art murals |
| North Loop | A funky neighborhood that attracts a mix of hipsters and families. It's known for its vintage shops, coffee houses, and local eateries, making it a picturesque area for Airbnb hosting. | Vulcan Video, North Loop shopping district, Epoch Coffee, The Beer Plant, Texas Farmers' Market at Mueller |
| Zilker Park | Surrounded by nature and outdoor activities, this area is perfect for visitors seeking recreation and tranquility while still being close to the city’s attractions. Zilker Park hosts many events and festivals. | Zilker Botanical Garden, Barton Springs Pool, Austin City Limits Music Festival, Zilker Park, Lady Bird Lake |
| Mueller | A planned community that combines residential and commercial areas with parks and walking trails. It attracts families and young professionals looking for a suburban feel with urban conveniences. | Mueller Lake Park, Alamo Drafthouse, Thinkery Museum, The Barrel, Mueller Farmers' Market |
| West Campus | Located near the University of Texas at Austin, this area is popular among college students and visitors to the university, making it a prime spot for short-term rentals. | University of Texas at Austin, The Drag, Friedrich Park, Campus events, Austin Nature and Science Center |
| Travis Heights | A historic neighborhood known for its charming bungalows and proximity to downtown Austin. It’s a great area for guests looking to enjoy both the city and a residential feel. | Blanton Museum of Art, Travis Heights Park, SoCo Shopping, St. Edward's University, Austin Creek |
Understanding Airbnb License Requirements & STR Laws in Austin (2026)
While Austin, Texas, United States currently shows low STR regulations, specific Airbnb license requirements might still exist or change. Always verify the latest short term rental regulations and Airbnb license requirements directly with local government authorities for Austin to ensure full compliance before hosting.
(Source: AirROI data, 2026, based on 0% licensed listings)
Top Performing Airbnb Properties in Austin (2026)
Benchmark your potential! Explore examples of top-performing Airbnb properties in Austinbased on Trailing Twelve Month (TTM) revenue. Analyze their characteristics, revenue, occupancy rate, and ADR to understand what drives success in this market.

Frog + Lily Pad
Entire Place • 5 bedrooms
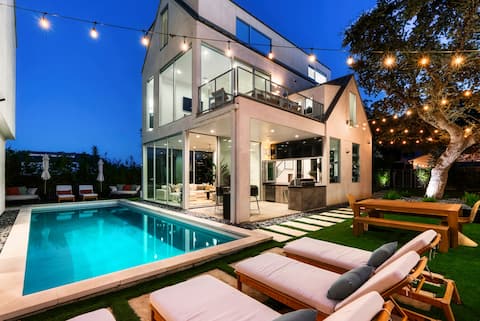
ATX Compound | 15bd 10.5ba, Heated Pool, Mini Golf
Entire Place • 15 bedrooms

Huge Group Compound | Heart of ATX | Sleeps 41
Entire Place • 9 bedrooms
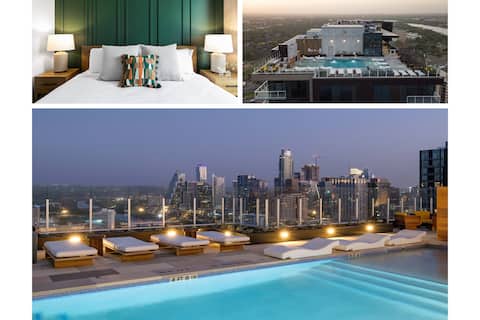
Lux Group Stay | Rooftop Pool | #1 Stay on Rainey
Entire Place • 8 bedrooms

WOW | Chill + Chic Austin Hub | 12BR Modern Marvel
Entire Place • 12 bedrooms
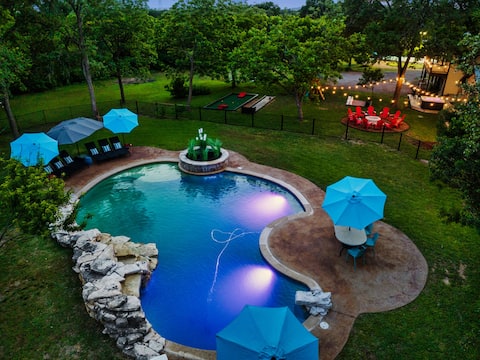
Near Downtown~Pool on 2 Acres~Pickleball~Sleeps 22
Entire Place • 6 bedrooms
Note: Performance varies based on location, size, amenities, seasonality, and management quality. Data reflects the past 12 months.
Top Performing Airbnb Hosts in Austin (2026)
Learn from the best! This table showcases top-performing Airbnb hosts in Austin based on the number of properties managed and estimated total revenue over the past year. Analyze their scale and performance metrics.
| Host Name | Properties | Grossing Revenue | Stay Reviews | Avg Rating |
|---|---|---|---|---|
| Stay Local Austin | 65 | $3,218,338 | 2992 | 4.78/5.0 |
| Jason | 20 | $3,098,269 | 3230 | 4.93/5.0 |
| Renters Club | 44 | $2,805,948 | 1848 | 4.79/5.0 |
| FCM Homes | 51 | $2,441,142 | 2058 | 4.89/5.0 |
| UrbanStay | 21 | $2,416,564 | 2234 | 4.80/5.0 |
| Jason | 18 | $2,374,414 | 6610 | 4.85/5.0 |
| Rachel | 13 | $2,274,284 | 431 | 4.99/5.0 |
| Dakota | 24 | $2,175,515 | 1424 | 4.87/5.0 |
| Grand Welcome Mammoth Lakes Va | 51 | $2,161,767 | 937 | 4.61/5.0 |
| Lynn | 24 | $2,151,524 | 3388 | 4.91/5.0 |
Analyzing the strategies of top hosts, such as their property selection, pricing, and guest communication, can offer valuable lessons for optimizing your own Airbnb operations in Austin.
Dive Deeper: Advanced Austin STR Market Data (2026)
Ready to unlock more insights? AirROI provides access to advanced metrics and comprehensive Airbnb data for Austin. Explore detailed analytics beyond this report to refine your investment strategy, optimize pricing, and maximize your vacation rental profits.
Explore Advanced MetricsAustin Short-Term Rental Market Composition (2026): Property & Room Types
Room Type Distribution
Property Type Distribution
Market Composition Insights for Austin
- The Austin Airbnb market composition is heavily skewed towards Entire Home/Apt listings, which make up 89.1% of the 8,553 active rentals. This indicates strong guest preference for privacy and space.
- Looking at the property type distribution in Austin, House properties are the most common (60.2%), reflecting the local real estate landscape.
- Houses represent a significant 60.2% portion, catering likely to families or larger groups.
- The presence of 7.1% Hotel/Boutique listings indicates integration with traditional hospitality.
- Smaller segments like others, outdoor/unique, unique stays (combined 4.0%) offer potential for unique stay experiences.
Austin Airbnb Room Capacity Analysis (2026): Bedroom Distribution
Distribution of Listings by Number of Bedrooms
Room Capacity Insights for Austin
- The dominant room capacity in Austin is 1 bedroom listings, making up 27.6% of the market. This suggests a strong demand for properties suitable for couples or solo travelers.
- Together, 1 bedroom and 2 bedrooms properties represent 50.9% of the active Airbnb listings in Austin, indicating a high concentration in these sizes.
- A significant 35.2% of listings offer 3+ bedrooms, catering to larger groups and families seeking more space in Austin.
Austin Vacation Rental Guest Capacity Trends (2026)
Distribution of Listings by Guest Capacity
Guest Capacity Insights for Austin
- The most common guest capacity trend in Austin vacation rentals is listings accommodating 8+ guests (24.5%). This suggests the primary traveler segment is likely larger groups.
- Properties designed for 8+ guests and 4 guests dominate the Austin STR market, accounting for 45.6% of listings.
- 42.5% of properties accommodate 6+ guests, serving the market segment for larger families or group travel in Austin.
- On average, properties in Austin are equipped to host 4.7 guests.
Austin Airbnb Booking Patterns (2026): Available vs. Booked Days
Available Days Distribution
Booked Days Distribution
Booking Pattern Insights for Austin
- The most common availability pattern in Austin falls within the 271-366 days range, representing 42.5% of listings. This suggests many properties have significant open periods on their calendars.
- Approximately 75.5% of listings show high availability (181+ days open annually), indicating potential for increased bookings or specific owner usage patterns.
- For booked days, the 91-180 days range is most frequent in Austin (33.6%), reflecting common guest stay durations or potential owner blocking patterns.
- A notable 25.7% of properties secure long booking periods (181+ days booked per year), highlighting successful long-term rental strategies or significant owner usage.
Austin Airbnb Minimum Stay Requirements Analysis
Distribution of Listings by Minimum Night Requirement
1 Night
1638 listings
19.2% of total
2 Nights
2472 listings
28.9% of total
3 Nights
433 listings
5.1% of total
4-6 Nights
216 listings
2.5% of total
7-29 Nights
707 listings
8.3% of total
30+ Nights
3087 listings
36.1% of total
Key Insights
- The most prevalent minimum stay requirement in Austin is 30+ Nights, adopted by 36.1% of listings. This highlights the market's preference for longer commitments.
- A significant segment (36.1%) caters to monthly stays (30+ nights) in Austin, pointing to opportunities in the extended-stay market.
Recommendations
- Align with the market by considering a 30+ Nights minimum stay, as 36.1% of Austin hosts use this setting.
- If feasible, allowing 1-night stays, especially midweek or during low season, could capture last-minute bookings, as only 19.2% currently do.
- Explore offering discounts for stays of 30+ nights to attract the 36.1% of the market seeking extended stays.
- Adjust minimum nights based on seasonality – potentially shorter during low season and longer during peak demand periods in Austin.
Austin Airbnb Cancellation Policy Trends Analysis (2026)
Non-refundable
1 listings
0% of total
Limited
176 listings
2.1% of total
Super Strict 30 Days
193 listings
2.3% of total
Super Strict 60 Days
160 listings
1.9% of total
Flexible
1294 listings
15.2% of total
Moderate
2071 listings
24.3% of total
Firm
2995 listings
35.1% of total
Strict
1641 listings
19.2% of total
Cancellation Policy Insights for Austin
- The prevailing Airbnb cancellation policy trend in Austin is Firm, used by 35.1% of listings.
- A majority (54.3%) of hosts in Austin utilize Firm or Strict policies, indicating a market where hosts prioritize booking security.
Recommendations for Hosts
- Consider adopting a Firm policy to align with the 35.1% market standard in Austin.
- Regularly review your cancellation policy against competitors and market demand shifts in Austin.
Austin STR Booking Lead Time Analysis (2026)
Average Booking Lead Time by Month
Booking Lead Time Insights for Austin
- The overall average booking lead time for vacation rentals in Austin is 39 days.
- Guests book furthest in advance for stays during October (average 67 days), likely coinciding with peak travel demand or local events.
- The shortest booking windows occur for stays in July (average 29 days), indicating more last-minute travel plans during this time.
- Seasonally, Fall (50 days avg.) sees the longest lead times, while Winter (30 days avg.) has the shortest, reflecting typical travel planning cycles.
Recommendations for Hosts
- Use the overall average lead time (39 days) as a baseline for your pricing and availability strategy in Austin.
- For October stays, consider implementing length-of-stay discounts or slightly higher rates for bookings made less than 67 days out to capitalize on advance planning.
- Target marketing efforts for the Fall season well in advance (at least 50 days) to capture early planners.
- Monitor your own booking lead times against these Austin averages to identify opportunities for dynamic pricing adjustments.
Popular & Essential Airbnb Amenities in Austin (2026)
Amenity Prevalence
Amenity Insights for Austin
- Essential amenities in Austin that guests expect include: Air conditioning, Wifi, Smoke alarm, TV. Lacking these (any) could significantly impact bookings.
- Popular amenities like Heating, Kitchen, Hot water are common but not universal. Offering these can provide a competitive edge.
Recommendations for Hosts
- Ensure your listing includes all essential amenities for Austin: Air conditioning, Wifi, Smoke alarm, TV.
- Prioritize adding missing essentials: Air conditioning, Wifi, Smoke alarm, TV.
- Consider adding popular differentiators like Heating or Kitchen to increase appeal.
- Highlight unique or less common amenities you offer (e.g., hot tub, dedicated workspace, EV charger) in your listing description and photos.
- Regularly check competitor amenities in Austin to stay competitive.
Austin Airbnb Guest Demographics & Profile Analysis (2026)
Guest Profile Summary for Austin
- The typical guest profile for Airbnb in Austin consists of primarily domestic travelers (91%), often arriving from nearby Austin, typically belonging to the Post-2000s (Gen Z/Alpha) group (50%), primarily speaking English or Spanish.
- Domestic travelers account for 90.8% of guests.
- Key international markets include United States (90.8%) and United Kingdom (1.6%).
- Top languages spoken are English (63.6%) followed by Spanish (20.1%).
- A significant demographic segment is the Post-2000s (Gen Z/Alpha) group, representing 50% of guests.
Recommendations for Hosts
- Target domestic marketing efforts towards travelers from Austin and Houston.
- Tailor amenities and listing descriptions to appeal to the dominant Post-2000s (Gen Z/Alpha) demographic (e.g., highlight fast WiFi, smart home features, local guides).
- Highlight unique local experiences or amenities relevant to the primary guest profile.
- Consider seasonal promotions aligned with peak travel times for key origin markets.
Nearby Short-Term Rental Market Comparison
How does the Austin Airbnb market stack up against its neighbors? Compare key performance metrics like average monthly revenue, ADR, and occupancy rates in surrounding areas to understand the broader regional STR landscape.
| Market | Active Properties | Monthly Revenue | Daily Rate | Avg. Occupancy |
|---|---|---|---|---|
| Hudson Bend | 59 | $5,436 | $611.45 | 31% |
| Jonestown | 60 | $5,240 | $513.31 | 32% |
| Gillespie County | 11 | $4,887 | $351.24 | 59% |
| West Lake Hills | 21 | $4,391 | $656.35 | 34% |
| Helotes | 48 | $4,095 | $322.31 | 42% |
| Kingsland | 255 | $4,055 | $564.92 | 27% |
| Cottonwood Shores | 26 | $4,012 | $408.66 | 35% |
| Round Mountain | 17 | $3,781 | $385.24 | 42% |
| Volente | 19 | $3,627 | $462.89 | 30% |
| Dripping Springs | 403 | $3,493 | $389.50 | 32% |