Powells Crossroads Airbnb Market Analysis 2025: Short Term Rental Data & Vacation Rental Statistics in Tennessee, United States
Is Airbnb profitable in Powells Crossroads in 2025? Explore comprehensive Airbnb analytics for Powells Crossroads, Tennessee, United States to uncover income potential. This 2025 STR market report for Powells Crossroads, based on AirROI data from April 2024 to March 2025, reveals key trends in the niche market of 17 active listings.
Whether you're considering an Airbnb investment in Powells Crossroads, optimizing your existing vacation rental, or exploring rental arbitrage opportunities, understanding the Powells Crossroads Airbnb data is crucial. Leveraging the low regulation environment is key to maximizing your short term rental income potential. Let's dive into the specifics.
Key Powells Crossroads Airbnb Performance Metrics Overview
Monthly Airbnb Revenue Variations & Income Potential in Powells Crossroads (2025)
Understanding the monthly revenue variations for Airbnb listings in Powells Crossroads is key to maximizing your short term rental income potential. Seasonality significantly impacts earnings. Our analysis, based on data from the past 12 months, shows that the peak revenue month for STRs in Powells Crossroads is typically June, while January often presents the lowest earnings, highlighting opportunities for strategic pricing adjustments during shoulder and low seasons. Explore the typical Airbnb income in Powells Crossroads across different performance tiers:
- Best-in-class properties (Top 10%) achieve $4,729+ monthly, often utilizing dynamic pricing and superior guest experiences.
- Strong performing properties (Top 25%) earn $3,905 or more, indicating effective management and desirable locations/amenities.
- Typical properties (Median) generate around $2,754 per month, representing the average market performance.
- Entry-level properties (Bottom 25%) see earnings around $1,349, often with potential for optimization.
Average Monthly Airbnb Earnings Trend in Powells Crossroads
Powells Crossroads Airbnb Occupancy Rate Trends (2025)
Maximize your bookings by understanding the Powells Crossroads STR occupancy trends. Seasonal demand shifts significantly influence how often properties are booked. Typically, Junesees the highest demand (peak season occupancy), while April experiences the lowest (low season). Effective strategies, like adjusting minimum stays or offering promotions, can boost occupancy during slower periods. Here's how different property tiers perform in Powells Crossroads:
- Best-in-class properties (Top 10%) achieve 66%+ occupancy, indicating high desirability and potentially optimized availability.
- Strong performing properties (Top 25%) maintain 57% or higher occupancy, suggesting good market fit and guest satisfaction.
- Typical properties (Median) have an occupancy rate around 44%.
- Entry-level properties (Bottom 25%) average 28% occupancy, potentially facing higher vacancy.
Average Monthly Occupancy Rate Trend in Powells Crossroads
Average Daily Rate (ADR) Airbnb Trends in Powells Crossroads (2025)
Effective short term rental pricing strategy in Powells Crossroads involves understanding monthly ADR fluctuations. The Average Daily Rate (ADR) for Airbnb in Powells Crossroads typically peaks in March and dips lowest during September. Leveraging Airbnb dynamic pricing tools or strategies based on this seasonality can significantly boost revenue. Here's a look at the typical nightly rates achieved:
- Best-in-class properties (Top 10%) command rates of $230+ per night, often due to premium features or locations.
- Strong performing properties (Top 25%) achieve nightly rates of $198 or more.
- Typical properties (Median) charge around $182 per night.
- Entry-level properties (Bottom 25%) earn around $141 per night.
Average Daily Rate (ADR) Trend by Month in Powells Crossroads
Get Live Powells Crossroads Market Intelligence 👇

Explore Real-time Analytics
Airbnb Seasonality Analysis & Trends in Powells Crossroads (2025)
Peak Season (June, May, November)
- Revenue averages $4,565 per month
- Occupancy rates average 54.5%
- Daily rates average $189
Shoulder Season
- Revenue averages $3,035 per month
- Occupancy maintains around 42.5%
- Daily rates hold near $187
Low Season (January, February, September)
- Revenue drops to average $1,762 per month
- Occupancy decreases to average 32.0%
- Daily rates adjust to average $186
Seasonality Insights for Powells Crossroads
- The Airbnb seasonality in Powells Crossroads shows highly seasonal trends requiring careful strategy. While the sections above show seasonal averages, it's also insightful to look at the extremes:
- During the high season, the absolute peak month showcases Powells Crossroads's highest earning potential, with monthly revenues capable of climbing to $4,908, occupancy reaching a high of 64.8%, and ADRs peaking at $201.
- Conversely, the slowest single month of the year, typically falling within the low season, marks the market's lowest point. In this month, revenue might dip to $1,579, occupancy could drop to 20.0%, and ADRs may adjust down to $175.
- Understanding both the seasonal averages and these monthly peaks and troughs in revenue, occupancy, and ADR is crucial for maximizing your Airbnb profit potential in Powells Crossroads.
Seasonal Strategies for Maximizing Profit
- Peak Season: Maximize revenue through premium pricing and potentially longer minimum stays. Ensure high availability.
- Low Season: Offer competitive pricing, special promotions (e.g., extended stay discounts), and flexible cancellation policies. Target off-season travelers like remote workers or budget-conscious guests.
- Shoulder Seasons: Implement dynamic pricing that balances peak and low rates. Target weekend travelers or specific events. Offer slightly more flexible terms than peak season.
- Regularly analyze your own performance against these Powells Crossroads seasonality benchmarks and adjust your pricing and availability strategy accordingly.
Best Areas for Airbnb Investment in Powells Crossroads (2025)
Exploring the top neighborhoods for short-term rentals in Powells Crossroads? This section highlights key areas, outlining why they are attractive for hosts and guests, along with notable local attractions. Consider these locations based on your target guest profile and investment strategy.
| Neighborhood / Area | Why Host Here? (Target Guests & Appeal) | Key Attractions & Landmarks |
|---|---|---|
| Great Smoky Mountains National Park | One of the most visited national parks in the United States, known for its stunning natural beauty and outdoor activities. Ideal for nature lovers and those seeking adventure in the mountains. | Clingmans Dome, Cades Cove, Roaring Fork Motor Nature Trail, Alum Cave Trail, Oconaluftee Visitor Center |
| Pigeon Forge | A bustling resort town that serves as the gateway to the Great Smoky Mountains. Known for entertainment, dining, and attractions, it draws families and tourists year-round. | Dollywood, The Island in Pigeon Forge, Titanic Museum, Great Smoky Mountain Wheel, Pigeon Forge Factory Outlet Mall |
| Gatlinburg | A charming town with easy access to the Smokies, famous for its unique shops, restaurants, and scenic views. Great for tourists seeking both excitement and relaxation. | Gatlinburg SkyLift Park, Ripley's Aquarium of the Smokies, Great Smoky Arts & Crafts Community, Ober Gatlinburg, Anakeesta |
| Cherokee | Located at the entrance to the Great Smoky Mountains, this town is rich in Native American culture and offers various outdoor activities, attracting visitors interested in history and nature. | Museum of the Cherokee Indian, Oconaluftee Indian Village, Harrah's Cherokee Casino, Great Smoky Mountains Railroad, Blue Ridge Parkway |
| Dandridge | A small historic town situated near Douglas Lake, offering a peaceful atmosphere and recreational activities. Good for quiet retreats. | Dandridge Historic District, Douglas Lake, Surfboard Rentals at Dandridge, The Windover Inn, Chestnut Hill Winery |
| Sevierville | Known as the hometown of Dolly Parton, this city offers a mix of shopping, dining, and outdoor activities. A popular stop for travelers to the Smokies. | Dolly Parton Statue, Sevierville Golf Club, Tanger Outlets Sevierville, Fort Chiswell Animal Park, Sevier County Historical Museum |
| White Pine | A quiet town known for its proximity to Douglas Lake and outdoor activities, making it attractive for those seeking a tranquil getaway. | Douglas Lake, White Pine Park, Historic White Pine, Appalachian Trail access, local festivals |
| Cosby | A peaceful community near the Great Smoky Mountains, ideal for nature enthusiasts looking for hiking and camping opportunities. | Cosby Campground, Hen Wallow Falls, The Cosby Picnic Area, Great Smoky Mountains trails, local wildlife watching |
Understanding Airbnb License Requirements & STR Laws in Powells Crossroads (2025)
While Powells Crossroads, Tennessee, United States currently shows low STR regulations, specific Airbnb license requirements might still exist or change. Always verify the latest short term rental regulations and Airbnb license requirements directly with local government authorities for Powells Crossroads to ensure full compliance before hosting.
(Source: AirROI data, 2025, finding no licensed listings among those analyzed)
Top Performing Airbnb Properties in Powells Crossroads (2025)
Benchmark your potential! Explore examples of top-performing Airbnb properties in Powells Crossroadsbased on Trailing Twelve Month (TTM) revenue. Analyze their characteristics, revenue, occupancy rate, and ADR to understand what drives success in this market.
Mountaintop Cabin Village - no cleaning fee
Entire Place • 4 bedrooms
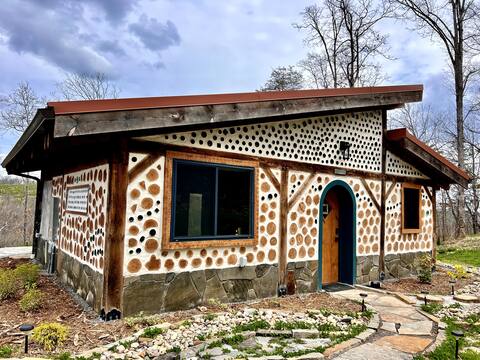
Unique, Handmade Artist's Cabin (no cleaning fee)
Entire Place • 1 bedroom
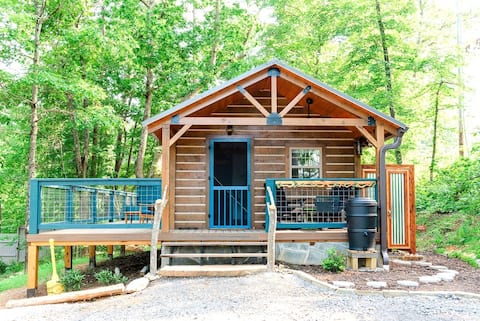
Recharge in Modern Log Cabin - no cleaning fee
Entire Place • 1 bedroom
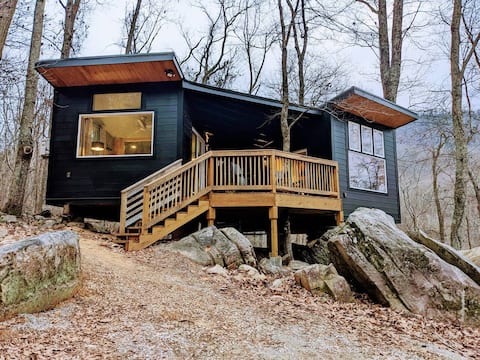
The Bird House~Modern Treehouse
Entire Place • 1 bedroom

Fresh Air, Cozy Cabin, Mtn View, & no cleaning fee
Entire Place • 1 bedroom
Moody, Mountaintop Beauty - no cleaning fee
Entire Place • 1 bedroom
Note: Performance varies based on location, size, amenities, seasonality, and management quality. Data reflects the past 12 months.
Top Performing Airbnb Hosts in Powells Crossroads (2025)
Learn from the best! This table showcases top-performing Airbnb hosts in Powells Crossroads based on the number of properties managed and estimated total revenue over the past year. Analyze their scale and performance metrics.
| Host Name | Properties | Grossing Revenue | Stay Reviews | Avg Rating |
|---|---|---|---|---|
| Bobbie | 5 | $296,492 | 300 | 4.97/5.0 |
| Susanna | 5 | $151,636 | 298 | 4.93/5.0 |
| Lindsey | 3 | $66,582 | 249 | 4.91/5.0 |
| Leiza | 4 | $29,618 | 17 | 2.37/5.0 |
Analyzing the strategies of top hosts, such as their property selection, pricing, and guest communication, can offer valuable lessons for optimizing your own Airbnb operations in Powells Crossroads.
Dive Deeper: Advanced Powells Crossroads STR Market Data (2025)
Ready to unlock more insights? AirROI provides access to advanced metrics and comprehensive Airbnb data for Powells Crossroads. Explore detailed analytics beyond this report to refine your investment strategy, optimize pricing, and maximize your vacation rental profits.
Explore Advanced MetricsPowells Crossroads Short-Term Rental Market Composition (2025): Property & Room Types
Room Type Distribution
Property Type Distribution
Market Composition Insights for Powells Crossroads
- The Powells Crossroads Airbnb market composition is heavily skewed towards Entire Home/Apt listings, which make up 82.4% of the 17 active rentals. This indicates strong guest preference for privacy and space.
- Looking at the property type distribution in Powells Crossroads, House properties are the most common (64.7%), reflecting the local real estate landscape.
- Houses represent a significant 64.7% portion, catering likely to families or larger groups.
Powells Crossroads Airbnb Room Capacity Analysis (2025): Bedroom Distribution
Distribution of Listings by Number of Bedrooms
Room Capacity Insights for Powells Crossroads
- The dominant room capacity in Powells Crossroads is 1 bedroom listings, making up 70.6% of the market. This suggests a strong demand for properties suitable for couples or solo travelers.
- Together, 1 bedroom and 3 bedrooms properties represent 82.4% of the active Airbnb listings in Powells Crossroads, indicating a high concentration in these sizes.
- With over half the market (70.6%) consisting of studios or 1-bedroom units, Powells Crossroads is particularly well-suited for individuals or couples.
Powells Crossroads Vacation Rental Guest Capacity Trends (2025)
Distribution of Listings by Guest Capacity
Guest Capacity Insights for Powells Crossroads
- The most common guest capacity trend in Powells Crossroads vacation rentals is listings accommodating 4 guests (29.4%). This suggests the primary traveler segment is likely small families or groups.
- Properties designed for 4 guests and 6 guests dominate the Powells Crossroads STR market, accounting for 52.9% of listings.
- 41.2% of properties accommodate 6+ guests, serving the market segment for larger families or group travel in Powells Crossroads.
- On average, properties in Powells Crossroads are equipped to host 4.5 guests.
Powells Crossroads Airbnb Booking Patterns (2025): Available vs. Booked Days
Available Days Distribution
Booked Days Distribution
Booking Pattern Insights for Powells Crossroads
- The most common availability pattern in Powells Crossroads falls within the 181-270 days range, representing 47.1% of listings. This suggests many properties have significant open periods on their calendars.
- Approximately 58.9% of listings show high availability (181+ days open annually), indicating potential for increased bookings or specific owner usage patterns.
- For booked days, the 91-180 days range is most frequent in Powells Crossroads (47.1%), reflecting common guest stay durations or potential owner blocking patterns.
- A notable 41.2% of properties secure long booking periods (181+ days booked per year), highlighting successful long-term rental strategies or significant owner usage.
Powells Crossroads Airbnb Minimum Stay Requirements Analysis
Distribution of Listings by Minimum Night Requirement
1 Night
4 listings
25% of total
2 Nights
8 listings
50% of total
3 Nights
2 listings
12.5% of total
30+ Nights
2 listings
12.5% of total
Key Insights
- The most prevalent minimum stay requirement in Powells Crossroads is 2 Nights, adopted by 50% of listings. This highlights the market's preference for shorter, flexible bookings.
- A strong majority (75.0%) of the Powells Crossroads Airbnb data shows acceptance of very short stays (1-2 nights), indicating a dynamic, high-turnover market.
- A significant segment (12.5%) caters to monthly stays (30+ nights) in Powells Crossroads, pointing to opportunities in the extended-stay market.
Recommendations
- Align with the market by considering a 2 Nights minimum stay, as 50% of Powells Crossroads hosts use this setting.
- If feasible, allowing 1-night stays, especially midweek or during low season, could capture last-minute bookings, as only 25% currently do.
- Explore offering discounts for stays of 30+ nights to attract the 12.5% of the market seeking extended stays.
- Adjust minimum nights based on seasonality – potentially shorter during low season and longer during peak demand periods in Powells Crossroads.
Powells Crossroads Airbnb Cancellation Policy Trends Analysis (2025)
Flexible
2 listings
14.3% of total
Moderate
4 listings
28.6% of total
Firm
4 listings
28.6% of total
Strict
4 listings
28.6% of total
Cancellation Policy Insights for Powells Crossroads
- The prevailing Airbnb cancellation policy trend in Powells Crossroads is Moderate, used by 28.6% of listings.
- A majority (57.2%) of hosts in Powells Crossroads utilize Firm or Strict policies, indicating a market where hosts prioritize booking security.
Recommendations for Hosts
- Consider adopting a Moderate policy to align with the 28.6% market standard in Powells Crossroads.
- Regularly review your cancellation policy against competitors and market demand shifts in Powells Crossroads.
Powells Crossroads STR Booking Lead Time Analysis (2025)
Average Booking Lead Time by Month
Booking Lead Time Insights for Powells Crossroads
- The overall average booking lead time for vacation rentals in Powells Crossroads is 20 days.
- Guests book furthest in advance for stays during August (average 39 days), likely coinciding with peak travel demand or local events.
- The shortest booking windows occur for stays in March (average 11 days), indicating more last-minute travel plans during this time.
- Seasonally, Summer (37 days avg.) sees the longest lead times, while Winter (18 days avg.) has the shortest, reflecting typical travel planning cycles.
Recommendations for Hosts
- Use the overall average lead time (20 days) as a baseline for your pricing and availability strategy in Powells Crossroads.
- For August stays, consider implementing length-of-stay discounts or slightly higher rates for bookings made less than 39 days out to capitalize on advance planning.
- During March, focus on last-minute booking availability and promotions, as guests book with very short notice (11 days avg.).
- Target marketing efforts for the Summer season well in advance (at least 37 days) to capture early planners.
- Monitor your own booking lead times against these Powells Crossroads averages to identify opportunities for dynamic pricing adjustments.
Popular & Essential Airbnb Amenities in Powells Crossroads (2025)
Amenity Prevalence
Amenity Insights for Powells Crossroads
- Essential amenities in Powells Crossroads that guests expect include: TV, Air conditioning, Wifi, Hot water, Heating, Smoke alarm, Free parking on premises. Lacking these (any) could significantly impact bookings.
- Popular amenities like Microwave, Outdoor furniture, Bed linens are common but not universal. Offering these can provide a competitive edge.
Recommendations for Hosts
- Ensure your listing includes all essential amenities for Powells Crossroads: TV, Air conditioning, Wifi, Hot water, Heating, Smoke alarm, Free parking on premises.
- Consider adding popular differentiators like Microwave or Outdoor furniture to increase appeal.
- Highlight unique or less common amenities you offer (e.g., hot tub, dedicated workspace, EV charger) in your listing description and photos.
- Regularly check competitor amenities in Powells Crossroads to stay competitive.
Powells Crossroads Airbnb Guest Demographics & Profile Analysis (2025)
Guest Profile Summary for Powells Crossroads
- The typical guest profile for Airbnb in Powells Crossroads consists of primarily domestic travelers (99%), often arriving from nearby Nashville, typically belonging to the Post-2000s (Gen Z/Alpha) group (50%), primarily speaking English or Spanish.
- Domestic travelers account for 98.8% of guests.
- Key international markets include United States (98.8%) and Canada (0.4%).
- Top languages spoken are English (87.1%) followed by Spanish (7.2%).
- A significant demographic segment is the Post-2000s (Gen Z/Alpha) group, representing 50% of guests.
Recommendations for Hosts
- Target domestic marketing efforts towards travelers from Nashville and Atlanta.
- Tailor amenities and listing descriptions to appeal to the dominant Post-2000s (Gen Z/Alpha) demographic (e.g., highlight fast WiFi, smart home features, local guides).
- Highlight unique local experiences or amenities relevant to the primary guest profile.
- Consider seasonal promotions aligned with peak travel times for key origin markets.
Nearby Short-Term Rental Market Comparison
How does the Powells Crossroads Airbnb market stack up against its neighbors? Compare key performance metrics like average monthly revenue, ADR, and occupancy rates in surrounding areas to understand the broader regional STR landscape.
| Market | Active Properties | Monthly Revenue | Daily Rate | Avg. Occupancy |
|---|---|---|---|---|
| Gilmer County | 22 | $4,696 | $342.13 | 43% |
| Cedar Bluff | 33 | $4,317 | $458.84 | 39% |
| Fannin County | 37 | $4,285 | $339.52 | 41% |
| Waleska | 41 | $4,156 | $346.72 | 42% |
| Epworth | 68 | $3,983 | $341.99 | 40% |
| Berry Hill | 132 | $3,977 | $291.14 | 47% |
| Brentwood | 17 | $3,903 | $351.37 | 39% |
| Blue Ridge | 1,105 | $3,888 | $290.46 | 45% |
| Mt. Juliet | 51 | $3,672 | $302.68 | 46% |
| Nashville-Davidson | 7,508 | $3,597 | $287.82 | 45% |