Hartford Airbnb Market Analysis 2025: Short Term Rental Data & Vacation Rental Statistics in Tennessee, United States
Is Airbnb profitable in Hartford in 2025? Explore comprehensive Airbnb analytics for Hartford, Tennessee, United States to uncover income potential. This 2025 STR market report for Hartford, based on AirROI data from April 2024 to March 2025, reveals key trends in the niche market of 18 active listings.
Whether you're considering an Airbnb investment in Hartford, optimizing your existing vacation rental, or exploring rental arbitrage opportunities, understanding the Hartford Airbnb data is crucial. Leveraging the low regulation environment is key to maximizing your short term rental income potential. Let's dive into the specifics.
Key Hartford Airbnb Performance Metrics Overview
Monthly Airbnb Revenue Variations & Income Potential in Hartford (2025)
Understanding the monthly revenue variations for Airbnb listings in Hartford is key to maximizing your short term rental income potential. Seasonality significantly impacts earnings. Our analysis, based on data from the past 12 months, shows that the peak revenue month for STRs in Hartford is typically December, while September often presents the lowest earnings, highlighting opportunities for strategic pricing adjustments during shoulder and low seasons. Explore the typical Airbnb income in Hartford across different performance tiers:
- Best-in-class properties (Top 10%) achieve $4,449+ monthly, often utilizing dynamic pricing and superior guest experiences.
- Strong performing properties (Top 25%) earn $2,945 or more, indicating effective management and desirable locations/amenities.
- Typical properties (Median) generate around $1,420 per month, representing the average market performance.
- Entry-level properties (Bottom 25%) see earnings around $611, often with potential for optimization.
Average Monthly Airbnb Earnings Trend in Hartford
Hartford Airbnb Occupancy Rate Trends (2025)
Maximize your bookings by understanding the Hartford STR occupancy trends. Seasonal demand shifts significantly influence how often properties are booked. Typically, Novembersees the highest demand (peak season occupancy), while February experiences the lowest (low season). Effective strategies, like adjusting minimum stays or offering promotions, can boost occupancy during slower periods. Here's how different property tiers perform in Hartford:
- Best-in-class properties (Top 10%) achieve 73%+ occupancy, indicating high desirability and potentially optimized availability.
- Strong performing properties (Top 25%) maintain 49% or higher occupancy, suggesting good market fit and guest satisfaction.
- Typical properties (Median) have an occupancy rate around 28%.
- Entry-level properties (Bottom 25%) average 15% occupancy, potentially facing higher vacancy.
Average Monthly Occupancy Rate Trend in Hartford
Average Daily Rate (ADR) Airbnb Trends in Hartford (2025)
Effective short term rental pricing strategy in Hartford involves understanding monthly ADR fluctuations. The Average Daily Rate (ADR) for Airbnb in Hartford typically peaks in January and dips lowest during April. Leveraging Airbnb dynamic pricing tools or strategies based on this seasonality can significantly boost revenue. Here's a look at the typical nightly rates achieved:
- Best-in-class properties (Top 10%) command rates of $202+ per night, often due to premium features or locations.
- Strong performing properties (Top 25%) achieve nightly rates of $139 or more.
- Typical properties (Median) charge around $109 per night.
- Entry-level properties (Bottom 25%) earn around $86 per night.
Average Daily Rate (ADR) Trend by Month in Hartford
Get Live Hartford Market Intelligence 👇

Explore Real-time Analytics
Airbnb Seasonality Analysis & Trends in Hartford (2025)
Peak Season (December, May, April)
- Revenue averages $2,786 per month
- Occupancy rates average 43.7%
- Daily rates average $120
Shoulder Season
- Revenue averages $1,983 per month
- Occupancy maintains around 35.2%
- Daily rates hold near $118
Low Season (February, March, September)
- Revenue drops to average $1,333 per month
- Occupancy decreases to average 25.3%
- Daily rates adjust to average $124
Seasonality Insights for Hartford
- The Airbnb seasonality in Hartford shows highly seasonal trends requiring careful strategy. While the sections above show seasonal averages, it's also insightful to look at the extremes:
- During the high season, the absolute peak month showcases Hartford's highest earning potential, with monthly revenues capable of climbing to $3,305, occupancy reaching a high of 46.7%, and ADRs peaking at $135.
- Conversely, the slowest single month of the year, typically falling within the low season, marks the market's lowest point. In this month, revenue might dip to $1,165, occupancy could drop to 20.1%, and ADRs may adjust down to $112.
- Understanding both the seasonal averages and these monthly peaks and troughs in revenue, occupancy, and ADR is crucial for maximizing your Airbnb profit potential in Hartford.
Seasonal Strategies for Maximizing Profit
- Peak Season: Maximize revenue through premium pricing and potentially longer minimum stays. Ensure high availability.
- Low Season: Offer competitive pricing, special promotions (e.g., extended stay discounts), and flexible cancellation policies. Target off-season travelers like remote workers or budget-conscious guests.
- Shoulder Seasons: Implement dynamic pricing that balances peak and low rates. Target weekend travelers or specific events. Offer slightly more flexible terms than peak season.
- Regularly analyze your own performance against these Hartford seasonality benchmarks and adjust your pricing and availability strategy accordingly.
Best Areas for Airbnb Investment in Hartford (2025)
Exploring the top neighborhoods for short-term rentals in Hartford? This section highlights key areas, outlining why they are attractive for hosts and guests, along with notable local attractions. Consider these locations based on your target guest profile and investment strategy.
| Neighborhood / Area | Why Host Here? (Target Guests & Appeal) | Key Attractions & Landmarks |
|---|---|---|
| Downtown Hartford | The central business district with a range of activities including dining, entertainment, and cultural attractions. Ideal for travelers attending conferences or exploring the city's rich history. | Connecticut Science Center, Bushnell Park, Hartford Stage, XL Center, Wadsworth Atheneum Museum of Art |
| West Hartford | A vibrant suburban area known for its shopping, dining, and parks. Popular among families and those looking for a quieter stay while still close to Hartford. | Blue Back Square, West Hartford Reservoir, Elizabeth Park, The Eye of the Hawk, The Children's Museum |
| Hartford North End | A historic area with a strong community feel, attracting those interested in local culture and history. Great for visitors who want to experience authentic Hartford life. | Keney Park, The Old State House, Hartford Athletic, Bliss Garden, Mildred Barry Garvey Pavilion |
| Trumbull Street | A key area known for its nightlife, restaurants, and proximity to downtown activities. Ideal for groups and young professionals. | Hartford's City Hall, The Capitol Building, Hartford Courant, dining options on Trumbull Street, bar scene |
| South End | An up-and-coming area that offers a blend of urban living and residential charm. Attracts visitors looking for a more local experience away from the downtown rush. | Riverfront Park, Mortensen Riverfront Plaza, Windsor Historical Society, Front Street District, Hartford Fish and Game Club |
| Capitol District | Home to the Connecticut State Capitol, this area is rich in history and is a desired spot for tourists interested in politics and heritage. | Connecticut State Capitol, Bushnell Park, Museum of Connecticut History, McLevy Hall, Hartford History Center |
| Asylum Hill | A diverse neighborhood that provides easy access to downtown Hartford while offering a variety of local amenities and parks, suitable for longer stays. | Aetna Headquarters, Hartford Hospital, Asylum Hill Congregational Church, Mark Twain House, Elizabeth Park Rose Garden |
| Parkville | A growing artistic neighborhood that appeals to creative types and young professionals with its galleries, studios, and unique dining options. | Parkville Sound, Hartford ArtSpace, The Parkville Market, Kinsella Magnet School of Performing Arts, local artisanal shops |
Understanding Airbnb License Requirements & STR Laws in Hartford (2025)
While Hartford, Tennessee, United States currently shows low STR regulations, specific Airbnb license requirements might still exist or change. Always verify the latest short term rental regulations and Airbnb license requirements directly with local government authorities for Hartford to ensure full compliance before hosting.
(Source: AirROI data, 2025, finding no licensed listings among those analyzed)
Top Performing Airbnb Properties in Hartford (2025)
Benchmark your potential! Explore examples of top-performing Airbnb properties in Hartfordbased on Trailing Twelve Month (TTM) revenue. Analyze their characteristics, revenue, occupancy rate, and ADR to understand what drives success in this market.
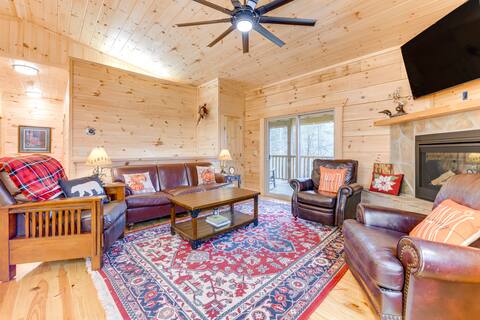
Smoky Mountain Cabin Rental w/ Hot Tub & Views!
Entire Place • 5 bedrooms

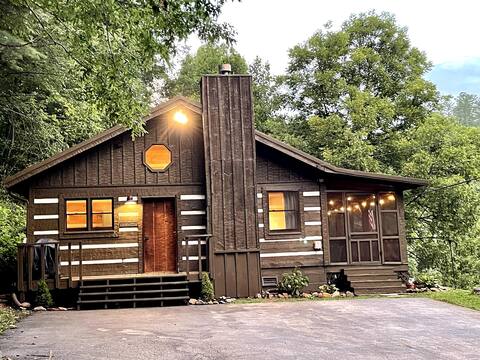
Cool Valley Cabin at Grassy Fork
Entire Place • 3 bedrooms
Smoky Mountain Log Cabin Close to Rafting!
Entire Place • 4 bedrooms
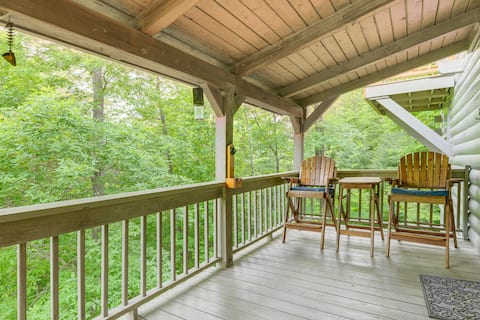
Family friendly cabin; screened porch and fire pit
Entire Place • 3 bedrooms

Smokey Mountain Getaway Orchid Villa
Entire Place • 2 bedrooms
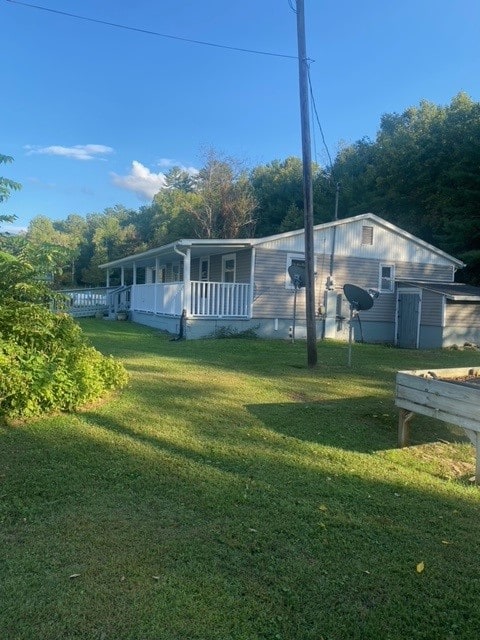
Grassy Fork Cottage
Entire Place • 3 bedrooms
Note: Performance varies based on location, size, amenities, seasonality, and management quality. Data reflects the past 12 months.
Top Performing Airbnb Hosts in Hartford (2025)
Learn from the best! This table showcases top-performing Airbnb hosts in Hartford based on the number of properties managed and estimated total revenue over the past year. Analyze their scale and performance metrics.
| Host Name | Properties | Grossing Revenue | Stay Reviews | Avg Rating |
|---|---|---|---|---|
| Evolve | 2 | $96,019 | 62 | 4.71/5.0 |
| Michael | 2 | $35,907 | 30 | 4.96/5.0 |
| Daniel | 1 | $30,937 | 214 | 4.98/5.0 |
| Jamie | 1 | $22,058 | 34 | 4.91/5.0 |
| Regenia | 1 | $14,410 | 9 | 5.00/5.0 |
| Jessica | 1 | $14,016 | 15 | 4.93/5.0 |
| Rob And Kim | 1 | $10,631 | 69 | 4.97/5.0 |
| Maria | 6 | $10,094 | 124 | 4.51/5.0 |
| Host #347328655 | 1 | $2,329 | 18 | 4.94/5.0 |
| Denise | 2 | $2,115 | 125 | 4.86/5.0 |
Analyzing the strategies of top hosts, such as their property selection, pricing, and guest communication, can offer valuable lessons for optimizing your own Airbnb operations in Hartford.
Dive Deeper: Advanced Hartford STR Market Data (2025)
Ready to unlock more insights? AirROI provides access to advanced metrics and comprehensive Airbnb data for Hartford. Explore detailed analytics beyond this report to refine your investment strategy, optimize pricing, and maximize your vacation rental profits.
Explore Advanced MetricsHartford Short-Term Rental Market Composition (2025): Property & Room Types
Room Type Distribution
Property Type Distribution
Market Composition Insights for Hartford
- The Hartford Airbnb market composition is heavily skewed towards Entire Home/Apt listings, which make up 66.7% of the 18 active rentals. This indicates strong guest preference for privacy and space.
- However, a notable 27.8% share for Private Rooms suggests opportunities for budget-conscious travelers or hosts renting out spare rooms.
- Looking at the property type distribution in Hartford, Outdoor/Unique properties are the most common (38.9%), reflecting the local real estate landscape.
- Houses represent a significant 27.8% portion, catering likely to families or larger groups.
- The presence of 16.7% Hotel/Boutique listings indicates integration with traditional hospitality.
Hartford Airbnb Room Capacity Analysis (2025): Bedroom Distribution
Distribution of Listings by Number of Bedrooms
Room Capacity Insights for Hartford
- The dominant room capacity in Hartford is 1 bedroom listings, making up 33.3% of the market. This suggests a strong demand for properties suitable for couples or solo travelers.
- Together, 1 bedroom and 3 bedrooms properties represent 55.5% of the active Airbnb listings in Hartford, indicating a high concentration in these sizes.
- A significant 33.4% of listings offer 3+ bedrooms, catering to larger groups and families seeking more space in Hartford.
Hartford Vacation Rental Guest Capacity Trends (2025)
Distribution of Listings by Guest Capacity
Guest Capacity Insights for Hartford
- The most common guest capacity trend in Hartford vacation rentals is listings accommodating 8+ guests (22.2%). This suggests the primary traveler segment is likely larger groups.
- Properties designed for 8+ guests and 5 guests dominate the Hartford STR market, accounting for 38.9% of listings.
- 38.9% of properties accommodate 6+ guests, serving the market segment for larger families or group travel in Hartford.
- On average, properties in Hartford are equipped to host 4.6 guests.
Hartford Airbnb Booking Patterns (2025): Available vs. Booked Days
Available Days Distribution
Booked Days Distribution
Booking Pattern Insights for Hartford
- The most common availability pattern in Hartford falls within the 271-366 days range, representing 55.6% of listings. This suggests many properties have significant open periods on their calendars.
- Approximately 94.5% of listings show high availability (181+ days open annually), indicating potential for increased bookings or specific owner usage patterns.
- For booked days, the 91-180 days range is most frequent in Hartford (44.4%), reflecting common guest stay durations or potential owner blocking patterns.
- A notable 5.6% of properties secure long booking periods (181+ days booked per year), highlighting successful long-term rental strategies or significant owner usage.
Hartford Airbnb Minimum Stay Requirements Analysis
Distribution of Listings by Minimum Night Requirement
1 Night
7 listings
41.2% of total
2 Nights
9 listings
52.9% of total
30+ Nights
1 listings
5.9% of total
Key Insights
- The most prevalent minimum stay requirement in Hartford is 2 Nights, adopted by 52.9% of listings. This highlights the market's preference for shorter, flexible bookings.
- A strong majority (94.1%) of the Hartford Airbnb data shows acceptance of very short stays (1-2 nights), indicating a dynamic, high-turnover market.
Recommendations
- Align with the market by considering a 2 Nights minimum stay, as 52.9% of Hartford hosts use this setting.
- Explore offering discounts for stays of 30+ nights to attract the 5.9% of the market seeking extended stays.
- Adjust minimum nights based on seasonality – potentially shorter during low season and longer during peak demand periods in Hartford.
Hartford Airbnb Cancellation Policy Trends Analysis (2025)
Flexible
2 listings
11.8% of total
Moderate
6 listings
35.3% of total
Firm
3 listings
17.6% of total
Strict
6 listings
35.3% of total
Cancellation Policy Insights for Hartford
- The prevailing Airbnb cancellation policy trend in Hartford is Moderate, used by 35.3% of listings.
- A majority (52.9%) of hosts in Hartford utilize Firm or Strict policies, indicating a market where hosts prioritize booking security.
Recommendations for Hosts
- Consider adopting a Moderate policy to align with the 35.3% market standard in Hartford.
- With 35.3% using Strict terms, this is a viable option in Hartford, particularly for high-value properties or during peak demand periods.
- Regularly review your cancellation policy against competitors and market demand shifts in Hartford.
Hartford STR Booking Lead Time Analysis (2025)
Average Booking Lead Time by Month
Booking Lead Time Insights for Hartford
- The overall average booking lead time for vacation rentals in Hartford is 43 days.
- Guests book furthest in advance for stays during December (average 86 days), likely coinciding with peak travel demand or local events.
- The shortest booking windows occur for stays in March (average 12 days), indicating more last-minute travel plans during this time.
- Seasonally, Fall (69 days avg.) sees the longest lead times, while Spring (30 days avg.) has the shortest, reflecting typical travel planning cycles.
Recommendations for Hosts
- Use the overall average lead time (43 days) as a baseline for your pricing and availability strategy in Hartford.
- For December stays, consider implementing length-of-stay discounts or slightly higher rates for bookings made less than 86 days out to capitalize on advance planning.
- During March, focus on last-minute booking availability and promotions, as guests book with very short notice (12 days avg.).
- Target marketing efforts for the Fall season well in advance (at least 69 days) to capture early planners.
- Monitor your own booking lead times against these Hartford averages to identify opportunities for dynamic pricing adjustments.
Popular & Essential Airbnb Amenities in Hartford (2025)
Amenity Prevalence
Amenity Insights for Hartford
- Essential amenities in Hartford that guests expect include: Heating, Free parking on premises, Smoke alarm. Lacking these (any) could significantly impact bookings.
- Popular amenities like Wifi, Cooking basics, Kitchen are common but not universal. Offering these can provide a competitive edge.
- Warning: Wifi is not universally provided but is considered essential globally. Ensure reliable Wifi is offered.
Recommendations for Hosts
- Ensure your listing includes all essential amenities for Hartford: Heating, Free parking on premises, Smoke alarm.
- Consider adding popular differentiators like Wifi or Cooking basics to increase appeal.
- Highlight unique or less common amenities you offer (e.g., hot tub, dedicated workspace, EV charger) in your listing description and photos.
- Regularly check competitor amenities in Hartford to stay competitive.
Hartford Airbnb Guest Demographics & Profile Analysis (2025)
Guest Profile Summary for Hartford
- The typical guest profile for Airbnb in Hartford consists of primarily domestic travelers (100%), often arriving from nearby Newport, typically belonging to the Post-2000s (Gen Z/Alpha) group (50%), primarily speaking English or Spanish.
- Domestic travelers account for 100.0% of guests.
- Top languages spoken are English (70%) followed by Spanish (10%).
- A significant demographic segment is the Post-2000s (Gen Z/Alpha) group, representing 50% of guests.
Recommendations for Hosts
- Target domestic marketing efforts towards travelers from Newport and Atlanta.
- Tailor amenities and listing descriptions to appeal to the dominant Post-2000s (Gen Z/Alpha) demographic (e.g., highlight fast WiFi, smart home features, local guides).
- Highlight unique local experiences or amenities relevant to the primary guest profile.
- Consider seasonal promotions aligned with peak travel times for key origin markets.
Nearby Short-Term Rental Market Comparison
How does the Hartford Airbnb market stack up against its neighbors? Compare key performance metrics like average monthly revenue, ADR, and occupancy rates in surrounding areas to understand the broader regional STR landscape.
| Market | Active Properties | Monthly Revenue | Daily Rate | Avg. Occupancy |
|---|---|---|---|---|
| Union Mills | 14 | $5,934 | $458.57 | 43% |
| Sevier County | 54 | $5,803 | $490.32 | 44% |
| Gilmer County | 22 | $4,696 | $342.13 | 43% |
| Sevierville | 5,187 | $4,592 | $318.77 | 48% |
| Six Mile | 57 | $4,391 | $411.67 | 43% |
| Fannin County | 37 | $4,285 | $339.52 | 41% |
| West Union | 31 | $4,282 | $513.72 | 38% |
| Gatlinburg | 2,866 | $4,172 | $307.44 | 47% |
| Waleska | 41 | $4,156 | $346.72 | 42% |
| Wears Valley | 192 | $4,135 | $299.08 | 44% |