Preston Airbnb Market Analysis 2026: Short Term Rental Data & Vacation Rental Statistics in Southeastern Connecticut Planning Region, United States
Is Airbnb profitable in Preston in 2026? Explore comprehensive Airbnb analytics for Preston, Southeastern Connecticut Planning Region, United States to uncover income potential. This 2026 STR market report for Preston, based on AirROI data from February 2025 to January 2026, reveals key trends in the niche market of 20 active listings.
Whether you're considering an Airbnb investment in Preston, optimizing your existing vacation rental, or exploring rental arbitrage opportunities, understanding the Preston Airbnb data is crucial. Leveraging the low regulation environment is key to maximizing your short term rental income potential. Let's dive into the specifics.
Key Preston Airbnb Performance Metrics Overview
Monthly Airbnb Revenue Variations & Income Potential in Preston (2026)
Understanding the monthly revenue variations for Airbnb listings in Preston is key to maximizing your short term rental income potential. Seasonality significantly impacts earnings. Our analysis, based on data from the past 12 months, shows that the peak revenue month for STRs in Preston is typically August, while January often presents the lowest earnings, highlighting opportunities for strategic pricing adjustments during shoulder and low seasons. Explore the typical Airbnb income in Preston across different performance tiers:
- Best-in-class properties (Top 10%) achieve $8,677+ monthly, often utilizing dynamic pricing and superior guest experiences.
- Strong performing properties (Top 25%) earn $6,563 or more, indicating effective management and desirable locations/amenities.
- Typical properties (Median) generate around $3,579 per month, representing the average market performance.
- Entry-level properties (Bottom 25%) see earnings around $1,717, often with potential for optimization.
Average Monthly Airbnb Earnings Trend in Preston
Preston Airbnb Occupancy Rate Trends (2026)
Maximize your bookings by understanding the Preston STR occupancy trends. Seasonal demand shifts significantly influence how often properties are booked. Typically, Augustsees the highest demand (peak season occupancy), while January experiences the lowest (low season). Effective strategies, like adjusting minimum stays or offering promotions, can boost occupancy during slower periods. Here's how different property tiers perform in Preston:
- Best-in-class properties (Top 10%) achieve 72%+ occupancy, indicating high desirability and potentially optimized availability.
- Strong performing properties (Top 25%) maintain 54% or higher occupancy, suggesting good market fit and guest satisfaction.
- Typical properties (Median) have an occupancy rate around 36%.
- Entry-level properties (Bottom 25%) average 24% occupancy, potentially facing higher vacancy.
Average Monthly Occupancy Rate Trend in Preston
Average Daily Rate (ADR) Airbnb Trends in Preston (2026)
Effective short term rental pricing strategy in Preston involves understanding monthly ADR fluctuations. The Average Daily Rate (ADR) for Airbnb in Preston typically peaks in July and dips lowest during February. Leveraging Airbnb dynamic pricing tools or strategies based on this seasonality can significantly boost revenue. Here's a look at the typical nightly rates achieved:
- Best-in-class properties (Top 10%) command rates of $505+ per night, often due to premium features or locations.
- Strong performing properties (Top 25%) achieve nightly rates of $382 or more.
- Typical properties (Median) charge around $284 per night.
- Entry-level properties (Bottom 25%) earn around $208 per night.
Average Daily Rate (ADR) Trend by Month in Preston
Get Live Preston Market Intelligence 👇

Explore Real-time Analytics
Airbnb Seasonality Analysis & Trends in Preston (2026)
Peak Season (August, July, September)
- Revenue averages $6,520 per month
- Occupancy rates average 57.4%
- Daily rates average $330
Shoulder Season
- Revenue averages $4,076 per month
- Occupancy maintains around 37.9%
- Daily rates hold near $316
Low Season (January, February, March)
- Revenue drops to average $2,557 per month
- Occupancy decreases to average 28.1%
- Daily rates adjust to average $296
Seasonality Insights for Preston
- The Airbnb seasonality in Preston shows highly seasonal trends requiring careful strategy. While the sections above show seasonal averages, it's also insightful to look at the extremes:
- During the high season, the absolute peak month showcases Preston's highest earning potential, with monthly revenues capable of climbing to $7,791, occupancy reaching a high of 65.4%, and ADRs peaking at $343.
- Conversely, the slowest single month of the year, typically falling within the low season, marks the market's lowest point. In this month, revenue might dip to $2,126, occupancy could drop to 21.1%, and ADRs may adjust down to $288.
- Understanding both the seasonal averages and these monthly peaks and troughs in revenue, occupancy, and ADR is crucial for maximizing your Airbnb profit potential in Preston.
Seasonal Strategies for Maximizing Profit
- Peak Season: Maximize revenue through premium pricing and potentially longer minimum stays. Ensure high availability.
- Low Season: Offer competitive pricing, special promotions (e.g., extended stay discounts), and flexible cancellation policies. Target off-season travelers like remote workers or budget-conscious guests.
- Shoulder Seasons: Implement dynamic pricing that balances peak and low rates. Target weekend travelers or specific events. Offer slightly more flexible terms than peak season.
- Regularly analyze your own performance against these Preston seasonality benchmarks and adjust your pricing and availability strategy accordingly.
Best Areas for Airbnb Investment in Preston (2026)
Exploring the top neighborhoods for short-term rentals in Preston? This section highlights key areas, outlining why they are attractive for hosts and guests, along with notable local attractions. Consider these locations based on your target guest profile and investment strategy.
| Neighborhood / Area | Why Host Here? (Target Guests & Appeal) | Key Attractions & Landmarks |
|---|---|---|
| Mystic | A charming seaside village known for its vibrant maritime history, Mystic is a favorite among tourists due to its scenic waterfront, historic sites, and family-friendly attractions. | Mystic Seaport, Mystic Aquarium, Olde Mistick Village, Charles W. Morgan, Mystic River Park |
| Old Saybrook | Located at the mouth of the Connecticut River, Old Saybrook offers beautiful views, beaches, and a rich history. It's ideal for weekend getaways and summer retreats. | Saybrook Point Park, Old Saybrook Lighthouse, Katherine Hepburn Cultural Arts Center, Town Beach, Fort Saybrook |
| Essex | A picturesque town known for its stunning riverfront and quaint downtown area, offering visitors a glimpse of New England charm with boutique shops and dining. | Connecticut River Museum, Essex Village, The Black Seal, Gillette Castle State Park, Cockaponset State Forest |
| Niantic | This coastal gem is known for its beautiful beaches and charming boardwalk, making it a hotspot in the summer for beachgoers and families. | Niantic Bay Boardwalk, Jordan Cove, East Lyme Town Beach, McCook Point Park, Niantic Children's Museum |
| Groton | Home to the U.S. Navy submarine base and several historic sites, Groton attracts visitors interested in naval history and maritime activities. | Submarine Force Museum, Fort Griswold State Park, Sailfest, Bluff Point State Park, Groton Bank Historic District |
| New London | With its rich maritime history, New London features a vibrant arts scene and is home to the Coast Guard and several cultural attractions. | Lyman Allyn Art Museum, U.S. Coast Guard Academy, Downtown New London, Ocean Beach Park, New London Harbor Light |
| Lyme | A small town with a strong artistic community, Lyme is known for its beautiful landscapes and the Lyme Art Association, perfect for those seeking a retreat in nature. | Gilead Hill Historic District, Lyme Art Association, Connecticut River Valley, Higganum Reservoir State Park, Selden Creek |
| Colchester | A family-friendly town with a rich history, Colchester offers parks and recreational activities, making it attractive for visitors looking for a quiet stay. | Colchester Historical Society, Haddam Neck Fair, George T. Wright House, Bacon Academy, Colchester Fish & Game Club |
Understanding Airbnb License Requirements & STR Laws in Preston (2026)
While Preston, Southeastern Connecticut Planning Region, United States currently shows low STR regulations, specific Airbnb license requirements might still exist or change. Always verify the latest short term rental regulations and Airbnb license requirements directly with local government authorities for Preston to ensure full compliance before hosting.
(Source: AirROI data, 2026, finding no licensed listings among those analyzed)
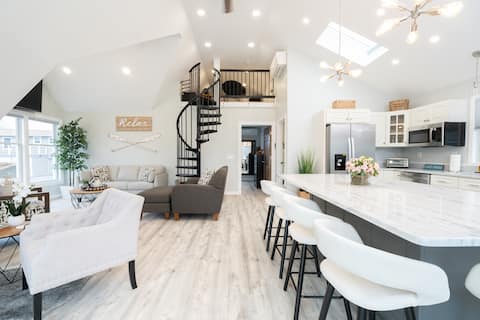
Top Performing Airbnb Properties in Preston (2026)
Benchmark your potential! Explore examples of top-performing Airbnb properties in Prestonbased on Trailing Twelve Month (TTM) revenue. Analyze their characteristics, revenue, occupancy rate, and ADR to understand what drives success in this market.

5 Bedroom Home Golf / Groups 5 Min to Foxwoods
Entire Place • 5 bedrooms

4BR House Near Casinos & Beach With In Law Suite
Entire Place • 4 bedrooms

Peaceful Private Home by Two Casinos in the Woods
Entire Place • 5 bedrooms

Foxwoods 5 Min Away with Pond & Privacy
Entire Place • 3 bedrooms
Lake Home w/Game Room 5 Min To Foxwoods & Mohegan
Entire Place • 1 bedroom
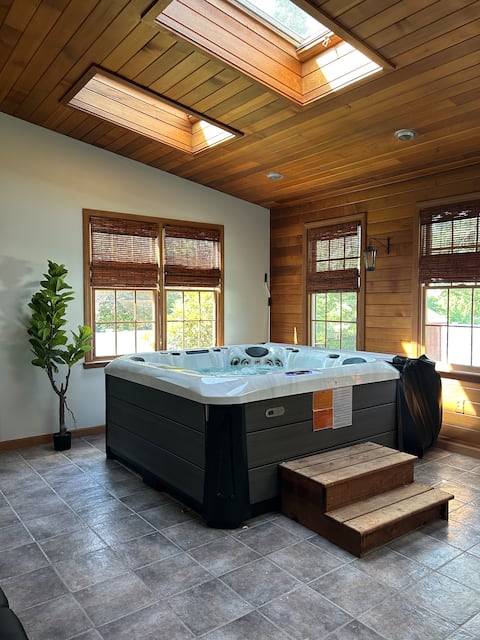
Indoor hot tub minutes to casino
Entire Place • 4 bedrooms
Note: Performance varies based on location, size, amenities, seasonality, and management quality. Data reflects the past 12 months.
Top Performing Airbnb Hosts in Preston (2026)
Learn from the best! This table showcases top-performing Airbnb hosts in Preston based on the number of properties managed and estimated total revenue over the past year. Analyze their scale and performance metrics.
| Host Name | Properties | Grossing Revenue | Stay Reviews | Avg Rating |
|---|---|---|---|---|
| John | 6 | $208,765 | 50 | 4.97/5.0 |
| Victor & Carrie | 1 | $94,648 | 70 | 4.90/5.0 |
| Eva | 1 | $94,059 | 52 | 4.63/5.0 |
| Mary | 1 | $82,065 | 181 | 4.93/5.0 |
| Matthew | 1 | $74,925 | 203 | 5.00/5.0 |
| Alicia | 1 | $74,248 | 128 | 4.73/5.0 |
| Gene | 1 | $55,610 | 57 | 4.98/5.0 |
| Crystal | 1 | $50,367 | 743 | 4.95/5.0 |
| Emmanuel | 1 | $50,323 | 231 | 4.84/5.0 |
| Shana | 1 | $43,389 | 47 | 4.96/5.0 |
Analyzing the strategies of top hosts, such as their property selection, pricing, and guest communication, can offer valuable lessons for optimizing your own Airbnb operations in Preston.
Dive Deeper: Advanced Preston STR Market Data (2026)
Ready to unlock more insights? AirROI provides access to advanced metrics and comprehensive Airbnb data for Preston. Explore detailed analytics beyond this report to refine your investment strategy, optimize pricing, and maximize your vacation rental profits.
Explore Advanced MetricsPreston Short-Term Rental Market Composition (2026): Property & Room Types
Room Type Distribution
Property Type Distribution
Market Composition Insights for Preston
- The Preston Airbnb market composition is heavily skewed towards Entire Home/Apt listings, which make up 75% of the 20 active rentals. This indicates strong guest preference for privacy and space.
- Looking at the property type distribution in Preston, House properties are the most common (60%), reflecting the local real estate landscape.
- Houses represent a significant 60% portion, catering likely to families or larger groups.
- The presence of 25% Hotel/Boutique listings indicates integration with traditional hospitality.
Preston Airbnb Room Capacity Analysis (2026): Bedroom Distribution
Distribution of Listings by Number of Bedrooms
Room Capacity Insights for Preston
- The dominant room capacity in Preston is 2 bedrooms listings, making up 25% of the market. This suggests a strong demand for properties suitable for couples or solo travelers.
- Together, 2 bedrooms and 4 bedrooms properties represent 45.0% of the active Airbnb listings in Preston, indicating a high concentration in these sizes.
- A significant 45.0% of listings offer 3+ bedrooms, catering to larger groups and families seeking more space in Preston.
Preston Vacation Rental Guest Capacity Trends (2026)
Distribution of Listings by Guest Capacity
Guest Capacity Insights for Preston
- The most common guest capacity trend in Preston vacation rentals is listings accommodating 8+ guests (40%). This suggests the primary traveler segment is likely larger groups.
- Properties designed for 8+ guests and 6 guests dominate the Preston STR market, accounting for 70.0% of listings.
- 70.0% of properties accommodate 6+ guests, serving the market segment for larger families or group travel in Preston.
- On average, properties in Preston are equipped to host 5.2 guests.
Preston Airbnb Booking Patterns (2026): Available vs. Booked Days
Available Days Distribution
Booked Days Distribution
Booking Pattern Insights for Preston
- The most common availability pattern in Preston falls within the 181-270 days range, representing 40% of listings. This suggests many properties have significant open periods on their calendars.
- Approximately 80.0% of listings show high availability (181+ days open annually), indicating potential for increased bookings or specific owner usage patterns.
- For booked days, the 91-180 days range is most frequent in Preston (45%), reflecting common guest stay durations or potential owner blocking patterns.
- A notable 20.0% of properties secure long booking periods (181+ days booked per year), highlighting successful long-term rental strategies or significant owner usage.
Preston Airbnb Minimum Stay Requirements Analysis
Distribution of Listings by Minimum Night Requirement
1 Night
10 listings
50% of total
2 Nights
1 listings
5% of total
30+ Nights
9 listings
45% of total
Key Insights
- The most prevalent minimum stay requirement in Preston is 1 Night, adopted by 50% of listings. This highlights the market's preference for shorter, flexible bookings.
- A significant segment (45%) caters to monthly stays (30+ nights) in Preston, pointing to opportunities in the extended-stay market.
Recommendations
- Align with the market by considering a 1 Night minimum stay, as 50% of Preston hosts use this setting.
- Explore offering discounts for stays of 30+ nights to attract the 45% of the market seeking extended stays.
- Adjust minimum nights based on seasonality – potentially shorter during low season and longer during peak demand periods in Preston.
Preston Airbnb Cancellation Policy Trends Analysis (2026)
Limited
1 listings
5% of total
Flexible
3 listings
15% of total
Moderate
7 listings
35% of total
Firm
9 listings
45% of total
Cancellation Policy Insights for Preston
- The prevailing Airbnb cancellation policy trend in Preston is Firm, used by 45% of listings.
- There's a relatively balanced mix between guest-friendly (50.0%) and stricter (45.0%) policies, offering choices for different guest needs.
Recommendations for Hosts
- Consider adopting a Firm policy to align with the 45% market standard in Preston.
- Regularly review your cancellation policy against competitors and market demand shifts in Preston.
Preston STR Booking Lead Time Analysis (2026)
Average Booking Lead Time by Month
Booking Lead Time Insights for Preston
- The overall average booking lead time for vacation rentals in Preston is 52 days.
- Guests book furthest in advance for stays during July (average 84 days), likely coinciding with peak travel demand or local events.
- The shortest booking windows occur for stays in February (average 26 days), indicating more last-minute travel plans during this time.
- Seasonally, Summer (76 days avg.) sees the longest lead times, while Winter (34 days avg.) has the shortest, reflecting typical travel planning cycles.
Recommendations for Hosts
- Use the overall average lead time (52 days) as a baseline for your pricing and availability strategy in Preston.
- For July stays, consider implementing length-of-stay discounts or slightly higher rates for bookings made less than 84 days out to capitalize on advance planning.
- Target marketing efforts for the Summer season well in advance (at least 76 days) to capture early planners.
- Monitor your own booking lead times against these Preston averages to identify opportunities for dynamic pricing adjustments.
Popular & Essential Airbnb Amenities in Preston (2026)
Amenity Prevalence
No amenities with partial availability (less than 100%) were found to display in the chart. All essential amenities might be present in all listings. Check insights below.
Amenity Insights for Preston
- Essential amenities in Preston that guests expect include: Heating, Hot water, Dishes and silverware, Air conditioning, Oven, Fire extinguisher, BBQ grill, Microwave, Carbon monoxide alarm, Smoke alarm. Lacking these (any) could significantly impact bookings.
Recommendations for Hosts
- Ensure your listing includes all essential amenities for Preston: Heating, Hot water, Dishes and silverware, Air conditioning, Oven, Fire extinguisher, BBQ grill, Microwave, Carbon monoxide alarm, Smoke alarm.
- Highlight unique or less common amenities you offer (e.g., hot tub, dedicated workspace, EV charger) in your listing description and photos.
- Regularly check competitor amenities in Preston to stay competitive.
Preston Airbnb Guest Demographics & Profile Analysis (2026)
Guest Profile Summary for Preston
- The typical guest profile for Airbnb in Preston consists of primarily domestic travelers (96%), often arriving from nearby New York, typically belonging to the Post-2000s (Gen Z/Alpha) group (50%), primarily speaking English or Spanish.
- Domestic travelers account for 95.7% of guests.
- Key international markets include United States (95.7%) and Mexico (0.6%).
- Top languages spoken are English (83.3%) followed by Spanish (6.7%).
- A significant demographic segment is the Post-2000s (Gen Z/Alpha) group, representing 50% of guests.
Recommendations for Hosts
- Target domestic marketing efforts towards travelers from New York and Boston.
- Tailor amenities and listing descriptions to appeal to the dominant Post-2000s (Gen Z/Alpha) demographic (e.g., highlight fast WiFi, smart home features, local guides).
- Highlight unique local experiences or amenities relevant to the primary guest profile.
- Consider seasonal promotions aligned with peak travel times for key origin markets.
Nearby Short-Term Rental Market Comparison
How does the Preston Airbnb market stack up against its neighbors? Compare key performance metrics like average monthly revenue, ADR, and occupancy rates in surrounding areas to understand the broader regional STR landscape.
| Market | Active Properties | Monthly Revenue | Daily Rate | Avg. Occupancy |
|---|---|---|---|---|
| Nantucket | 539 | $7,748 | $1045.40 | 41% |
| Sag Harbor | 15 | $6,129 | $1280.84 | 40% |
| Town of East Hampton | 1,327 | $5,945 | $986.02 | 36% |
| Middletown | 395 | $5,781 | $589.01 | 45% |
| North Andover | 12 | $5,625 | $440.84 | 45% |
| Town of Southampton | 1,201 | $5,620 | $1002.45 | 33% |
| Nahant | 13 | $5,564 | $602.44 | 42% |
| Southampton | 19 | $5,405 | $1456.43 | 30% |
| New Shoreham | 120 | $5,359 | $637.79 | 45% |
| Wellesley | 22 | $5,310 | $520.90 | 50% |