Powder House Pass Airbnb Market Analysis 2026: Short Term Rental Data & Vacation Rental Statistics in South Dakota, United States
Is Airbnb profitable in Powder House Pass in 2026? Explore comprehensive Airbnb analytics for Powder House Pass, South Dakota, United States to uncover income potential. This 2026 STR market report for Powder House Pass, based on AirROI data from February 2025 to January 2026, reveals key trends in the niche market of 117 active listings.
Whether you're considering an Airbnb investment in Powder House Pass, optimizing your existing vacation rental, or exploring rental arbitrage opportunities, understanding the Powder House Pass Airbnb data is crucial. Leveraging the low regulation environment is key to maximizing your short term rental income potential. Let's dive into the specifics.
Key Powder House Pass Airbnb Performance Metrics Overview
Monthly Airbnb Revenue Variations & Income Potential in Powder House Pass (2026)
Understanding the monthly revenue variations for Airbnb listings in Powder House Pass is key to maximizing your short term rental income potential. Seasonality significantly impacts earnings. Our analysis, based on data from the past 12 months, shows that the peak revenue month for STRs in Powder House Pass is typically July, while April often presents the lowest earnings, highlighting opportunities for strategic pricing adjustments during shoulder and low seasons. Explore the typical Airbnb income in Powder House Pass across different performance tiers:
- Best-in-class properties (Top 10%) achieve $12,391+ monthly, often utilizing dynamic pricing and superior guest experiences.
- Strong performing properties (Top 25%) earn $9,087 or more, indicating effective management and desirable locations/amenities.
- Typical properties (Median) generate around $6,540 per month, representing the average market performance.
- Entry-level properties (Bottom 25%) see earnings around $4,457, often with potential for optimization.
Average Monthly Airbnb Earnings Trend in Powder House Pass
Powder House Pass Airbnb Occupancy Rate Trends (2026)
Maximize your bookings by understanding the Powder House Pass STR occupancy trends. Seasonal demand shifts significantly influence how often properties are booked. Typically, Julysees the highest demand (peak season occupancy), while January experiences the lowest (low season). Effective strategies, like adjusting minimum stays or offering promotions, can boost occupancy during slower periods. Here's how different property tiers perform in Powder House Pass:
- Best-in-class properties (Top 10%) achieve 62%+ occupancy, indicating high desirability and potentially optimized availability.
- Strong performing properties (Top 25%) maintain 50% or higher occupancy, suggesting good market fit and guest satisfaction.
- Typical properties (Median) have an occupancy rate around 39%.
- Entry-level properties (Bottom 25%) average 27% occupancy, potentially facing higher vacancy.
Average Monthly Occupancy Rate Trend in Powder House Pass
Average Daily Rate (ADR) Airbnb Trends in Powder House Pass (2026)
Effective short term rental pricing strategy in Powder House Pass involves understanding monthly ADR fluctuations. The Average Daily Rate (ADR) for Airbnb in Powder House Pass typically peaks in August and dips lowest during April. Leveraging Airbnb dynamic pricing tools or strategies based on this seasonality can significantly boost revenue. Here's a look at the typical nightly rates achieved:
- Best-in-class properties (Top 10%) command rates of $873+ per night, often due to premium features or locations.
- Strong performing properties (Top 25%) achieve nightly rates of $671 or more.
- Typical properties (Median) charge around $527 per night.
- Entry-level properties (Bottom 25%) earn around $428 per night.
Average Daily Rate (ADR) Trend by Month in Powder House Pass
Get Live Powder House Pass Market Intelligence 👇

Explore Real-time Analytics
Airbnb Seasonality Analysis & Trends in Powder House Pass (2026)
Peak Season (July, June, August)
- Revenue averages $13,653 per month
- Occupancy rates average 65.5%
- Daily rates average $671
Shoulder Season
- Revenue averages $5,662 per month
- Occupancy maintains around 33.2%
- Daily rates hold near $548
Low Season (January, April, November)
- Revenue drops to average $3,697 per month
- Occupancy decreases to average 23.0%
- Daily rates adjust to average $522
Seasonality Insights for Powder House Pass
- The Airbnb seasonality in Powder House Pass shows highly seasonal trends requiring careful strategy. While the sections above show seasonal averages, it's also insightful to look at the extremes:
- During the high season, the absolute peak month showcases Powder House Pass's highest earning potential, with monthly revenues capable of climbing to $16,201, occupancy reaching a high of 76.3%, and ADRs peaking at $687.
- Conversely, the slowest single month of the year, typically falling within the low season, marks the market's lowest point. In this month, revenue might dip to $3,497, occupancy could drop to 19.8%, and ADRs may adjust down to $443.
- Understanding both the seasonal averages and these monthly peaks and troughs in revenue, occupancy, and ADR is crucial for maximizing your Airbnb profit potential in Powder House Pass.
Seasonal Strategies for Maximizing Profit
- Peak Season: Maximize revenue through premium pricing and potentially longer minimum stays. Ensure high availability.
- Low Season: Offer competitive pricing, special promotions (e.g., extended stay discounts), and flexible cancellation policies. Target off-season travelers like remote workers or budget-conscious guests.
- Shoulder Seasons: Implement dynamic pricing that balances peak and low rates. Target weekend travelers or specific events. Offer slightly more flexible terms than peak season.
- Regularly analyze your own performance against these Powder House Pass seasonality benchmarks and adjust your pricing and availability strategy accordingly.
Best Areas for Airbnb Investment in Powder House Pass (2026)
Exploring the top neighborhoods for short-term rentals in Powder House Pass? This section highlights key areas, outlining why they are attractive for hosts and guests, along with notable local attractions. Consider these locations based on your target guest profile and investment strategy.
| Neighborhood / Area | Why Host Here? (Target Guests & Appeal) | Key Attractions & Landmarks |
|---|---|---|
| Hill City | Charming town located near major attractions in the Black Hills, such as Mount Rushmore and Custer State Park. Ideal for tourists seeking outdoor adventures and local culture. | Mount Rushmore National Memorial, Custer State Park, Black Hills Central Railroad, Hill City Art Gallery, Wineries and breweries |
| Keystone | Historic town at the base of Mount Rushmore, offering unique shops, restaurants, and outdoor activities. A great spot for families and history buffs alike. | Mount Rushmore National Memorial, Big Thunder Gold Mine, Rushmore Tramway Adventures, Keystone Historical Museum, Bike trails |
| Rapid City | The second-largest city in South Dakota with a vibrant downtown and proximity to attractions like the Badlands National Park. Popular with urban travelers and families. | Badlands National Park, Reptile Gardens, Dinosaur Park, Downtown Rapid City shops, Ellsworth Air Force Base |
| Deadwood | Historic town known for its Wild West history and vibrant casino scene. Attracts those interested in history, gambling, and entertainment. | Deadwood Historic Main Street, Mount Moriah Cemetery, Wild Bill Hickok's Grave, Deadwood Arts and Crafts Festival, Gaming casinos |
| Custer | Gateway to Custer State Park and offers a picturesque charm with outdoor recreational opportunities. Perfect for nature lovers and families. | Custer State Park, Crazy Horse Memorial, Sylvan Lake, Custer County Candy Company, Wildlife loops |
| Spearfish | Beautiful town known for its outdoor activities, particularly hiking and fishing. A hidden gem for travelers seeking quiet nature experiences. | Spearfish Canyon, Bridal Veil Falls, Spearfish City Park, Hiking trails, Fishing spots |
| Sturgis | Famous for the annual Motorcycle Rally, Sturgis attracts motorcycle enthusiasts and offers a variety of events year-round. Great for those seeking a lively atmosphere. | Sturgis Motorcycle Museum & Hall of Fame, Buffalo Chip Campground, Bear Butte State Park, Local bars and events, Historic downtown |
| Lead | Historical mining town with a unique charm and access to outdoor activities. Popular with tourists looking for a blend of history and recreation. | Black Hills Mining Museum, Lead City Hall and Museum, Terry Peak Ski Area, Hiking trails, Mountain biking paths |
Understanding Airbnb License Requirements & STR Laws in Powder House Pass (2026)
While Powder House Pass, South Dakota, United States currently shows low STR regulations, specific Airbnb license requirements might still exist or change. Always verify the latest short term rental regulations and Airbnb license requirements directly with local government authorities for Powder House Pass to ensure full compliance before hosting.
(Source: AirROI data, 2026, finding no licensed listings among those analyzed)
Top Performing Airbnb Properties in Powder House Pass (2026)
Benchmark your potential! Explore examples of top-performing Airbnb properties in Powder House Passbased on Trailing Twelve Month (TTM) revenue. Analyze their characteristics, revenue, occupancy rate, and ADR to understand what drives success in this market.
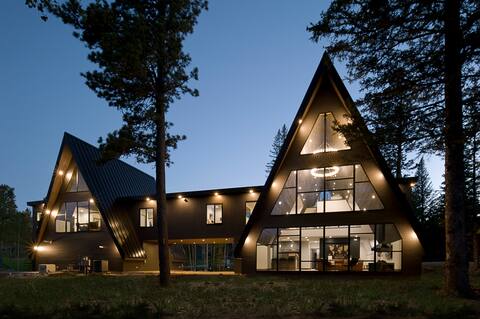
The Parallel
Entire Place • 7 bedrooms
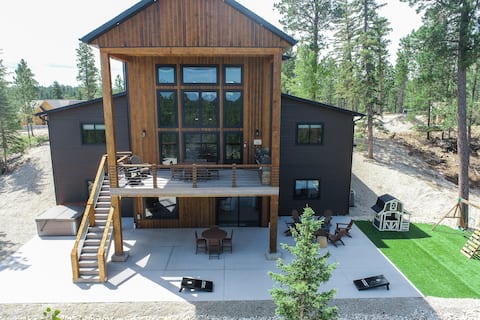
Big Sky 605 Lodge
Entire Place • 6 bedrooms
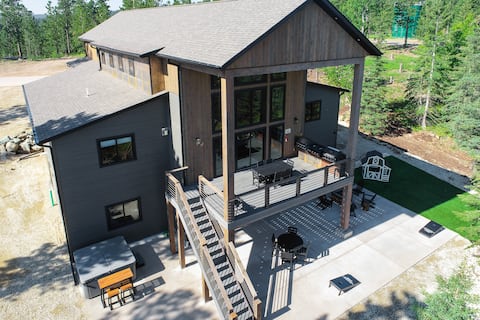
Overlook Trailhead Lodge
Entire Place • 6 bedrooms

New, 6 King Beds, 5 .5 Bath, Home Theater, Hot Tub
Entire Place • 6 bedrooms

Rusty Lantern Lodge
Entire Place • 7 bedrooms

Patriot Paradise
Entire Place • 7 bedrooms
Note: Performance varies based on location, size, amenities, seasonality, and management quality. Data reflects the past 12 months.
Top Performing Airbnb Hosts in Powder House Pass (2026)
Learn from the best! This table showcases top-performing Airbnb hosts in Powder House Pass based on the number of properties managed and estimated total revenue over the past year. Analyze their scale and performance metrics.
| Host Name | Properties | Grossing Revenue | Stay Reviews | Avg Rating |
|---|---|---|---|---|
| Budi | 50 | $3,674,142 | 490 | 4.81/5.0 |
| Black Hills | 18 | $1,266,767 | 416 | 4.96/5.0 |
| Deadwood Connections | 9 | $625,045 | 290 | 4.85/5.0 |
| Into The Woods | 6 | $572,530 | 130 | 5.00/5.0 |
| TrailHound | 6 | $546,974 | 264 | 4.97/5.0 |
| Neil | 2 | $240,231 | 129 | 4.96/5.0 |
| Evolve | 3 | $226,268 | 272 | 4.83/5.0 |
| BlackHillsPremier | 3 | $202,979 | 104 | 4.95/5.0 |
| Elevation Of The Black Hills | 3 | $176,479 | 154 | 4.93/5.0 |
| Russ | 1 | $139,945 | 132 | 4.89/5.0 |
Analyzing the strategies of top hosts, such as their property selection, pricing, and guest communication, can offer valuable lessons for optimizing your own Airbnb operations in Powder House Pass.
Dive Deeper: Advanced Powder House Pass STR Market Data (2026)
Ready to unlock more insights? AirROI provides access to advanced metrics and comprehensive Airbnb data for Powder House Pass. Explore detailed analytics beyond this report to refine your investment strategy, optimize pricing, and maximize your vacation rental profits.
Explore Advanced MetricsPowder House Pass Short-Term Rental Market Composition (2026): Property & Room Types
Room Type Distribution
Property Type Distribution
Market Composition Insights for Powder House Pass
- The Powder House Pass Airbnb market composition is heavily skewed towards Entire Home/Apt listings, which make up 100% of the 117 active rentals. This indicates strong guest preference for privacy and space.
- Looking at the property type distribution in Powder House Pass, Outdoor/Unique properties are the most common (58.1%), reflecting the local real estate landscape.
- Houses represent a significant 41.9% portion, catering likely to families or larger groups.
Powder House Pass Airbnb Room Capacity Analysis (2026): Bedroom Distribution
Distribution of Listings by Number of Bedrooms
Room Capacity Insights for Powder House Pass
- The dominant room capacity in Powder House Pass is 5+ bedrooms listings, making up 70.1% of the market. This suggests a strong demand for properties suitable for families or small groups.
- Together, 5+ bedrooms and 4 bedrooms properties represent 86.3% of the active Airbnb listings in Powder House Pass, indicating a high concentration in these sizes.
- A significant 99.1% of listings offer 3+ bedrooms, catering to larger groups and families seeking more space in Powder House Pass.
Powder House Pass Vacation Rental Guest Capacity Trends (2026)
Distribution of Listings by Guest Capacity
Guest Capacity Insights for Powder House Pass
- The most common guest capacity trend in Powder House Pass vacation rentals is listings accommodating 8+ guests (97.4%). This suggests the primary traveler segment is likely larger groups.
- Properties designed for 8+ guests and 6 guests dominate the Powder House Pass STR market, accounting for 100.0% of listings.
- 100.0% of properties accommodate 6+ guests, serving the market segment for larger families or group travel in Powder House Pass.
- On average, properties in Powder House Pass are equipped to host 7.9 guests.
Powder House Pass Airbnb Booking Patterns (2026): Available vs. Booked Days
Available Days Distribution
Booked Days Distribution
Booking Pattern Insights for Powder House Pass
- The most common availability pattern in Powder House Pass falls within the 181-270 days range, representing 64.1% of listings. This suggests many properties have significant open periods on their calendars.
- Approximately 88.9% of listings show high availability (181+ days open annually), indicating potential for increased bookings or specific owner usage patterns.
- For booked days, the 91-180 days range is most frequent in Powder House Pass (63.2%), reflecting common guest stay durations or potential owner blocking patterns.
- A notable 12.8% of properties secure long booking periods (181+ days booked per year), highlighting successful long-term rental strategies or significant owner usage.
Powder House Pass Airbnb Minimum Stay Requirements Analysis
Distribution of Listings by Minimum Night Requirement
1 Night
4 listings
3.4% of total
2 Nights
33 listings
28.2% of total
3 Nights
6 listings
5.1% of total
30+ Nights
74 listings
63.2% of total
Key Insights
- The most prevalent minimum stay requirement in Powder House Pass is 30+ Nights, adopted by 63.2% of listings. This highlights the market's preference for longer commitments.
- A significant segment (63.2%) caters to monthly stays (30+ nights) in Powder House Pass, pointing to opportunities in the extended-stay market.
Recommendations
- Align with the market by considering a 30+ Nights minimum stay, as 63.2% of Powder House Pass hosts use this setting.
- If feasible, allowing 1-night stays, especially midweek or during low season, could capture last-minute bookings, as only 3.4% currently do.
- Explore offering discounts for stays of 30+ nights to attract the 63.2% of the market seeking extended stays.
- Adjust minimum nights based on seasonality – potentially shorter during low season and longer during peak demand periods in Powder House Pass.
Powder House Pass Airbnb Cancellation Policy Trends Analysis (2026)
Limited
9 listings
7.7% of total
Super Strict 30 Days
51 listings
43.6% of total
Super Strict 60 Days
25 listings
21.4% of total
Moderate
1 listings
0.9% of total
Firm
24 listings
20.5% of total
Strict
7 listings
6% of total
Cancellation Policy Insights for Powder House Pass
- The prevailing Airbnb cancellation policy trend in Powder House Pass is Super Strict 30 Days, used by 43.6% of listings.
- There's a relatively balanced mix between guest-friendly (0.9%) and stricter (26.5%) policies, offering choices for different guest needs.
- Strict cancellation policies are quite rare (6%), potentially making listings with this policy less competitive unless justified by high demand or property type.
Recommendations for Hosts
- Consider adopting a Super Strict 30 Days policy to align with the 43.6% market standard in Powder House Pass.
- Using a Strict policy might deter some guests, as only 6% of listings use it. Evaluate if potential revenue protection outweighs possible lower booking rates.
- Regularly review your cancellation policy against competitors and market demand shifts in Powder House Pass.
Powder House Pass STR Booking Lead Time Analysis (2026)
Average Booking Lead Time by Month
Booking Lead Time Insights for Powder House Pass
- The overall average booking lead time for vacation rentals in Powder House Pass is 92 days.
- Guests book furthest in advance for stays during July (average 185 days), likely coinciding with peak travel demand or local events.
- The shortest booking windows occur for stays in March (average 39 days), indicating more last-minute travel plans during this time.
- Seasonally, Summer (159 days avg.) sees the longest lead times, while Spring (56 days avg.) has the shortest, reflecting typical travel planning cycles.
Recommendations for Hosts
- Use the overall average lead time (92 days) as a baseline for your pricing and availability strategy in Powder House Pass.
- For July stays, consider implementing length-of-stay discounts or slightly higher rates for bookings made less than 185 days out to capitalize on advance planning.
- Target marketing efforts for the Summer season well in advance (at least 159 days) to capture early planners.
- Monitor your own booking lead times against these Powder House Pass averages to identify opportunities for dynamic pricing adjustments.
Popular & Essential Airbnb Amenities in Powder House Pass (2026)
Amenity Prevalence
Amenity Insights for Powder House Pass
- Essential amenities in Powder House Pass that guests expect include: Air conditioning, Free parking on premises, Washer, Kitchen, TV, Wifi, BBQ grill, Smoke alarm, Hot tub, Heating. Lacking these (any) could significantly impact bookings.
Recommendations for Hosts
- Ensure your listing includes all essential amenities for Powder House Pass: Air conditioning, Free parking on premises, Washer, Kitchen, TV, Wifi, BBQ grill, Smoke alarm, Hot tub, Heating.
- Prioritize adding missing essentials: TV, Wifi, BBQ grill, Smoke alarm, Hot tub, Heating.
- Highlight unique or less common amenities you offer (e.g., hot tub, dedicated workspace, EV charger) in your listing description and photos.
- Regularly check competitor amenities in Powder House Pass to stay competitive.
Powder House Pass Airbnb Guest Demographics & Profile Analysis (2026)
Guest Profile Summary for Powder House Pass
- The typical guest profile for Airbnb in Powder House Pass consists of primarily domestic travelers (99%), often arriving from nearby Sioux Falls, typically belonging to the Post-2000s (Gen Z/Alpha) group (50%), primarily speaking English or Spanish.
- Domestic travelers account for 98.5% of guests.
- Key international markets include United States (98.5%) and Canada (0.7%).
- Top languages spoken are English (90.2%) followed by Spanish (5.7%).
- A significant demographic segment is the Post-2000s (Gen Z/Alpha) group, representing 50% of guests.
Recommendations for Hosts
- Target domestic marketing efforts towards travelers from Sioux Falls and Bismarck.
- Tailor amenities and listing descriptions to appeal to the dominant Post-2000s (Gen Z/Alpha) demographic (e.g., highlight fast WiFi, smart home features, local guides).
- Highlight unique local experiences or amenities relevant to the primary guest profile.
- Consider seasonal promotions aligned with peak travel times for key origin markets.
Nearby Short-Term Rental Market Comparison
How does the Powder House Pass Airbnb market stack up against its neighbors? Compare key performance metrics like average monthly revenue, ADR, and occupancy rates in surrounding areas to understand the broader regional STR landscape.
| Market | Active Properties | Monthly Revenue | Daily Rate | Avg. Occupancy |
|---|---|---|---|---|
| Black Hawk | 22 | $3,461 | $320.40 | 46% |
| Nemo | 24 | $3,292 | $379.56 | 46% |
| Lead | 485 | $3,078 | $355.55 | 36% |
| Whitewood | 21 | $2,994 | $348.94 | 41% |
| Deadwood | 139 | $2,916 | $348.42 | 37% |
| Custer | 289 | $2,871 | $267.80 | 47% |
| Keystone | 102 | $2,752 | $268.38 | 48% |
| Rapid City | 678 | $2,626 | $243.25 | 49% |
| Summerset | 16 | $2,605 | $364.02 | 43% |
| Spearfish | 174 | $2,517 | $294.05 | 42% |