Nemo Airbnb Market Analysis 2026: Short Term Rental Data & Vacation Rental Statistics in South Dakota, United States
Is Airbnb profitable in Nemo in 2026? Explore comprehensive Airbnb analytics for Nemo, South Dakota, United States to uncover income potential. This 2026 STR market report for Nemo, based on AirROI data from February 2025 to January 2026, reveals key trends in the niche market of 24 active listings.
Whether you're considering an Airbnb investment in Nemo, optimizing your existing vacation rental, or exploring rental arbitrage opportunities, understanding the Nemo Airbnb data is crucial. Leveraging the low regulation environment is key to maximizing your short term rental income potential. Let's dive into the specifics.
Key Nemo Airbnb Performance Metrics Overview
Monthly Airbnb Revenue Variations & Income Potential in Nemo (2026)
Understanding the monthly revenue variations for Airbnb listings in Nemo is key to maximizing your short term rental income potential. Seasonality significantly impacts earnings. Our analysis, based on data from the past 12 months, shows that the peak revenue month for STRs in Nemo is typically July, while January often presents the lowest earnings, highlighting opportunities for strategic pricing adjustments during shoulder and low seasons. Explore the typical Airbnb income in Nemo across different performance tiers:
- Best-in-class properties (Top 10%) achieve $9,406+ monthly, often utilizing dynamic pricing and superior guest experiences.
- Strong performing properties (Top 25%) earn $6,545 or more, indicating effective management and desirable locations/amenities.
- Typical properties (Median) generate around $3,828 per month, representing the average market performance.
- Entry-level properties (Bottom 25%) see earnings around $2,021, often with potential for optimization.
Average Monthly Airbnb Earnings Trend in Nemo
Nemo Airbnb Occupancy Rate Trends (2026)
Maximize your bookings by understanding the Nemo STR occupancy trends. Seasonal demand shifts significantly influence how often properties are booked. Typically, Augustsees the highest demand (peak season occupancy), while January experiences the lowest (low season). Effective strategies, like adjusting minimum stays or offering promotions, can boost occupancy during slower periods. Here's how different property tiers perform in Nemo:
- Best-in-class properties (Top 10%) achieve 73%+ occupancy, indicating high desirability and potentially optimized availability.
- Strong performing properties (Top 25%) maintain 60% or higher occupancy, suggesting good market fit and guest satisfaction.
- Typical properties (Median) have an occupancy rate around 36%.
- Entry-level properties (Bottom 25%) average 23% occupancy, potentially facing higher vacancy.
Average Monthly Occupancy Rate Trend in Nemo
Average Daily Rate (ADR) Airbnb Trends in Nemo (2026)
Effective short term rental pricing strategy in Nemo involves understanding monthly ADR fluctuations. The Average Daily Rate (ADR) for Airbnb in Nemo typically peaks in August and dips lowest during April. Leveraging Airbnb dynamic pricing tools or strategies based on this seasonality can significantly boost revenue. Here's a look at the typical nightly rates achieved:
- Best-in-class properties (Top 10%) command rates of $726+ per night, often due to premium features or locations.
- Strong performing properties (Top 25%) achieve nightly rates of $412 or more.
- Typical properties (Median) charge around $283 per night.
- Entry-level properties (Bottom 25%) earn around $228 per night.
Average Daily Rate (ADR) Trend by Month in Nemo
Get Live Nemo Market Intelligence 👇
Explore Real-time Analytics
Airbnb Seasonality Analysis & Trends in Nemo (2026)
Peak Season (July, August, September)
- Revenue averages $7,478 per month
- Occupancy rates average 63.6%
- Daily rates average $391
Shoulder Season
- Revenue averages $4,596 per month
- Occupancy maintains around 38.7%
- Daily rates hold near $370
Low Season (January, February, April)
- Revenue drops to average $1,834 per month
- Occupancy decreases to average 19.1%
- Daily rates adjust to average $351
Seasonality Insights for Nemo
- The Airbnb seasonality in Nemo shows highly seasonal trends requiring careful strategy. While the sections above show seasonal averages, it's also insightful to look at the extremes:
- During the high season, the absolute peak month showcases Nemo's highest earning potential, with monthly revenues capable of climbing to $8,087, occupancy reaching a high of 65.7%, and ADRs peaking at $402.
- Conversely, the slowest single month of the year, typically falling within the low season, marks the market's lowest point. In this month, revenue might dip to $1,364, occupancy could drop to 13.8%, and ADRs may adjust down to $331.
- Understanding both the seasonal averages and these monthly peaks and troughs in revenue, occupancy, and ADR is crucial for maximizing your Airbnb profit potential in Nemo.
Seasonal Strategies for Maximizing Profit
- Peak Season: Maximize revenue through premium pricing and potentially longer minimum stays. Ensure high availability.
- Low Season: Offer competitive pricing, special promotions (e.g., extended stay discounts), and flexible cancellation policies. Target off-season travelers like remote workers or budget-conscious guests.
- Shoulder Seasons: Implement dynamic pricing that balances peak and low rates. Target weekend travelers or specific events. Offer slightly more flexible terms than peak season.
- Regularly analyze your own performance against these Nemo seasonality benchmarks and adjust your pricing and availability strategy accordingly.
Best Areas for Airbnb Investment in Nemo (2026)
Exploring the top neighborhoods for short-term rentals in Nemo? This section highlights key areas, outlining why they are attractive for hosts and guests, along with notable local attractions. Consider these locations based on your target guest profile and investment strategy.
| Neighborhood / Area | Why Host Here? (Target Guests & Appeal) | Key Attractions & Landmarks |
|---|---|---|
| Custer State Park | A stunning park known for its scenic drives, wildlife viewing, and hiking opportunities. Ideal for nature lovers and tourists who want outdoor adventure. | Wildlife Loop Road, Sylvan Lake, Needles Highway, Custer State Park Buffalo, Hiking Trails |
| Mount Rushmore | An iconic American landmark drawing millions of visitors for its historic significance and stunning views. Perfect for travelers interested in history and culture. | Mount Rushmore National Memorial, Keystone, Crazy Horse Memorial, Black Hills |
| Rapid City | The main urban center of western South Dakota, offering a variety of attractions, dining, and entertainment. A hub for travelers exploring the Black Hills region. | Downtown Rapid City, Robin Hill Park, The Journey Museum, Dahl Arts Center |
| Deadwood | A historic town rich in Gold Rush history, offering a unique blend of old-west culture and modern gaming. Popular for weekend getaways and history enthusiasts. | Deadwood Historic Main Street, Mount Moriah Cemetery, Adams Museum, Gaming Casinos |
| Hill City | A charming small town located in the heart of the Black Hills, surrounded by scenic beauty and outdoor activities. Attractive for families and nature enthusiasts. | Black Hills Central Railroad, Wineries, Hiking and Biking Trails, Art Galleries |
| Spearfish Canyon | Known for its breathtaking scenery, waterfalls, and outdoor activities like hiking and fishing. Great for those looking to experience the natural beauty of South Dakota. | Spearfish Falls, Bridal Veil Falls, Hiking Trails, Scenic Drives |
| Badlands National Park | A unique national park boasting dramatic landscapes, fossil beds, and a wide variety of wildlife. Perfect for adventurous travelers and photographers. | Badlands Loop Road, Fossil Exhibit Trail, Wall Drug, Wildlife Viewing |
| Sturgis | Famous for the annual Sturgis Motorcycle Rally, this town attracts bikers and enthusiasts year-round. Offers a unique cultural experience centered around motorcycling. | Sturgis Motorcycle Museum, Main Street Sturgis, Buffalo Chip Campground, Nearby Black Hills |
Understanding Airbnb License Requirements & STR Laws in Nemo (2026)
While Nemo, South Dakota, United States currently shows low STR regulations, specific Airbnb license requirements might still exist or change. Always verify the latest short term rental regulations and Airbnb license requirements directly with local government authorities for Nemo to ensure full compliance before hosting.
(Source: AirROI data, 2026, finding no licensed listings among those analyzed)
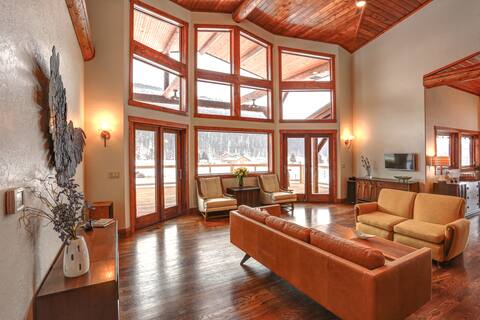
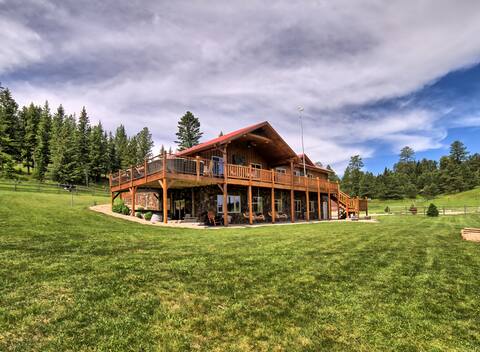
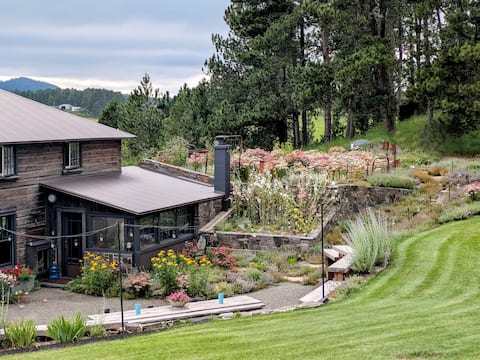
Top Performing Airbnb Properties in Nemo (2026)
Benchmark your potential! Explore examples of top-performing Airbnb properties in Nemobased on Trailing Twelve Month (TTM) revenue. Analyze their characteristics, revenue, occupancy rate, and ADR to understand what drives success in this market.
The Nemo Lodge Black Hills Escape for Large Groups
Entire Place • 6 bedrooms
Buffalo Springs 6 Bed, 5 Bath, Family, Black Hills
Entire Place • 6 bedrooms

Crooked Creek Lodge
Entire Place • 3 bedrooms

Osprey Retreat: Summer Pool, Year-Round Calm
Entire Place • 3 bedrooms
Black~Hills Deluxe~Cabin Hike~Bike UTV~Hunt RELAX!
Entire Place • 3 bedrooms

Restored Nemo Farmhouse on Centennial Trail W WiFi
Entire Place • 4 bedrooms
Note: Performance varies based on location, size, amenities, seasonality, and management quality. Data reflects the past 12 months.
Top Performing Airbnb Hosts in Nemo (2026)
Learn from the best! This table showcases top-performing Airbnb hosts in Nemo based on the number of properties managed and estimated total revenue over the past year. Analyze their scale and performance metrics.
| Host Name | Properties | Grossing Revenue | Stay Reviews | Avg Rating |
|---|---|---|---|---|
| Traci | 3 | $206,048 | 76 | 4.97/5.0 |
| BlackHillsPremier | 1 | $116,413 | 54 | 5.00/5.0 |
| Heidi | 1 | $94,045 | 26 | 4.96/5.0 |
| Margaret | 2 | $62,079 | 63 | 4.97/5.0 |
| Lesley | 1 | $60,786 | 52 | 4.98/5.0 |
| Julie | 1 | $52,323 | 102 | 4.99/5.0 |
| Mike | 2 | $50,723 | 130 | 4.88/5.0 |
| Jeff | 1 | $46,602 | 139 | 4.92/5.0 |
| Stay In The Black Hills | 1 | $46,381 | 69 | 4.62/5.0 |
| Nancy | 1 | $42,468 | 3 | 5.00/5.0 |
Analyzing the strategies of top hosts, such as their property selection, pricing, and guest communication, can offer valuable lessons for optimizing your own Airbnb operations in Nemo.
Dive Deeper: Advanced Nemo STR Market Data (2026)
Ready to unlock more insights? AirROI provides access to advanced metrics and comprehensive Airbnb data for Nemo. Explore detailed analytics beyond this report to refine your investment strategy, optimize pricing, and maximize your vacation rental profits.
Explore Advanced MetricsNemo Short-Term Rental Market Composition (2026): Property & Room Types
Room Type Distribution
Property Type Distribution
Market Composition Insights for Nemo
- The Nemo Airbnb market composition is heavily skewed towards Entire Home/Apt listings, which make up 100% of the 24 active rentals. This indicates strong guest preference for privacy and space.
- Looking at the property type distribution in Nemo, House properties are the most common (45.8%), reflecting the local real estate landscape.
- Houses represent a significant 45.8% portion, catering likely to families or larger groups.
- Smaller segments like apartment/condo (combined 4.2%) offer potential for unique stay experiences.
Nemo Airbnb Room Capacity Analysis (2026): Bedroom Distribution
Distribution of Listings by Number of Bedrooms
Room Capacity Insights for Nemo
- The dominant room capacity in Nemo is 2 bedrooms listings, making up 33.3% of the market. This suggests a strong demand for properties suitable for couples or solo travelers.
- Together, 2 bedrooms and 3 bedrooms properties represent 58.3% of the active Airbnb listings in Nemo, indicating a high concentration in these sizes.
- A significant 45.8% of listings offer 3+ bedrooms, catering to larger groups and families seeking more space in Nemo.
Nemo Vacation Rental Guest Capacity Trends (2026)
Distribution of Listings by Guest Capacity
Guest Capacity Insights for Nemo
- The most common guest capacity trend in Nemo vacation rentals is listings accommodating 8+ guests (50%). This suggests the primary traveler segment is likely larger groups.
- Properties designed for 8+ guests and 6 guests dominate the Nemo STR market, accounting for 75.0% of listings.
- 75.0% of properties accommodate 6+ guests, serving the market segment for larger families or group travel in Nemo.
- On average, properties in Nemo are equipped to host 6.4 guests.
Nemo Airbnb Booking Patterns (2026): Available vs. Booked Days
Available Days Distribution
Booked Days Distribution
Booking Pattern Insights for Nemo
- The most common availability pattern in Nemo falls within the 181-270 days range, representing 58.3% of listings. This suggests many properties have significant open periods on their calendars.
- Approximately 95.8% of listings show high availability (181+ days open annually), indicating potential for increased bookings or specific owner usage patterns.
- For booked days, the 91-180 days range is most frequent in Nemo (62.5%), reflecting common guest stay durations or potential owner blocking patterns.
- A notable 4.2% of properties secure long booking periods (181+ days booked per year), highlighting successful long-term rental strategies or significant owner usage.
Nemo Airbnb Minimum Stay Requirements Analysis
Distribution of Listings by Minimum Night Requirement
1 Night
1 listings
4.2% of total
2 Nights
6 listings
25% of total
3 Nights
5 listings
20.8% of total
4-6 Nights
2 listings
8.3% of total
30+ Nights
10 listings
41.7% of total
Key Insights
- The most prevalent minimum stay requirement in Nemo is 30+ Nights, adopted by 41.7% of listings. This highlights the market's preference for longer commitments.
- A significant segment (41.7%) caters to monthly stays (30+ nights) in Nemo, pointing to opportunities in the extended-stay market.
Recommendations
- Align with the market by considering a 30+ Nights minimum stay, as 41.7% of Nemo hosts use this setting.
- If feasible, allowing 1-night stays, especially midweek or during low season, could capture last-minute bookings, as only 4.2% currently do.
- Explore offering discounts for stays of 30+ nights to attract the 41.7% of the market seeking extended stays.
- Adjust minimum nights based on seasonality – potentially shorter during low season and longer during peak demand periods in Nemo.
Nemo Airbnb Cancellation Policy Trends Analysis (2026)
Super Strict 60 Days
3 listings
12.5% of total
Super Strict 30 Days
1 listings
4.2% of total
Flexible
1 listings
4.2% of total
Moderate
2 listings
8.3% of total
Firm
10 listings
41.7% of total
Strict
7 listings
29.2% of total
Cancellation Policy Insights for Nemo
- The prevailing Airbnb cancellation policy trend in Nemo is Firm, used by 41.7% of listings.
- A majority (70.9%) of hosts in Nemo utilize Firm or Strict policies, indicating a market where hosts prioritize booking security.
Recommendations for Hosts
- Consider adopting a Firm policy to align with the 41.7% market standard in Nemo.
- Regularly review your cancellation policy against competitors and market demand shifts in Nemo.
Nemo STR Booking Lead Time Analysis (2026)
Average Booking Lead Time by Month
Booking Lead Time Insights for Nemo
- The overall average booking lead time for vacation rentals in Nemo is 91 days.
- Guests book furthest in advance for stays during August (average 139 days), likely coinciding with peak travel demand or local events.
- The shortest booking windows occur for stays in February (average 20 days), indicating more last-minute travel plans during this time.
- Seasonally, Summer (119 days avg.) sees the longest lead times, while Winter (48 days avg.) has the shortest, reflecting typical travel planning cycles.
Recommendations for Hosts
- Use the overall average lead time (91 days) as a baseline for your pricing and availability strategy in Nemo.
- For August stays, consider implementing length-of-stay discounts or slightly higher rates for bookings made less than 139 days out to capitalize on advance planning.
- Target marketing efforts for the Summer season well in advance (at least 119 days) to capture early planners.
- Monitor your own booking lead times against these Nemo averages to identify opportunities for dynamic pricing adjustments.
Popular & Essential Airbnb Amenities in Nemo (2026)
Amenity Prevalence
Amenity Insights for Nemo
- Essential amenities in Nemo that guests expect include: Smoke alarm, Hot water, Coffee maker, Dishes and silverware, Kitchen, TV, Free parking on premises, Refrigerator, Heating, Hangers. Lacking these (any) could significantly impact bookings.
Recommendations for Hosts
- Ensure your listing includes all essential amenities for Nemo: Smoke alarm, Hot water, Coffee maker, Dishes and silverware, Kitchen, TV, Free parking on premises, Refrigerator, Heating, Hangers.
- Prioritize adding missing essentials: Hangers.
- Highlight unique or less common amenities you offer (e.g., hot tub, dedicated workspace, EV charger) in your listing description and photos.
- Regularly check competitor amenities in Nemo to stay competitive.
Nemo Airbnb Guest Demographics & Profile Analysis (2026)
Guest Profile Summary for Nemo
- The typical guest profile for Airbnb in Nemo consists of primarily domestic travelers (99%), often arriving from nearby Sioux Falls, typically belonging to the Post-2000s (Gen Z/Alpha) group (50%), primarily speaking English or Korean.
- Domestic travelers account for 98.5% of guests.
- Key international markets include United States (98.5%) and DC (1.5%).
- Top languages spoken are English (87%) followed by Korean (4.3%).
- A significant demographic segment is the Post-2000s (Gen Z/Alpha) group, representing 50% of guests.
Recommendations for Hosts
- Target domestic marketing efforts towards travelers from Sioux Falls and Denver.
- Tailor amenities and listing descriptions to appeal to the dominant Post-2000s (Gen Z/Alpha) demographic (e.g., highlight fast WiFi, smart home features, local guides).
- Highlight unique local experiences or amenities relevant to the primary guest profile.
- Consider seasonal promotions aligned with peak travel times for key origin markets.
Nearby Short-Term Rental Market Comparison
How does the Nemo Airbnb market stack up against its neighbors? Compare key performance metrics like average monthly revenue, ADR, and occupancy rates in surrounding areas to understand the broader regional STR landscape.
| Market | Active Properties | Monthly Revenue | Daily Rate | Avg. Occupancy |
|---|---|---|---|---|
| Powder House Pass | 117 | $6,352 | $571.95 | 38% |
| Black Hawk | 22 | $3,461 | $320.40 | 46% |
| Lead | 485 | $3,078 | $355.55 | 36% |
| Whitewood | 21 | $2,994 | $348.94 | 41% |
| Deadwood | 139 | $2,916 | $348.42 | 37% |
| Custer | 289 | $2,871 | $267.80 | 47% |
| Keystone | 102 | $2,752 | $268.38 | 48% |
| Rapid City | 678 | $2,626 | $243.25 | 49% |
| Summerset | 16 | $2,605 | $364.02 | 43% |
| Spearfish | 174 | $2,517 | $294.05 | 42% |