Deadwood Airbnb Market Analysis 2026: Short Term Rental Data & Vacation Rental Statistics in South Dakota, United States
Is Airbnb profitable in Deadwood in 2026? Explore comprehensive Airbnb analytics for Deadwood, South Dakota, United States to uncover income potential. This 2026 STR market report for Deadwood, based on AirROI data from February 2025 to January 2026, reveals key trends in the niche market of 139 active listings.
Whether you're considering an Airbnb investment in Deadwood, optimizing your existing vacation rental, or exploring rental arbitrage opportunities, understanding the Deadwood Airbnb data is crucial. Leveraging the low regulation environment is key to maximizing your short term rental income potential. Let's dive into the specifics.
Key Deadwood Airbnb Performance Metrics Overview
Monthly Airbnb Revenue Variations & Income Potential in Deadwood (2026)
Understanding the monthly revenue variations for Airbnb listings in Deadwood is key to maximizing your short term rental income potential. Seasonality significantly impacts earnings. Our analysis, based on data from the past 12 months, shows that the peak revenue month for STRs in Deadwood is typically July, while April often presents the lowest earnings, highlighting opportunities for strategic pricing adjustments during shoulder and low seasons. Explore the typical Airbnb income in Deadwood across different performance tiers:
- Best-in-class properties (Top 10%) achieve $7,546+ monthly, often utilizing dynamic pricing and superior guest experiences.
- Strong performing properties (Top 25%) earn $4,680 or more, indicating effective management and desirable locations/amenities.
- Typical properties (Median) generate around $2,513 per month, representing the average market performance.
- Entry-level properties (Bottom 25%) see earnings around $1,378, often with potential for optimization.
Average Monthly Airbnb Earnings Trend in Deadwood
Deadwood Airbnb Occupancy Rate Trends (2026)
Maximize your bookings by understanding the Deadwood STR occupancy trends. Seasonal demand shifts significantly influence how often properties are booked. Typically, Julysees the highest demand (peak season occupancy), while January experiences the lowest (low season). Effective strategies, like adjusting minimum stays or offering promotions, can boost occupancy during slower periods. Here's how different property tiers perform in Deadwood:
- Best-in-class properties (Top 10%) achieve 64%+ occupancy, indicating high desirability and potentially optimized availability.
- Strong performing properties (Top 25%) maintain 49% or higher occupancy, suggesting good market fit and guest satisfaction.
- Typical properties (Median) have an occupancy rate around 33%.
- Entry-level properties (Bottom 25%) average 18% occupancy, potentially facing higher vacancy.
Average Monthly Occupancy Rate Trend in Deadwood
Average Daily Rate (ADR) Airbnb Trends in Deadwood (2026)
Effective short term rental pricing strategy in Deadwood involves understanding monthly ADR fluctuations. The Average Daily Rate (ADR) for Airbnb in Deadwood typically peaks in August and dips lowest during November. Leveraging Airbnb dynamic pricing tools or strategies based on this seasonality can significantly boost revenue. Here's a look at the typical nightly rates achieved:
- Best-in-class properties (Top 10%) command rates of $634+ per night, often due to premium features or locations.
- Strong performing properties (Top 25%) achieve nightly rates of $416 or more.
- Typical properties (Median) charge around $249 per night.
- Entry-level properties (Bottom 25%) earn around $162 per night.
Average Daily Rate (ADR) Trend by Month in Deadwood
Get Live Deadwood Market Intelligence 👇

Explore Real-time Analytics
Airbnb Seasonality Analysis & Trends in Deadwood (2026)
Peak Season (July, August, June)
- Revenue averages $6,271 per month
- Occupancy rates average 53.7%
- Daily rates average $411
Shoulder Season
- Revenue averages $2,978 per month
- Occupancy maintains around 30.9%
- Daily rates hold near $345
Low Season (February, April, November)
- Revenue drops to average $2,214 per month
- Occupancy decreases to average 25.8%
- Daily rates adjust to average $334
Seasonality Insights for Deadwood
- The Airbnb seasonality in Deadwood shows highly seasonal trends requiring careful strategy. While the sections above show seasonal averages, it's also insightful to look at the extremes:
- During the high season, the absolute peak month showcases Deadwood's highest earning potential, with monthly revenues capable of climbing to $6,777, occupancy reaching a high of 56.2%, and ADRs peaking at $425.
- Conversely, the slowest single month of the year, typically falling within the low season, marks the market's lowest point. In this month, revenue might dip to $2,153, occupancy could drop to 20.7%, and ADRs may adjust down to $322.
- Understanding both the seasonal averages and these monthly peaks and troughs in revenue, occupancy, and ADR is crucial for maximizing your Airbnb profit potential in Deadwood.
Seasonal Strategies for Maximizing Profit
- Peak Season: Maximize revenue through premium pricing and potentially longer minimum stays. Ensure high availability.
- Low Season: Offer competitive pricing, special promotions (e.g., extended stay discounts), and flexible cancellation policies. Target off-season travelers like remote workers or budget-conscious guests.
- Shoulder Seasons: Implement dynamic pricing that balances peak and low rates. Target weekend travelers or specific events. Offer slightly more flexible terms than peak season.
- Regularly analyze your own performance against these Deadwood seasonality benchmarks and adjust your pricing and availability strategy accordingly.
Best Areas for Airbnb Investment in Deadwood (2026)
Exploring the top neighborhoods for short-term rentals in Deadwood? This section highlights key areas, outlining why they are attractive for hosts and guests, along with notable local attractions. Consider these locations based on your target guest profile and investment strategy.
| Neighborhood / Area | Why Host Here? (Target Guests & Appeal) | Key Attractions & Landmarks |
|---|---|---|
| Historic Main Street | The heart of Deadwood, known for its rich history, old-time charm, and vibrant nightlife. Visitors enjoy its unique shops, historic sites, and lively atmosphere, making it a top destination for tourists. | Adams Museum, Deadwood Mountain Grand, Historic Saloon No. 10, Deadwood Gaming District, The Pink Garter Theatre |
| Lead | Just a short drive from Deadwood, Lead offers outdoor activities and access to the Black Hills National Forest. It's popular with tourists looking for a quieter experience, while still being close to Deadwood. | Lead Historical Museum, Gold Mine Tours, Recreational hiking trails, Black Hills Central Railroad |
| Deadwood Gulch | A scenic area known for its breathtaking views and proximity to both nature and historical sites. Ideal for those who appreciate a mix of adventure and history. | Deadwood Gulch Gaming Resort, Nature trails, Scenic viewpoints |
| Mickelson Trail | A renowned recreational trail that attracts outdoor enthusiasts. Investing in an Airbnb here allows access to hiking, biking, and winter sports. | Mickelson Trailhead, Biking and hiking opportunities, Nature experiences |
| Buffalo Ridge Trading Post | A unique shopping area that offers a taste of western culture. It's popular with tourists looking for souvenirs and local crafts. | Buffalo Ridge Trading Post, Western-themed shops, Local craft goods |
| Spring Creek | A picturesque area perfect for those who want to immerse in nature, offering beautiful scenery and secluded experiences. | Spring Creek nature trails, Fishing and outdoor activities, Scenic beauty |
| Whistler Gulch | A serene location for guests looking to escape the hustle and bustle of downtown while still being close to Deadwood's attractions. | Whistler Gulch Park, Hiking opportunities, Scenic views |
| Black Hills National Forest | A massive national forest surrounding Deadwood, ideal for those wanting to explore the outdoors, with year-round activities for every season. | Hiking and biking trails, Camping areas, Wildlife viewing spots, Scenic drives |
| Deadwood Lodge | The lodge area offers unique accommodations in a beautiful natural setting, catering to guests who appreciate rustic charm combined with modern amenities. | Deadwood Lodge amenities, Nature trails, Access to Deadwood activities |
Understanding Airbnb License Requirements & STR Laws in Deadwood (2026)
While Deadwood, South Dakota, United States currently shows low STR regulations, specific Airbnb license requirements might still exist or change. Always verify the latest short term rental regulations and Airbnb license requirements directly with local government authorities for Deadwood to ensure full compliance before hosting.
(Source: AirROI data, 2026, finding no licensed listings among those analyzed)
Top Performing Airbnb Properties in Deadwood (2026)
Benchmark your potential! Explore examples of top-performing Airbnb properties in Deadwoodbased on Trailing Twelve Month (TTM) revenue. Analyze their characteristics, revenue, occupancy rate, and ADR to understand what drives success in this market.
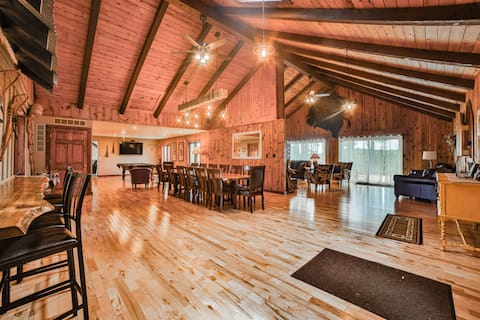
Deadwood SD 11k sq ft 9 Bd Suites 11 Ba Sleeps 35+
Entire Place • 9 bedrooms
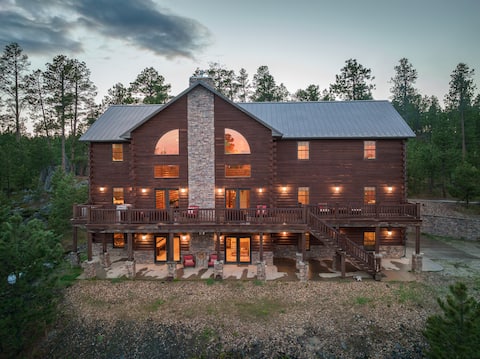
Largest Black Hills Lodge - Sleeps 30 - 13 Bedroom
Entire Place • 13 bedrooms

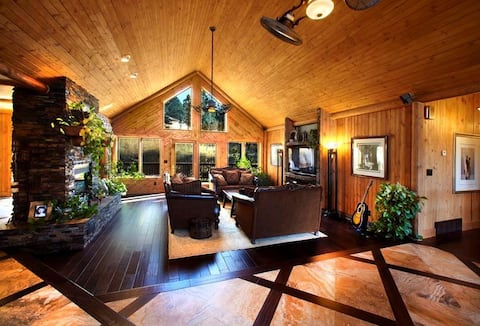
Deadwood Nightlife and Black Hills Adventures
Entire Place • 4 bedrooms
Gold Dust Manor-beauty, serenity, privacy for all
Entire Place • 4 bedrooms

Quaking Aspen Heights
Entire Place • 5 bedrooms

Buffalo Thunder Lodge
Entire Place • 7 bedrooms
Note: Performance varies based on location, size, amenities, seasonality, and management quality. Data reflects the past 12 months.
Top Performing Airbnb Hosts in Deadwood (2026)
Learn from the best! This table showcases top-performing Airbnb hosts in Deadwood based on the number of properties managed and estimated total revenue over the past year. Analyze their scale and performance metrics.
| Host Name | Properties | Grossing Revenue | Stay Reviews | Avg Rating |
|---|---|---|---|---|
| Evolve | 12 | $346,249 | 303 | 4.74/5.0 |
| Deadwood Connections | 5 | $283,705 | 325 | 4.88/5.0 |
| Carmen | 4 | $250,065 | 66 | 4.97/5.0 |
| TrailHound | 2 | $217,333 | 46 | 4.97/5.0 |
| John | 1 | $204,297 | 50 | 4.92/5.0 |
| Wayne | 5 | $196,428 | 209 | 4.84/5.0 |
| BlackHillsPremier | 3 | $194,594 | 98 | 4.94/5.0 |
| Alecia | 2 | $173,200 | 108 | 4.91/5.0 |
| Trinity | 5 | $152,105 | 739 | 4.80/5.0 |
| Vacation Home Renter | 2 | $151,710 | 46 | 4.91/5.0 |
Analyzing the strategies of top hosts, such as their property selection, pricing, and guest communication, can offer valuable lessons for optimizing your own Airbnb operations in Deadwood.
Dive Deeper: Advanced Deadwood STR Market Data (2026)
Ready to unlock more insights? AirROI provides access to advanced metrics and comprehensive Airbnb data for Deadwood. Explore detailed analytics beyond this report to refine your investment strategy, optimize pricing, and maximize your vacation rental profits.
Explore Advanced MetricsDeadwood Short-Term Rental Market Composition (2026): Property & Room Types
Room Type Distribution
Property Type Distribution
Market Composition Insights for Deadwood
- The Deadwood Airbnb market composition is heavily skewed towards Entire Home/Apt listings, which make up 92.1% of the 139 active rentals. This indicates strong guest preference for privacy and space.
- Looking at the property type distribution in Deadwood, Outdoor/Unique properties are the most common (34.5%), reflecting the local real estate landscape.
- Houses represent a significant 25.9% portion, catering likely to families or larger groups.
- The presence of 8.6% Hotel/Boutique listings indicates integration with traditional hospitality.
- Smaller segments like others (combined 3.6%) offer potential for unique stay experiences.
Deadwood Airbnb Room Capacity Analysis (2026): Bedroom Distribution
Distribution of Listings by Number of Bedrooms
Room Capacity Insights for Deadwood
- The dominant room capacity in Deadwood is 2 bedrooms listings, making up 25.2% of the market. This suggests a strong demand for properties suitable for couples or solo travelers.
- Together, 2 bedrooms and 1 bedroom properties represent 50.4% of the active Airbnb listings in Deadwood, indicating a high concentration in these sizes.
- A significant 41.8% of listings offer 3+ bedrooms, catering to larger groups and families seeking more space in Deadwood.
Deadwood Vacation Rental Guest Capacity Trends (2026)
Distribution of Listings by Guest Capacity
Guest Capacity Insights for Deadwood
- The most common guest capacity trend in Deadwood vacation rentals is listings accommodating 8+ guests (33.8%). This suggests the primary traveler segment is likely larger groups.
- Properties designed for 8+ guests and 6 guests dominate the Deadwood STR market, accounting for 55.4% of listings.
- 58.3% of properties accommodate 6+ guests, serving the market segment for larger families or group travel in Deadwood.
- On average, properties in Deadwood are equipped to host 5.5 guests.
Deadwood Airbnb Booking Patterns (2026): Available vs. Booked Days
Available Days Distribution
Booked Days Distribution
Booking Pattern Insights for Deadwood
- The most common availability pattern in Deadwood falls within the 271-366 days range, representing 47.5% of listings. This suggests many properties have significant open periods on their calendars.
- Approximately 89.2% of listings show high availability (181+ days open annually), indicating potential for increased bookings or specific owner usage patterns.
- For booked days, the 91-180 days range is most frequent in Deadwood (41%), reflecting common guest stay durations or potential owner blocking patterns.
- A notable 12.9% of properties secure long booking periods (181+ days booked per year), highlighting successful long-term rental strategies or significant owner usage.
Deadwood Airbnb Minimum Stay Requirements Analysis
Distribution of Listings by Minimum Night Requirement
1 Night
34 listings
24.5% of total
2 Nights
54 listings
38.8% of total
3 Nights
6 listings
4.3% of total
4-6 Nights
2 listings
1.4% of total
7-29 Nights
1 listings
0.7% of total
30+ Nights
42 listings
30.2% of total
Key Insights
- The most prevalent minimum stay requirement in Deadwood is 2 Nights, adopted by 38.8% of listings. This highlights the market's preference for shorter, flexible bookings.
- A strong majority (63.3%) of the Deadwood Airbnb data shows acceptance of very short stays (1-2 nights), indicating a dynamic, high-turnover market.
- A significant segment (30.2%) caters to monthly stays (30+ nights) in Deadwood, pointing to opportunities in the extended-stay market.
Recommendations
- Align with the market by considering a 2 Nights minimum stay, as 38.8% of Deadwood hosts use this setting.
- If feasible, allowing 1-night stays, especially midweek or during low season, could capture last-minute bookings, as only 24.5% currently do.
- Explore offering discounts for stays of 30+ nights to attract the 30.2% of the market seeking extended stays.
- Adjust minimum nights based on seasonality – potentially shorter during low season and longer during peak demand periods in Deadwood.
Deadwood Airbnb Cancellation Policy Trends Analysis (2026)
Super Strict 60 Days
12 listings
8.6% of total
Super Strict 30 Days
10 listings
7.2% of total
Limited
5 listings
3.6% of total
Flexible
5 listings
3.6% of total
Moderate
10 listings
7.2% of total
Firm
57 listings
41% of total
Strict
40 listings
28.8% of total
Cancellation Policy Insights for Deadwood
- The prevailing Airbnb cancellation policy trend in Deadwood is Firm, used by 41% of listings.
- A majority (69.8%) of hosts in Deadwood utilize Firm or Strict policies, indicating a market where hosts prioritize booking security.
Recommendations for Hosts
- Consider adopting a Firm policy to align with the 41% market standard in Deadwood.
- Regularly review your cancellation policy against competitors and market demand shifts in Deadwood.
Deadwood STR Booking Lead Time Analysis (2026)
Average Booking Lead Time by Month
Booking Lead Time Insights for Deadwood
- The overall average booking lead time for vacation rentals in Deadwood is 79 days.
- Guests book furthest in advance for stays during August (average 131 days), likely coinciding with peak travel demand or local events.
- The shortest booking windows occur for stays in February (average 34 days), indicating more last-minute travel plans during this time.
- Seasonally, Summer (111 days avg.) sees the longest lead times, while Winter (50 days avg.) has the shortest, reflecting typical travel planning cycles.
Recommendations for Hosts
- Use the overall average lead time (79 days) as a baseline for your pricing and availability strategy in Deadwood.
- For August stays, consider implementing length-of-stay discounts or slightly higher rates for bookings made less than 131 days out to capitalize on advance planning.
- Target marketing efforts for the Summer season well in advance (at least 111 days) to capture early planners.
- Monitor your own booking lead times against these Deadwood averages to identify opportunities for dynamic pricing adjustments.
Popular & Essential Airbnb Amenities in Deadwood (2026)
Amenity Prevalence
Amenity Insights for Deadwood
- Essential amenities in Deadwood that guests expect include: Smoke alarm, TV, Heating. Lacking these (any) could significantly impact bookings.
- Popular amenities like Free parking on premises, Wifi, Fire extinguisher are common but not universal. Offering these can provide a competitive edge.
- Warning: Wifi is not universally provided but is considered essential globally. Ensure reliable Wifi is offered.
Recommendations for Hosts
- Ensure your listing includes all essential amenities for Deadwood: Smoke alarm, TV, Heating.
- Prioritize adding missing essentials: Smoke alarm, TV, Heating.
- Consider adding popular differentiators like Free parking on premises or Wifi to increase appeal.
- Highlight unique or less common amenities you offer (e.g., hot tub, dedicated workspace, EV charger) in your listing description and photos.
- Regularly check competitor amenities in Deadwood to stay competitive.
Deadwood Airbnb Guest Demographics & Profile Analysis (2026)
Guest Profile Summary for Deadwood
- The typical guest profile for Airbnb in Deadwood consists of primarily domestic travelers (97%), often arriving from nearby Sioux Falls, typically belonging to the Post-2000s (Gen Z/Alpha) group (50%), primarily speaking English or Spanish.
- Domestic travelers account for 97.4% of guests.
- Key international markets include United States (97.4%) and United Kingdom (0.9%).
- Top languages spoken are English (87.8%) followed by Spanish (6.6%).
- A significant demographic segment is the Post-2000s (Gen Z/Alpha) group, representing 50% of guests.
Recommendations for Hosts
- Target domestic marketing efforts towards travelers from Sioux Falls and Bismarck.
- Tailor amenities and listing descriptions to appeal to the dominant Post-2000s (Gen Z/Alpha) demographic (e.g., highlight fast WiFi, smart home features, local guides).
- Highlight unique local experiences or amenities relevant to the primary guest profile.
- Consider seasonal promotions aligned with peak travel times for key origin markets.
Nearby Short-Term Rental Market Comparison
How does the Deadwood Airbnb market stack up against its neighbors? Compare key performance metrics like average monthly revenue, ADR, and occupancy rates in surrounding areas to understand the broader regional STR landscape.
| Market | Active Properties | Monthly Revenue | Daily Rate | Avg. Occupancy |
|---|---|---|---|---|
| Powder House Pass | 117 | $6,352 | $571.95 | 38% |
| Black Hawk | 22 | $3,461 | $320.40 | 46% |
| Nemo | 24 | $3,292 | $379.56 | 46% |
| Lead | 485 | $3,078 | $355.55 | 36% |
| Whitewood | 21 | $2,994 | $348.94 | 41% |
| Custer | 289 | $2,871 | $267.80 | 47% |
| Keystone | 102 | $2,752 | $268.38 | 48% |
| Rapid City | 678 | $2,626 | $243.25 | 49% |
| Summerset | 16 | $2,605 | $364.02 | 43% |
| Spearfish | 174 | $2,517 | $294.05 | 42% |