Custer Airbnb Market Analysis 2026: Short Term Rental Data & Vacation Rental Statistics in South Dakota, United States
Is Airbnb profitable in Custer in 2026? Explore comprehensive Airbnb analytics for Custer, South Dakota, United States to uncover income potential. This 2026 STR market report for Custer, based on AirROI data from February 2025 to January 2026, reveals key trends in the market of 289 active listings.
Whether you're considering an Airbnb investment in Custer, optimizing your existing vacation rental, or exploring rental arbitrage opportunities, understanding the Custer Airbnb data is crucial. Leveraging the low regulation environment is key to maximizing your short term rental income potential. Let's dive into the specifics.
Key Custer Airbnb Performance Metrics Overview
Monthly Airbnb Revenue Variations & Income Potential in Custer (2026)
Understanding the monthly revenue variations for Airbnb listings in Custer is key to maximizing your short term rental income potential. Seasonality significantly impacts earnings. Our analysis, based on data from the past 12 months, shows that the peak revenue month for STRs in Custer is typically July, while January often presents the lowest earnings, highlighting opportunities for strategic pricing adjustments during shoulder and low seasons. Explore the typical Airbnb income in Custer across different performance tiers:
- Best-in-class properties (Top 10%) achieve $8,048+ monthly, often utilizing dynamic pricing and superior guest experiences.
- Strong performing properties (Top 25%) earn $5,405 or more, indicating effective management and desirable locations/amenities.
- Typical properties (Median) generate around $3,227 per month, representing the average market performance.
- Entry-level properties (Bottom 25%) see earnings around $1,678, often with potential for optimization.
Average Monthly Airbnb Earnings Trend in Custer
Custer Airbnb Occupancy Rate Trends (2026)
Maximize your bookings by understanding the Custer STR occupancy trends. Seasonal demand shifts significantly influence how often properties are booked. Typically, Julysees the highest demand (peak season occupancy), while January experiences the lowest (low season). Effective strategies, like adjusting minimum stays or offering promotions, can boost occupancy during slower periods. Here's how different property tiers perform in Custer:
- Best-in-class properties (Top 10%) achieve 75%+ occupancy, indicating high desirability and potentially optimized availability.
- Strong performing properties (Top 25%) maintain 64% or higher occupancy, suggesting good market fit and guest satisfaction.
- Typical properties (Median) have an occupancy rate around 46%.
- Entry-level properties (Bottom 25%) average 26% occupancy, potentially facing higher vacancy.
Average Monthly Occupancy Rate Trend in Custer
Average Daily Rate (ADR) Airbnb Trends in Custer (2026)
Effective short term rental pricing strategy in Custer involves understanding monthly ADR fluctuations. The Average Daily Rate (ADR) for Airbnb in Custer typically peaks in July and dips lowest during February. Leveraging Airbnb dynamic pricing tools or strategies based on this seasonality can significantly boost revenue. Here's a look at the typical nightly rates achieved:
- Best-in-class properties (Top 10%) command rates of $496+ per night, often due to premium features or locations.
- Strong performing properties (Top 25%) achieve nightly rates of $334 or more.
- Typical properties (Median) charge around $226 per night.
- Entry-level properties (Bottom 25%) earn around $149 per night.
Average Daily Rate (ADR) Trend by Month in Custer
Get Live Custer Market Intelligence 👇

Explore Real-time Analytics
Airbnb Seasonality Analysis & Trends in Custer (2026)
Peak Season (July, June, August)
- Revenue averages $6,526 per month
- Occupancy rates average 63.5%
- Daily rates average $300
Shoulder Season
- Revenue averages $3,653 per month
- Occupancy maintains around 43.2%
- Daily rates hold near $261
Low Season (January, February, November)
- Revenue drops to average $2,228 per month
- Occupancy decreases to average 28.4%
- Daily rates adjust to average $249
Seasonality Insights for Custer
- The Airbnb seasonality in Custer shows highly seasonal trends requiring careful strategy. While the sections above show seasonal averages, it's also insightful to look at the extremes:
- During the high season, the absolute peak month showcases Custer's highest earning potential, with monthly revenues capable of climbing to $6,926, occupancy reaching a high of 66.2%, and ADRs peaking at $301.
- Conversely, the slowest single month of the year, typically falling within the low season, marks the market's lowest point. In this month, revenue might dip to $1,807, occupancy could drop to 19.6%, and ADRs may adjust down to $237.
- Understanding both the seasonal averages and these monthly peaks and troughs in revenue, occupancy, and ADR is crucial for maximizing your Airbnb profit potential in Custer.
Seasonal Strategies for Maximizing Profit
- Peak Season: Maximize revenue through premium pricing and potentially longer minimum stays. Ensure high availability.
- Low Season: Offer competitive pricing, special promotions (e.g., extended stay discounts), and flexible cancellation policies. Target off-season travelers like remote workers or budget-conscious guests.
- Shoulder Seasons: Implement dynamic pricing that balances peak and low rates. Target weekend travelers or specific events. Offer slightly more flexible terms than peak season.
- Regularly analyze your own performance against these Custer seasonality benchmarks and adjust your pricing and availability strategy accordingly.
Best Areas for Airbnb Investment in Custer (2026)
Exploring the top neighborhoods for short-term rentals in Custer? This section highlights key areas, outlining why they are attractive for hosts and guests, along with notable local attractions. Consider these locations based on your target guest profile and investment strategy.
| Neighborhood / Area | Why Host Here? (Target Guests & Appeal) | Key Attractions & Landmarks |
|---|---|---|
| Custer State Park | A major tourist destination known for its stunning natural beauty, wildlife viewing, and outdoor activities. Ideal for nature lovers and families looking for adventure in the Black Hills. | Wildlife Loop Road, Needles Highway, Sylvan Lake, Custer State Park Visitor Center, Buffalo Roundup, Hiking and camping spots |
| Downtown Custer | The historic heart of Custer, offering charming shops, restaurants, and local art galleries. Great for visitors looking to explore local culture and shop for souvenirs. | Bruce's Bar, Custer County Courthouse, Custer County Historical Society, local shops and cafes, Custer Wolf, Custer’s Annual Buffalo Roundup Festival |
| Crazy Horse Memorial | A monumental sculpture and cultural center dedicated to Native American history. Attracts visitors interested in history and culture, great for educational tourism. | Crazy Horse Monument, Indian Museum of North America, scenic viewpoints, cultural events, Native American art and craft shops |
| Mount Rushmore National Memorial | One of the most iconic landmarks in the United States, attracting millions of visitors each year. A must-see for tourists in the region, perfect for maximizing bookings during peak seasons. | Mount Rushmore, Presidential Trail, Visitor Center, Evening Lighting Ceremony, Surrounding Black Hills |
| Wind Cave National Park | Known for its unique cave system and diverse wildlife, appealing to nature enthusiasts and families. Offers educational tours and exploration opportunities. | Wind Cave Tours, Hiking Trails, Wildlife watching, Visitor Center, Cave formations |
| Custer County | The surrounding areas of Custer provide diverse accommodation options for those looking to explore the Black Hills region, with access to various outdoor activities. | Black Hills National Forest, Outdoor recreational activities, Scenic drives, Local campgrounds, Quiet rural retreats |
| Historic Gold Discovery Site | Located nearby, this site draws history buffs interested in the Gold Rush era and mining history. Good for niche market Airbnb offerings. | Historic gold mine tours, Mining history exhibitions, Scenic landscapes, Visitor centers, Local legends |
| Wild West Junction | A themed entertainment venue that includes shops, restaurants, and shows, attracting families and tourists looking for fun and experiential activities. | Live entertainment, Western-themed shops, Family-friendly activities, Food stalls, Cultural events |
Understanding Airbnb License Requirements & STR Laws in Custer (2026)
While Custer, South Dakota, United States currently shows low STR regulations, specific Airbnb license requirements might still exist or change. Always verify the latest short term rental regulations and Airbnb license requirements directly with local government authorities for Custer to ensure full compliance before hosting.
(Source: AirROI data, 2026, finding no licensed listings among those analyzed)
Top Performing Airbnb Properties in Custer (2026)
Benchmark your potential! Explore examples of top-performing Airbnb properties in Custerbased on Trailing Twelve Month (TTM) revenue. Analyze their characteristics, revenue, occupancy rate, and ADR to understand what drives success in this market.

Largest Custer Lodge-Sleeps 22
Entire Place • 7 bedrooms
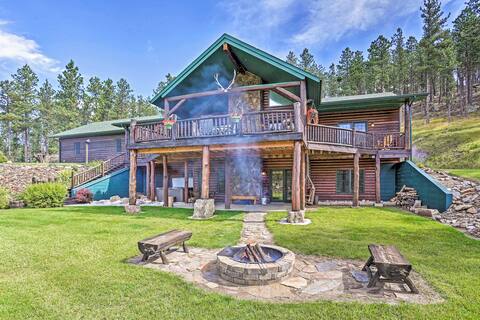
Black Hills Cabin: Hot Tub, Fishing Pond & Deck
Entire Place • 6 bedrooms
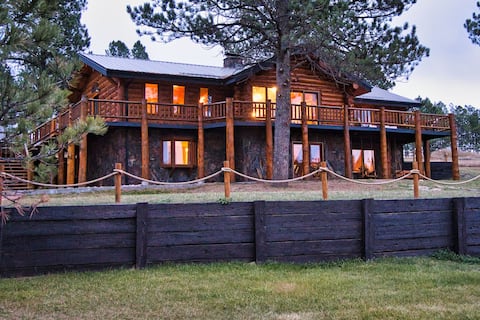
Evergreen Lodge - A true Black Hills Experience
Entire Place • 6 bedrooms
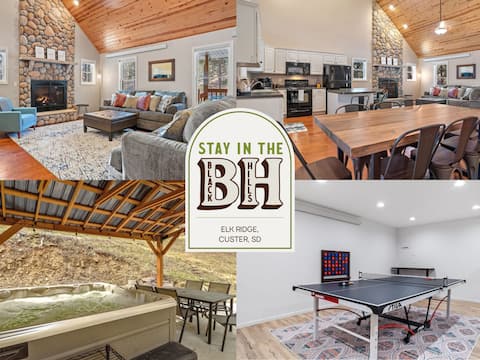
Elk Ridge-Fire Place-Custer
Entire Place • 5 bedrooms

Modern Lodge: Hottub + Huge Space + Views + Sauna
Entire Place • 5 bedrooms
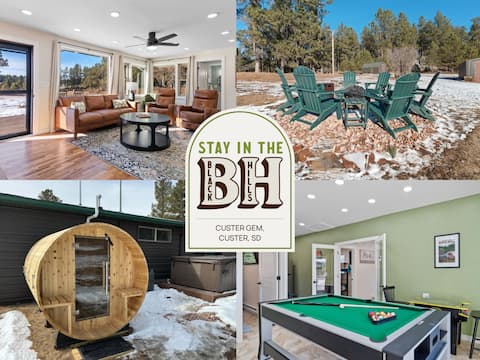
Custer Gem
Entire Place • 6 bedrooms
Note: Performance varies based on location, size, amenities, seasonality, and management quality. Data reflects the past 12 months.
Top Performing Airbnb Hosts in Custer (2026)
Learn from the best! This table showcases top-performing Airbnb hosts in Custer based on the number of properties managed and estimated total revenue over the past year. Analyze their scale and performance metrics.
| Host Name | Properties | Grossing Revenue | Stay Reviews | Avg Rating |
|---|---|---|---|---|
| Stay In The Black Hills | 17 | $1,370,067 | 1107 | 4.89/5.0 |
| Velora Management Group | 16 | $974,364 | 661 | 4.77/5.0 |
| Candace | 20 | $806,464 | 810 | 4.86/5.0 |
| Evolve | 7 | $412,880 | 339 | 4.81/5.0 |
| Thomas | 5 | $309,948 | 639 | 4.99/5.0 |
| Joy | 5 | $277,038 | 126 | 4.94/5.0 |
| Crystal | 7 | $273,241 | 715 | 4.93/5.0 |
| Lee Ann | 7 | $264,650 | 147 | 4.77/5.0 |
| Diane | 3 | $239,435 | 55 | 4.94/5.0 |
| Daniela | 10 | $224,336 | 228 | 4.59/5.0 |
Analyzing the strategies of top hosts, such as their property selection, pricing, and guest communication, can offer valuable lessons for optimizing your own Airbnb operations in Custer.
Dive Deeper: Advanced Custer STR Market Data (2026)
Ready to unlock more insights? AirROI provides access to advanced metrics and comprehensive Airbnb data for Custer. Explore detailed analytics beyond this report to refine your investment strategy, optimize pricing, and maximize your vacation rental profits.
Explore Advanced MetricsCuster Short-Term Rental Market Composition (2026): Property & Room Types
Room Type Distribution
Property Type Distribution
Market Composition Insights for Custer
- The Custer Airbnb market composition is heavily skewed towards Entire Home/Apt listings, which make up 93.1% of the 289 active rentals. This indicates strong guest preference for privacy and space.
- Looking at the property type distribution in Custer, Outdoor/Unique properties are the most common (50.5%), reflecting the local real estate landscape.
- Houses represent a significant 32.9% portion, catering likely to families or larger groups.
- The presence of 6.9% Hotel/Boutique listings indicates integration with traditional hospitality.
- Smaller segments like unique stays, others (combined 4.2%) offer potential for unique stay experiences.
Custer Airbnb Room Capacity Analysis (2026): Bedroom Distribution
Distribution of Listings by Number of Bedrooms
Room Capacity Insights for Custer
- The dominant room capacity in Custer is 1 bedroom listings, making up 30.4% of the market. This suggests a strong demand for properties suitable for couples or solo travelers.
- Together, 1 bedroom and 2 bedrooms properties represent 50.8% of the active Airbnb listings in Custer, indicating a high concentration in these sizes.
- A significant 33.9% of listings offer 3+ bedrooms, catering to larger groups and families seeking more space in Custer.
Custer Vacation Rental Guest Capacity Trends (2026)
Distribution of Listings by Guest Capacity
Guest Capacity Insights for Custer
- The most common guest capacity trend in Custer vacation rentals is listings accommodating 8+ guests (31.8%). This suggests the primary traveler segment is likely larger groups.
- Properties designed for 8+ guests and 4 guests dominate the Custer STR market, accounting for 50.8% of listings.
- 52.2% of properties accommodate 6+ guests, serving the market segment for larger families or group travel in Custer.
- On average, properties in Custer are equipped to host 5.2 guests.
Custer Airbnb Booking Patterns (2026): Available vs. Booked Days
Available Days Distribution
Booked Days Distribution
Booking Pattern Insights for Custer
- The most common availability pattern in Custer falls within the 181-270 days range, representing 44.6% of listings. This suggests many properties have significant open periods on their calendars.
- Approximately 82.0% of listings show high availability (181+ days open annually), indicating potential for increased bookings or specific owner usage patterns.
- For booked days, the 91-180 days range is most frequent in Custer (46.4%), reflecting common guest stay durations or potential owner blocking patterns.
- A notable 19.0% of properties secure long booking periods (181+ days booked per year), highlighting successful long-term rental strategies or significant owner usage.
Custer Airbnb Minimum Stay Requirements Analysis
Distribution of Listings by Minimum Night Requirement
1 Night
71 listings
24.6% of total
2 Nights
79 listings
27.3% of total
3 Nights
17 listings
5.9% of total
4-6 Nights
6 listings
2.1% of total
30+ Nights
116 listings
40.1% of total
Key Insights
- The most prevalent minimum stay requirement in Custer is 30+ Nights, adopted by 40.1% of listings. This highlights the market's preference for longer commitments.
- A significant segment (40.1%) caters to monthly stays (30+ nights) in Custer, pointing to opportunities in the extended-stay market.
Recommendations
- Align with the market by considering a 30+ Nights minimum stay, as 40.1% of Custer hosts use this setting.
- If feasible, allowing 1-night stays, especially midweek or during low season, could capture last-minute bookings, as only 24.6% currently do.
- Explore offering discounts for stays of 30+ nights to attract the 40.1% of the market seeking extended stays.
- Adjust minimum nights based on seasonality – potentially shorter during low season and longer during peak demand periods in Custer.
Custer Airbnb Cancellation Policy Trends Analysis (2026)
Super Strict 60 Days
18 listings
6.2% of total
Super Strict 30 Days
14 listings
4.8% of total
Refundable
2 listings
0.7% of total
Flexible
41 listings
14.2% of total
Moderate
71 listings
24.6% of total
Firm
108 listings
37.4% of total
Strict
35 listings
12.1% of total
Cancellation Policy Insights for Custer
- The prevailing Airbnb cancellation policy trend in Custer is Firm, used by 37.4% of listings.
- There's a relatively balanced mix between guest-friendly (38.8%) and stricter (49.5%) policies, offering choices for different guest needs.
Recommendations for Hosts
- Consider adopting a Firm policy to align with the 37.4% market standard in Custer.
- Using a Strict policy might deter some guests, as only 12.1% of listings use it. Evaluate if potential revenue protection outweighs possible lower booking rates.
- Regularly review your cancellation policy against competitors and market demand shifts in Custer.
Custer STR Booking Lead Time Analysis (2026)
Average Booking Lead Time by Month
Booking Lead Time Insights for Custer
- The overall average booking lead time for vacation rentals in Custer is 72 days.
- Guests book furthest in advance for stays during June (average 89 days), likely coinciding with peak travel demand or local events.
- The shortest booking windows occur for stays in January (average 21 days), indicating more last-minute travel plans during this time.
- Seasonally, Summer (87 days avg.) sees the longest lead times, while Winter (39 days avg.) has the shortest, reflecting typical travel planning cycles.
Recommendations for Hosts
- Use the overall average lead time (72 days) as a baseline for your pricing and availability strategy in Custer.
- For June stays, consider implementing length-of-stay discounts or slightly higher rates for bookings made less than 89 days out to capitalize on advance planning.
- Target marketing efforts for the Summer season well in advance (at least 87 days) to capture early planners.
- Monitor your own booking lead times against these Custer averages to identify opportunities for dynamic pricing adjustments.
Popular & Essential Airbnb Amenities in Custer (2026)
Amenity Prevalence
Amenity Insights for Custer
- Essential amenities in Custer that guests expect include: Free parking on premises, Wifi. Lacking these (any) could significantly impact bookings.
- Popular amenities like Smoke alarm, Heating, Hot water are common but not universal. Offering these can provide a competitive edge.
Recommendations for Hosts
- Ensure your listing includes all essential amenities for Custer: Free parking on premises, Wifi.
- Prioritize adding missing essentials: Free parking on premises, Wifi.
- Consider adding popular differentiators like Smoke alarm or Heating to increase appeal.
- Highlight unique or less common amenities you offer (e.g., hot tub, dedicated workspace, EV charger) in your listing description and photos.
- Regularly check competitor amenities in Custer to stay competitive.
Custer Airbnb Guest Demographics & Profile Analysis (2026)
Guest Profile Summary for Custer
- The typical guest profile for Airbnb in Custer consists of primarily domestic travelers (97%), often arriving from nearby Sioux Falls, typically belonging to the Post-2000s (Gen Z/Alpha) group (50%), primarily speaking English or Spanish.
- Domestic travelers account for 96.9% of guests.
- Key international markets include United States (96.9%) and Germany (0.4%).
- Top languages spoken are English (79.8%) followed by Spanish (9%).
- A significant demographic segment is the Post-2000s (Gen Z/Alpha) group, representing 50% of guests.
Recommendations for Hosts
- Target domestic marketing efforts towards travelers from Sioux Falls and Minneapolis.
- Tailor amenities and listing descriptions to appeal to the dominant Post-2000s (Gen Z/Alpha) demographic (e.g., highlight fast WiFi, smart home features, local guides).
- Highlight unique local experiences or amenities relevant to the primary guest profile.
- Consider seasonal promotions aligned with peak travel times for key origin markets.
Nearby Short-Term Rental Market Comparison
How does the Custer Airbnb market stack up against its neighbors? Compare key performance metrics like average monthly revenue, ADR, and occupancy rates in surrounding areas to understand the broader regional STR landscape.
| Market | Active Properties | Monthly Revenue | Daily Rate | Avg. Occupancy |
|---|---|---|---|---|
| Powder House Pass | 117 | $6,352 | $571.95 | 38% |
| Black Hawk | 22 | $3,461 | $320.40 | 46% |
| Nemo | 24 | $3,292 | $379.56 | 46% |
| Lead | 485 | $3,078 | $355.55 | 36% |
| Whitewood | 21 | $2,994 | $348.94 | 41% |
| Deadwood | 139 | $2,916 | $348.42 | 37% |
| Keystone | 102 | $2,752 | $268.38 | 48% |
| Rapid City | 678 | $2,626 | $243.25 | 49% |
| Summerset | 16 | $2,605 | $364.02 | 43% |
| Spearfish | 174 | $2,517 | $294.05 | 42% |