Sullivan's Island Airbnb Market Analysis 2026: Short Term Rental Data & Vacation Rental Statistics in South Carolina, United States
Is Airbnb profitable in Sullivan's Island in 2026? Explore comprehensive Airbnb analytics for Sullivan's Island, South Carolina, United States to uncover income potential. This 2026 STR market report for Sullivan's Island, based on AirROI data from February 2025 to January 2026, reveals key trends in the niche market of 23 active listings.
Whether you're considering an Airbnb investment in Sullivan's Island, optimizing your existing vacation rental, or exploring rental arbitrage opportunities, understanding the Sullivan's Island Airbnb data is crucial. Leveraging the low regulation environment is key to maximizing your short term rental income potential. Let's dive into the specifics.
Key Sullivan's Island Airbnb Performance Metrics Overview
Monthly Airbnb Revenue Variations & Income Potential in Sullivan's Island (2026)
Understanding the monthly revenue variations for Airbnb listings in Sullivan's Island is key to maximizing your short term rental income potential. Seasonality significantly impacts earnings. Our analysis, based on data from the past 12 months, shows that the peak revenue month for STRs in Sullivan's Island is typically July, while January often presents the lowest earnings, highlighting opportunities for strategic pricing adjustments during shoulder and low seasons. Explore the typical Airbnb income in Sullivan's Island across different performance tiers:
- Best-in-class properties (Top 10%) achieve $30,007+ monthly, often utilizing dynamic pricing and superior guest experiences.
- Strong performing properties (Top 25%) earn $16,770 or more, indicating effective management and desirable locations/amenities.
- Typical properties (Median) generate around $8,963 per month, representing the average market performance.
- Entry-level properties (Bottom 25%) see earnings around $4,375, often with potential for optimization.
Average Monthly Airbnb Earnings Trend in Sullivan's Island
Sullivan's Island Airbnb Occupancy Rate Trends (2026)
Maximize your bookings by understanding the Sullivan's Island STR occupancy trends. Seasonal demand shifts significantly influence how often properties are booked. Typically, Marchsees the highest demand (peak season occupancy), while December experiences the lowest (low season). Effective strategies, like adjusting minimum stays or offering promotions, can boost occupancy during slower periods. Here's how different property tiers perform in Sullivan's Island:
- Best-in-class properties (Top 10%) achieve 78%+ occupancy, indicating high desirability and potentially optimized availability.
- Strong performing properties (Top 25%) maintain 70% or higher occupancy, suggesting good market fit and guest satisfaction.
- Typical properties (Median) have an occupancy rate around 47%.
- Entry-level properties (Bottom 25%) average 22% occupancy, potentially facing higher vacancy.
Average Monthly Occupancy Rate Trend in Sullivan's Island
Average Daily Rate (ADR) Airbnb Trends in Sullivan's Island (2026)
Effective short term rental pricing strategy in Sullivan's Island involves understanding monthly ADR fluctuations. The Average Daily Rate (ADR) for Airbnb in Sullivan's Island typically peaks in June and dips lowest during January. Leveraging Airbnb dynamic pricing tools or strategies based on this seasonality can significantly boost revenue. Here's a look at the typical nightly rates achieved:
- Best-in-class properties (Top 10%) command rates of $1,781+ per night, often due to premium features or locations.
- Strong performing properties (Top 25%) achieve nightly rates of $1,288 or more.
- Typical properties (Median) charge around $606 per night.
- Entry-level properties (Bottom 25%) earn around $425 per night.
Average Daily Rate (ADR) Trend by Month in Sullivan's Island
Get Live Sullivan's Island Market Intelligence 👇

Explore Real-time Analytics
Airbnb Seasonality Analysis & Trends in Sullivan's Island (2026)
Peak Season (July, August, April)
- Revenue averages $17,308 per month
- Occupancy rates average 56.0%
- Daily rates average $947
Shoulder Season
- Revenue averages $12,752 per month
- Occupancy maintains around 47.5%
- Daily rates hold near $895
Low Season (January, February, November)
- Revenue drops to average $8,129 per month
- Occupancy decreases to average 33.9%
- Daily rates adjust to average $808
Seasonality Insights for Sullivan's Island
- The Airbnb seasonality in Sullivan's Island shows highly seasonal trends requiring careful strategy. While the sections above show seasonal averages, it's also insightful to look at the extremes:
- During the high season, the absolute peak month showcases Sullivan's Island's highest earning potential, with monthly revenues capable of climbing to $19,845, occupancy reaching a high of 62.3%, and ADRs peaking at $1,021.
- Conversely, the slowest single month of the year, typically falling within the low season, marks the market's lowest point. In this month, revenue might dip to $7,200, occupancy could drop to 31.1%, and ADRs may adjust down to $788.
- Understanding both the seasonal averages and these monthly peaks and troughs in revenue, occupancy, and ADR is crucial for maximizing your Airbnb profit potential in Sullivan's Island.
Seasonal Strategies for Maximizing Profit
- Peak Season: Maximize revenue through premium pricing and potentially longer minimum stays. Ensure high availability.
- Low Season: Offer competitive pricing, special promotions (e.g., extended stay discounts), and flexible cancellation policies. Target off-season travelers like remote workers or budget-conscious guests.
- Shoulder Seasons: Implement dynamic pricing that balances peak and low rates. Target weekend travelers or specific events. Offer slightly more flexible terms than peak season.
- Regularly analyze your own performance against these Sullivan's Island seasonality benchmarks and adjust your pricing and availability strategy accordingly.
Best Areas for Airbnb Investment in Sullivan's Island (2026)
Exploring the top neighborhoods for short-term rentals in Sullivan's Island? This section highlights key areas, outlining why they are attractive for hosts and guests, along with notable local attractions. Consider these locations based on your target guest profile and investment strategy.
| Neighborhood / Area | Why Host Here? (Target Guests & Appeal) | Key Attractions & Landmarks |
|---|---|---|
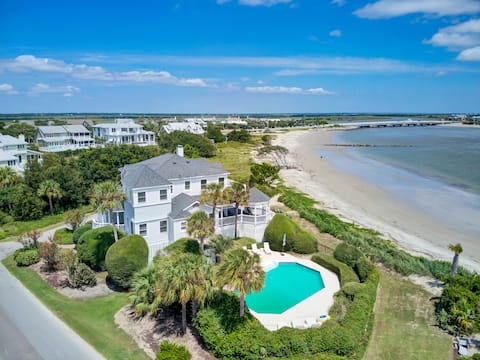
| Front Beach | This area is known for its easy access to the beach and is a favorite among families and vacationers looking to enjoy the sea and sun. The lively atmosphere and nearby amenities attract many tourists. | The Beach, Sullivan's Island Lighthouse, Parks and Recreation Areas, Local Restaurants, Historic Fort Moultrie, Water Sports Activities |
| Middle Street | A charming street filled with local shops and eateries, Middle Street offers a more laid-back vibe while still being close to the beach. Ideal for tourists wanting to experience local culture and cuisine. | Local Boutiques, Sullivan's Island Cafe, Folly Beach Adventure Park, Historic Sites, Local Art Galleries, Shaded Parks |
| East Isle of Palms | Known for its upscale homes and proximity to the water, this area appeals to travelers looking for a luxurious getaway. Its exclusive feel and beautiful surroundings make it a prime location for Airbnb hosts. | Isle of Palms County Park, Water Sports Rentals, Dining Options with Ocean Views, Golf Courses, Botanical Gardens |
| Ocean Boulevard | This location provides stunning ocean views and direct beach access. It's ideal for those seeking a relaxing atmosphere with the convenience of beachside living. | Beautiful Beaches, Beachfront Restaurants, Scenic Walkways, Fishing Opportunities, Water Activities |
| Station 18 | This area offers a quieter, family-friendly environment with easy access to the main attractions of Sullivan's Island. Perfect for those looking for a peaceful retreat near the shore. | Marine Education Center, Family-Friendly Beaches, Community Parks, Historical Markers, Local Events |
| Sullivan's Island Park | A local favorite, this park provides a natural escape with trails and picnic areas. Hosts can attract nature lovers and families looking for a unique outdoor experience. | Nature Trails, Picnic Areas, Wildlife Viewing, Historical Landmarks, Fun Community Events |
| The Sullivan's Island Lighthouse Area | Famous for its historic lighthouse and the picturesque views, this area is perfect for those seeking a blend of history and scenic beauty. Ideal for couples and photographers. | Sullivan's Island Lighthouse, Historical Fort Moultrie, Scenic Ocean Views, Photography Spots, Walking Trails |
| Community Center Area | A central location that hosts community events and gatherings. This area attracts travelers looking for a more local experience while being close to the beach. | Community Events, Local Markets, Sports Facilities, Family-Friendly Activities, Public Amenities |
Understanding Airbnb License Requirements & STR Laws in Sullivan's Island (2026)
While Sullivan's Island, South Carolina, United States currently shows low STR regulations, specific Airbnb license requirements might still exist or change. Always verify the latest short term rental regulations and Airbnb license requirements directly with local government authorities for Sullivan's Island to ensure full compliance before hosting.
(Source: AirROI data, 2026, finding no licensed listings among those analyzed)
Top Performing Airbnb Properties in Sullivan's Island (2026)
Benchmark your potential! Explore examples of top-performing Airbnb properties in Sullivan's Islandbased on Trailing Twelve Month (TTM) revenue. Analyze their characteristics, revenue, occupancy rate, and ADR to understand what drives success in this market.
Haven by AvantStay | Luxury Beachfront Retreat
Entire Place • 6 bedrooms

Raven by AvantStay | Entertainers Dream Escape
Entire Place • 9 bedrooms

Modern Beachfront Escape on Sullivan's Island
Entire Place • 4 bedrooms
Ion by AvantStay | Walk to the Beach + Attractions
Entire Place • 4 bedrooms
Sullivan’s Beach Getaway on Island's Main St
Entire Place • 1 bedroom

Sullivan's Island, SC, Beach House Rental
Entire Place • 4 bedrooms
Note: Performance varies based on location, size, amenities, seasonality, and management quality. Data reflects the past 12 months.
Top Performing Airbnb Hosts in Sullivan's Island (2026)
Learn from the best! This table showcases top-performing Airbnb hosts in Sullivan's Island based on the number of properties managed and estimated total revenue over the past year. Analyze their scale and performance metrics.
| Host Name | Properties | Grossing Revenue | Stay Reviews | Avg Rating |
|---|---|---|---|---|
| AvantStay Charleston | 3 | $897,013 | 105 | 4.76/5.0 |
| Scott | 3 | $244,222 | 276 | 4.86/5.0 |
| Joyner | 1 | $207,961 | 12 | 5.00/5.0 |
| Carroll Realty | 3 | $105,371 | 26 | 4.87/5.0 |
| Rachel | 1 | $102,081 | 50 | 4.72/5.0 |
| Charleston Coast | 1 | $91,393 | 2 | Not Rated |
| Jill | 1 | $83,837 | 2 | Not Rated |
| Beachside By AvantStay | 1 | $50,077 | 3 | 4.67/5.0 |
| Sandra | 1 | $42,774 | 3 | 5.00/5.0 |
| Nora | 1 | $35,613 | 3 | 5.00/5.0 |
Analyzing the strategies of top hosts, such as their property selection, pricing, and guest communication, can offer valuable lessons for optimizing your own Airbnb operations in Sullivan's Island.
Dive Deeper: Advanced Sullivan's Island STR Market Data (2026)
Ready to unlock more insights? AirROI provides access to advanced metrics and comprehensive Airbnb data for Sullivan's Island. Explore detailed analytics beyond this report to refine your investment strategy, optimize pricing, and maximize your vacation rental profits.
Explore Advanced MetricsSullivan's Island Short-Term Rental Market Composition (2026): Property & Room Types
Room Type Distribution
Property Type Distribution
Market Composition Insights for Sullivan's Island
- The Sullivan's Island Airbnb market composition is heavily skewed towards Entire Home/Apt listings, which make up 100% of the 23 active rentals. This indicates strong guest preference for privacy and space.
- Looking at the property type distribution in Sullivan's Island, House properties are the most common (78.3%), reflecting the local real estate landscape.
- Houses represent a significant 78.3% portion, catering likely to families or larger groups.
- Smaller segments like outdoor/unique (combined 4.3%) offer potential for unique stay experiences.
Sullivan's Island Airbnb Room Capacity Analysis (2026): Bedroom Distribution
Distribution of Listings by Number of Bedrooms
Room Capacity Insights for Sullivan's Island
- The dominant room capacity in Sullivan's Island is 4 bedrooms listings, making up 39.1% of the market. This suggests a strong demand for properties suitable for families or small groups.
- Together, 4 bedrooms and 3 bedrooms properties represent 60.8% of the active Airbnb listings in Sullivan's Island, indicating a high concentration in these sizes.
- A significant 82.5% of listings offer 3+ bedrooms, catering to larger groups and families seeking more space in Sullivan's Island.
Sullivan's Island Vacation Rental Guest Capacity Trends (2026)
Distribution of Listings by Guest Capacity
Guest Capacity Insights for Sullivan's Island
- The most common guest capacity trend in Sullivan's Island vacation rentals is listings accommodating 8+ guests (73.9%). This suggests the primary traveler segment is likely larger groups.
- Properties designed for 8+ guests and 4 guests dominate the Sullivan's Island STR market, accounting for 91.3% of listings.
- 82.6% of properties accommodate 6+ guests, serving the market segment for larger families or group travel in Sullivan's Island.
- On average, properties in Sullivan's Island are equipped to host 7.1 guests.
Sullivan's Island Airbnb Booking Patterns (2026): Available vs. Booked Days
Available Days Distribution
Booked Days Distribution
Booking Pattern Insights for Sullivan's Island
- The most common availability pattern in Sullivan's Island falls within the 271-366 days range, representing 69.6% of listings. This suggests many properties have significant open periods on their calendars.
- Approximately 73.9% of listings show high availability (181+ days open annually), indicating potential for increased bookings or specific owner usage patterns.
- For booked days, the 1-30 days range is most frequent in Sullivan's Island (34.8%), reflecting common guest stay durations or potential owner blocking patterns.
- A notable 26.1% of properties secure long booking periods (181+ days booked per year), highlighting successful long-term rental strategies or significant owner usage.
Sullivan's Island Airbnb Minimum Stay Requirements Analysis
Distribution of Listings by Minimum Night Requirement
3 Nights
6 listings
26.1% of total
4-6 Nights
5 listings
21.7% of total
7-29 Nights
3 listings
13% of total
30+ Nights
9 listings
39.1% of total
Key Insights
- The most prevalent minimum stay requirement in Sullivan's Island is 30+ Nights, adopted by 39.1% of listings. This highlights the market's preference for longer commitments.
- A significant segment (39.1%) caters to monthly stays (30+ nights) in Sullivan's Island, pointing to opportunities in the extended-stay market.
Recommendations
- Align with the market by considering a 30+ Nights minimum stay, as 39.1% of Sullivan's Island hosts use this setting.
- Explore offering discounts for stays of 30+ nights to attract the 39.1% of the market seeking extended stays.
- Adjust minimum nights based on seasonality – potentially shorter during low season and longer during peak demand periods in Sullivan's Island.
Sullivan's Island Airbnb Cancellation Policy Trends Analysis (2026)
Super Strict 60 Days
4 listings
17.4% of total
Super Strict 30 Days
6 listings
26.1% of total
Flexible
1 listings
4.3% of total
Firm
9 listings
39.1% of total
Strict
3 listings
13% of total
Cancellation Policy Insights for Sullivan's Island
- The prevailing Airbnb cancellation policy trend in Sullivan's Island is Firm, used by 39.1% of listings.
- A majority (52.1%) of hosts in Sullivan's Island utilize Firm or Strict policies, indicating a market where hosts prioritize booking security.
Recommendations for Hosts
- Consider adopting a Firm policy to align with the 39.1% market standard in Sullivan's Island.
- Using a Strict policy might deter some guests, as only 13% of listings use it. Evaluate if potential revenue protection outweighs possible lower booking rates.
- Regularly review your cancellation policy against competitors and market demand shifts in Sullivan's Island.
Sullivan's Island STR Booking Lead Time Analysis (2026)
Average Booking Lead Time by Month
Booking Lead Time Insights for Sullivan's Island
- The overall average booking lead time for vacation rentals in Sullivan's Island is 104 days.
- Guests book furthest in advance for stays during November (average 127 days), likely coinciding with peak travel demand or local events.
- The shortest booking windows occur for stays in January (average 53 days), indicating more last-minute travel plans during this time.
- Seasonally, Fall (109 days avg.) sees the longest lead times, while Winter (66 days avg.) has the shortest, reflecting typical travel planning cycles.
Recommendations for Hosts
- Use the overall average lead time (104 days) as a baseline for your pricing and availability strategy in Sullivan's Island.
- For November stays, consider implementing length-of-stay discounts or slightly higher rates for bookings made less than 127 days out to capitalize on advance planning.
- Target marketing efforts for the Fall season well in advance (at least 109 days) to capture early planners.
- Monitor your own booking lead times against these Sullivan's Island averages to identify opportunities for dynamic pricing adjustments.
Popular & Essential Airbnb Amenities in Sullivan's Island (2026)
Amenity Prevalence
Amenity Insights for Sullivan's Island
- Essential amenities in Sullivan's Island that guests expect include: Wifi, Kitchen, Dishwasher, TV, Coffee maker, Refrigerator, Dishes and silverware, Free parking on premises, Iron, Air conditioning. Lacking these (any) could significantly impact bookings.
Recommendations for Hosts
- Ensure your listing includes all essential amenities for Sullivan's Island: Wifi, Kitchen, Dishwasher, TV, Coffee maker, Refrigerator, Dishes and silverware, Free parking on premises, Iron, Air conditioning.
- Prioritize adding missing essentials: Coffee maker, Refrigerator, Dishes and silverware, Free parking on premises, Iron, Air conditioning.
- Highlight unique or less common amenities you offer (e.g., hot tub, dedicated workspace, EV charger) in your listing description and photos.
- Regularly check competitor amenities in Sullivan's Island to stay competitive.
Sullivan's Island Airbnb Guest Demographics & Profile Analysis (2026)
Guest Profile Summary for Sullivan's Island
- The typical guest profile for Airbnb in Sullivan's Island consists of primarily domestic travelers (94%), often arriving from nearby Charlotte, typically belonging to the Post-2000s (Gen Z/Alpha) group (50%), primarily speaking English or French.
- Domestic travelers account for 94.2% of guests.
- Key international markets include United States (94.2%) and DC (3.5%).
- Top languages spoken are English (74.1%) followed by French (11.1%).
- A significant demographic segment is the Post-2000s (Gen Z/Alpha) group, representing 50% of guests.
Recommendations for Hosts
- Target domestic marketing efforts towards travelers from Charlotte and Orlando.
- Tailor amenities and listing descriptions to appeal to the dominant Post-2000s (Gen Z/Alpha) demographic (e.g., highlight fast WiFi, smart home features, local guides).
- Highlight unique local experiences or amenities relevant to the primary guest profile.
- Consider seasonal promotions aligned with peak travel times for key origin markets.
Nearby Short-Term Rental Market Comparison
How does the Sullivan's Island Airbnb market stack up against its neighbors? Compare key performance metrics like average monthly revenue, ADR, and occupancy rates in surrounding areas to understand the broader regional STR landscape.
| Market | Active Properties | Monthly Revenue | Daily Rate | Avg. Occupancy |
|---|---|---|---|---|
| Isle of Palms | 1,004 | $7,287 | $730.96 | 43% |
| Folly Beach | 904 | $7,160 | $572.70 | 47% |
| Talahi Island | 41 | $6,064 | $358.56 | 51% |
| Charleston | 1,843 | $5,599 | $389.09 | 53% |
| Okatie | 11 | $5,231 | $510.60 | 41% |
| Ocean Isle Beach | 508 | $5,018 | $610.93 | 38% |
| Mount Pleasant | 448 | $4,561 | $303.21 | 54% |
| Kiawah Island | 624 | $4,526 | $615.10 | 34% |
| Tybee Island | 1,356 | $4,376 | $423.03 | 42% |
| Wilmington Island | 113 | $3,954 | $322.99 | 46% |