Lake City Airbnb Market Analysis 2025: Short Term Rental Data & Vacation Rental Statistics in South Carolina, United States
Is Airbnb profitable in Lake City in 2025? Explore comprehensive Airbnb analytics for Lake City, South Carolina, United States to uncover income potential. This 2025 STR market report for Lake City, based on AirROI data from April 2024 to March 2025, reveals key trends in the niche market of 18 active listings.
Whether you're considering an Airbnb investment in Lake City, optimizing your existing vacation rental, or exploring rental arbitrage opportunities, understanding the Lake City Airbnb data is crucial. Leveraging the low regulation environment is key to maximizing your short term rental income potential. Let's dive into the specifics.
Key Lake City Airbnb Performance Metrics Overview
Monthly Airbnb Revenue Variations & Income Potential in Lake City (2025)
Understanding the monthly revenue variations for Airbnb listings in Lake City is key to maximizing your short term rental income potential. Seasonality significantly impacts earnings. Our analysis, based on data from the past 12 months, shows that the peak revenue month for STRs in Lake City is typically December, while February often presents the lowest earnings, highlighting opportunities for strategic pricing adjustments during shoulder and low seasons. Explore the typical Airbnb income in Lake City across different performance tiers:
- Best-in-class properties (Top 10%) achieve $2,601+ monthly, often utilizing dynamic pricing and superior guest experiences.
- Strong performing properties (Top 25%) earn $1,473 or more, indicating effective management and desirable locations/amenities.
- Typical properties (Median) generate around $837 per month, representing the average market performance.
- Entry-level properties (Bottom 25%) see earnings around $530, often with potential for optimization.
Average Monthly Airbnb Earnings Trend in Lake City
Lake City Airbnb Occupancy Rate Trends (2025)
Maximize your bookings by understanding the Lake City STR occupancy trends. Seasonal demand shifts significantly influence how often properties are booked. Typically, Decembersees the highest demand (peak season occupancy), while April experiences the lowest (low season). Effective strategies, like adjusting minimum stays or offering promotions, can boost occupancy during slower periods. Here's how different property tiers perform in Lake City:
- Best-in-class properties (Top 10%) achieve 72%+ occupancy, indicating high desirability and potentially optimized availability.
- Strong performing properties (Top 25%) maintain 50% or higher occupancy, suggesting good market fit and guest satisfaction.
- Typical properties (Median) have an occupancy rate around 34%.
- Entry-level properties (Bottom 25%) average 14% occupancy, potentially facing higher vacancy.
Average Monthly Occupancy Rate Trend in Lake City
Average Daily Rate (ADR) Airbnb Trends in Lake City (2025)
Effective short term rental pricing strategy in Lake City involves understanding monthly ADR fluctuations. The Average Daily Rate (ADR) for Airbnb in Lake City typically peaks in January and dips lowest during April. Leveraging Airbnb dynamic pricing tools or strategies based on this seasonality can significantly boost revenue. Here's a look at the typical nightly rates achieved:
- Best-in-class properties (Top 10%) command rates of $249+ per night, often due to premium features or locations.
- Strong performing properties (Top 25%) achieve nightly rates of $152 or more.
- Typical properties (Median) charge around $88 per night.
- Entry-level properties (Bottom 25%) earn around $57 per night.
Average Daily Rate (ADR) Trend by Month in Lake City
Get Live Lake City Market Intelligence 👇

Explore Real-time Analytics
Airbnb Seasonality Analysis & Trends in Lake City (2025)
Peak Season (December, October, November)
- Revenue averages $1,744 per month
- Occupancy rates average 43.5%
- Daily rates average $125
Shoulder Season
- Revenue averages $1,258 per month
- Occupancy maintains around 35.2%
- Daily rates hold near $125
Low Season (February, March, April)
- Revenue drops to average $934 per month
- Occupancy decreases to average 32.4%
- Daily rates adjust to average $125
Seasonality Insights for Lake City
- The Airbnb seasonality in Lake City shows highly seasonal trends requiring careful strategy. While the sections above show seasonal averages, it's also insightful to look at the extremes:
- During the high season, the absolute peak month showcases Lake City's highest earning potential, with monthly revenues capable of climbing to $1,984, occupancy reaching a high of 49.0%, and ADRs peaking at $130.
- Conversely, the slowest single month of the year, typically falling within the low season, marks the market's lowest point. In this month, revenue might dip to $889, occupancy could drop to 27.3%, and ADRs may adjust down to $116.
- Understanding both the seasonal averages and these monthly peaks and troughs in revenue, occupancy, and ADR is crucial for maximizing your Airbnb profit potential in Lake City.
Seasonal Strategies for Maximizing Profit
- Peak Season: Maximize revenue through premium pricing and potentially longer minimum stays. Ensure high availability.
- Low Season: Offer competitive pricing, special promotions (e.g., extended stay discounts), and flexible cancellation policies. Target off-season travelers like remote workers or budget-conscious guests.
- Shoulder Seasons: Implement dynamic pricing that balances peak and low rates. Target weekend travelers or specific events. Offer slightly more flexible terms than peak season.
- Regularly analyze your own performance against these Lake City seasonality benchmarks and adjust your pricing and availability strategy accordingly.
Best Areas for Airbnb Investment in Lake City (2025)
Exploring the top neighborhoods for short-term rentals in Lake City? This section highlights key areas, outlining why they are attractive for hosts and guests, along with notable local attractions. Consider these locations based on your target guest profile and investment strategy.
| Neighborhood / Area | Why Host Here? (Target Guests & Appeal) | Key Attractions & Landmarks |
|---|---|---|
| Downtown Lake City | The central business district with access to shops, restaurants, and local events. Attracts both business travelers and tourists looking to explore local culture and food. | Lake City Farmer's Market, Lake City ArtFest, Carter Park, local dining options, Lake City Historical Museum |
| Lake City Community Theatre Area | A cultural hub that draws theatre lovers and visitors attending shows. Provides opportunities for overnight stays during performances. | Lake City Community Theatre, various local performances and events, art galleries nearby |
| Pee Dee State Farmers Market | A popular location for visitors on weekends looking for fresh produce and local goods. A good site for hosting short-term rentals during market days. | Farmers market, food vendors, craft booths |
| Mullins Highway Area | A family-friendly neighborhood with access to parks and local attractions. Perfect for families visiting the area for events or activities. | Lake City Park, amusement areas, local restaurants |
| Cypress Gardens Area | Known for its scenic beauty and outdoor activities. Attracts nature lovers and people looking to escape urban life. | Cypress Gardens, hiking trails, water sports, picnic areas |
| Neighborhoods near Lake City High School | An area with a youthful vibe often visited by families and friends of students during sports and school events. | Lake City High School sports events, local fast food and casual dining, community parks |
| Local Museums District | Home to significant historical sites and museums, attracts history buffs and tourists interested in local heritage. | Lake City Historical Museum, Cotton Museum, art exhibits |
| Nearby Outdoor Recreation Areas | Ideal for outdoor enthusiasts, offering short-term rentals for those looking to hike, fish, and enjoy nature excursions. | Lakes and rivers for fishing, hiking trails nearby, wildlife viewing areas |
Understanding Airbnb License Requirements & STR Laws in Lake City (2025)
While Lake City, South Carolina, United States currently shows low STR regulations, specific Airbnb license requirements might still exist or change. Always verify the latest short term rental regulations and Airbnb license requirements directly with local government authorities for Lake City to ensure full compliance before hosting.
(Source: AirROI data, 2025, finding no licensed listings among those analyzed)
Top Performing Airbnb Properties in Lake City (2025)
Benchmark your potential! Explore examples of top-performing Airbnb properties in Lake Citybased on Trailing Twelve Month (TTM) revenue. Analyze their characteristics, revenue, occupancy rate, and ADR to understand what drives success in this market.
Olives Bed and Breakfast
Entire Place • 3 bedrooms
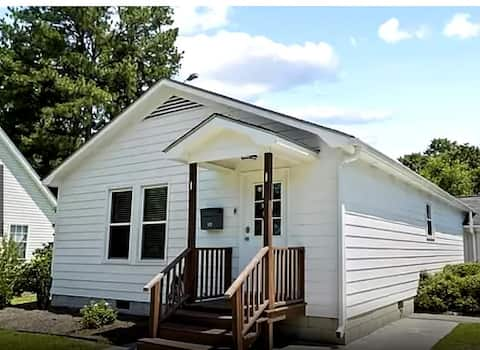
Brown's Downtown Lake City Cottage
Entire Place • 2 bedrooms

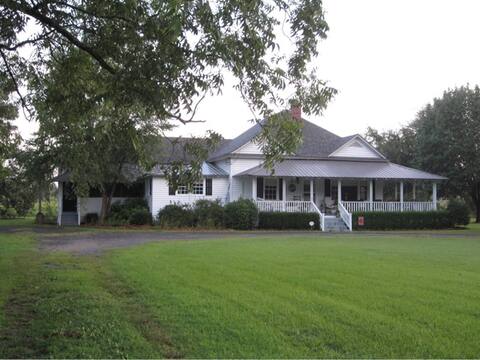
Browns Bed and Breakfast, a peaceful country home
Entire Place • 4 bedrooms

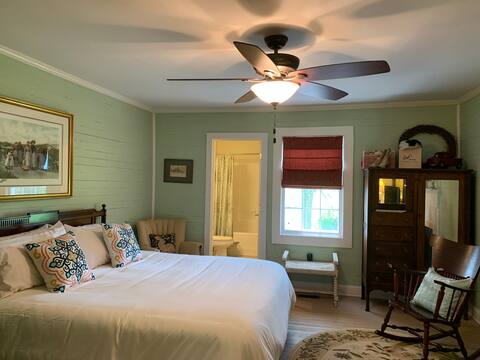
Peaceful country close to town.
Entire Place • 3 bedrooms

Home Away From Home Apt 3 - A Hidden Gem
Entire Place • 1 bedroom
Lula Melissa Room @ Olive's B&B
Private Room • N/A
Note: Performance varies based on location, size, amenities, seasonality, and management quality. Data reflects the past 12 months.
Top Performing Airbnb Hosts in Lake City (2025)
Learn from the best! This table showcases top-performing Airbnb hosts in Lake City based on the number of properties managed and estimated total revenue over the past year. Analyze their scale and performance metrics.
| Host Name | Properties | Grossing Revenue | Stay Reviews | Avg Rating |
|---|---|---|---|---|
| Elaine | 4 | $66,243 | 58 | 4.99/5.0 |
| Johnny | 6 | $48,544 | 1168 | 4.87/5.0 |
| Stacey And Kenneth | 1 | $27,741 | 69 | 4.87/5.0 |
| Wendy | 3 | $21,317 | 27 | 4.86/5.0 |
| Stacie | 1 | $19,367 | 104 | 4.90/5.0 |
| Jennifer And Harley | 1 | $5,431 | 130 | 4.92/5.0 |
| Host #329815331 | 1 | $5,371 | 2 | 0.00/5.0 |
| Marilyn | 1 | $4,575 | 229 | 4.95/5.0 |
Analyzing the strategies of top hosts, such as their property selection, pricing, and guest communication, can offer valuable lessons for optimizing your own Airbnb operations in Lake City.
Dive Deeper: Advanced Lake City STR Market Data (2025)
Ready to unlock more insights? AirROI provides access to advanced metrics and comprehensive Airbnb data for Lake City. Explore detailed analytics beyond this report to refine your investment strategy, optimize pricing, and maximize your vacation rental profits.
Explore Advanced MetricsLake City Short-Term Rental Market Composition (2025): Property & Room Types
Room Type Distribution
Property Type Distribution
Market Composition Insights for Lake City
- The Lake City Airbnb market composition is heavily skewed towards Private Room listings, which make up 50% of the 18 active rentals. This indicates strong guest preference for privacy and space.
- Looking at the property type distribution in Lake City, House properties are the most common (44.4%), reflecting the local real estate landscape.
- Houses represent a significant 44.4% portion, catering likely to families or larger groups.
- The presence of 22.2% Hotel/Boutique listings indicates integration with traditional hospitality.
Lake City Airbnb Room Capacity Analysis (2025): Bedroom Distribution
Distribution of Listings by Number of Bedrooms
Room Capacity Insights for Lake City
- The dominant room capacity in Lake City is 1 bedroom listings, making up 16.7% of the market. This suggests a strong demand for properties suitable for couples or solo travelers.
- Together, 1 bedroom and 3 bedrooms properties represent 33.4% of the active Airbnb listings in Lake City, indicating a high concentration in these sizes.
- A significant 22.3% of listings offer 3+ bedrooms, catering to larger groups and families seeking more space in Lake City.
Lake City Vacation Rental Guest Capacity Trends (2025)
Distribution of Listings by Guest Capacity
Guest Capacity Insights for Lake City
- The most common guest capacity trend in Lake City vacation rentals is listings accommodating 2 guests (22.2%). This suggests the primary traveler segment is likely couples or solo travelers.
- Properties designed for 2 guests and 4 guests dominate the Lake City STR market, accounting for 33.3% of listings.
- 16.7% of properties accommodate 6+ guests, serving the market segment for larger families or group travel in Lake City.
- On average, properties in Lake City are equipped to host 2.0 guests.
Lake City Airbnb Booking Patterns (2025): Available vs. Booked Days
Available Days Distribution
Booked Days Distribution
Booking Pattern Insights for Lake City
- The most common availability pattern in Lake City falls within the 271-366 days range, representing 44.4% of listings. This suggests many properties have significant open periods on their calendars.
- Approximately 83.3% of listings show high availability (181+ days open annually), indicating potential for increased bookings or specific owner usage patterns.
- For booked days, the 91-180 days range is most frequent in Lake City (33.3%), reflecting common guest stay durations or potential owner blocking patterns.
- A notable 22.3% of properties secure long booking periods (181+ days booked per year), highlighting successful long-term rental strategies or significant owner usage.
Lake City Airbnb Minimum Stay Requirements Analysis
Distribution of Listings by Minimum Night Requirement
1 Night
16 listings
88.9% of total
2 Nights
1 listings
5.6% of total
30+ Nights
1 listings
5.6% of total
Key Insights
- The most prevalent minimum stay requirement in Lake City is 1 Night, adopted by 88.9% of listings. This highlights the market's preference for shorter, flexible bookings.
- A strong majority (94.5%) of the Lake City Airbnb data shows acceptance of very short stays (1-2 nights), indicating a dynamic, high-turnover market.
Recommendations
- Align with the market by considering a 1 Night minimum stay, as 88.9% of Lake City hosts use this setting.
- Explore offering discounts for stays of 30+ nights to attract the 5.6% of the market seeking extended stays.
- Adjust minimum nights based on seasonality – potentially shorter during low season and longer during peak demand periods in Lake City.
Lake City Airbnb Cancellation Policy Trends Analysis (2025)
Flexible
12 listings
70.6% of total
Moderate
4 listings
23.5% of total
Strict
1 listings
5.9% of total
Cancellation Policy Insights for Lake City
- The prevailing Airbnb cancellation policy trend in Lake City is Flexible, used by 70.6% of listings.
- The market strongly favors guest-friendly terms, with 94.1% of listings offering Flexible or Moderate policies. This suggests guests in Lake City may expect booking flexibility.
- Strict cancellation policies are quite rare (5.9%), potentially making listings with this policy less competitive unless justified by high demand or property type.
Recommendations for Hosts
- Consider adopting a Flexible policy to align with the 70.6% market standard in Lake City.
- Given the high prevalence of Flexible policies (70.6%), offering this can enhance booking appeal, especially during shoulder seasons.
- Using a Strict policy might deter some guests, as only 5.9% of listings use it. Evaluate if potential revenue protection outweighs possible lower booking rates.
- Regularly review your cancellation policy against competitors and market demand shifts in Lake City.
Lake City STR Booking Lead Time Analysis (2025)
Average Booking Lead Time by Month
Booking Lead Time Insights for Lake City
- The overall average booking lead time for vacation rentals in Lake City is 43 days.
- Guests book furthest in advance for stays during December (average 100 days), likely coinciding with peak travel demand or local events.
- The shortest booking windows occur for stays in February (average 7 days), indicating more last-minute travel plans during this time.
- Seasonally, Spring (53 days avg.) sees the longest lead times, while Summer (13 days avg.) has the shortest, reflecting typical travel planning cycles.
Recommendations for Hosts
- Use the overall average lead time (43 days) as a baseline for your pricing and availability strategy in Lake City.
- For December stays, consider implementing length-of-stay discounts or slightly higher rates for bookings made less than 100 days out to capitalize on advance planning.
- During February, focus on last-minute booking availability and promotions, as guests book with very short notice (7 days avg.).
- Target marketing efforts for the Spring season well in advance (at least 53 days) to capture early planners.
- Monitor your own booking lead times against these Lake City averages to identify opportunities for dynamic pricing adjustments.
Popular & Essential Airbnb Amenities in Lake City (2025)
Amenity Prevalence
Amenity Insights for Lake City
- Essential amenities in Lake City that guests expect include: TV, Air conditioning, Wifi, Free parking on premises. Lacking these (any) could significantly impact bookings.
- Popular amenities like Heating, Carbon monoxide alarm, Smoke alarm are common but not universal. Offering these can provide a competitive edge.
Recommendations for Hosts
- Ensure your listing includes all essential amenities for Lake City: TV, Air conditioning, Wifi, Free parking on premises.
- Consider adding popular differentiators like Heating or Carbon monoxide alarm to increase appeal.
- Highlight unique or less common amenities you offer (e.g., hot tub, dedicated workspace, EV charger) in your listing description and photos.
- Regularly check competitor amenities in Lake City to stay competitive.
Lake City Airbnb Guest Demographics & Profile Analysis (2025)
Guest Profile Summary for Lake City
- The typical guest profile for Airbnb in Lake City consists of primarily domestic travelers (98%), often arriving from nearby Atlanta, typically belonging to the Post-2000s (Gen Z/Alpha) group (50%), primarily speaking English or Spanish.
- Domestic travelers account for 97.5% of guests.
- Key international markets include United States (97.5%) and DC (1%).
- Top languages spoken are English (75.8%) followed by Spanish (20.8%).
- A significant demographic segment is the Post-2000s (Gen Z/Alpha) group, representing 50% of guests.
Recommendations for Hosts
- Target domestic marketing efforts towards travelers from Atlanta and Columbia.
- Tailor amenities and listing descriptions to appeal to the dominant Post-2000s (Gen Z/Alpha) demographic (e.g., highlight fast WiFi, smart home features, local guides).
- Highlight unique local experiences or amenities relevant to the primary guest profile.
- Consider seasonal promotions aligned with peak travel times for key origin markets.
Nearby Short-Term Rental Market Comparison
How does the Lake City Airbnb market stack up against its neighbors? Compare key performance metrics like average monthly revenue, ADR, and occupancy rates in surrounding areas to understand the broader regional STR landscape.
| Market | Active Properties | Monthly Revenue | Daily Rate | Avg. Occupancy |
|---|---|---|---|---|
| Folly Beach | 885 | $6,398 | $497.67 | 47% |
| Sullivan's Island | 24 | $6,341 | $798.57 | 43% |
| Isle of Palms | 873 | $6,018 | $636.28 | 40% |
| Ocean Isle Beach | 414 | $5,769 | $604.07 | 39% |
| Talahi Island | 47 | $5,577 | $314.14 | 50% |
| Charleston | 1,841 | $5,054 | $354.60 | 53% |
| Mount Pleasant | 445 | $4,059 | $277.98 | 54% |
| Tybee Island | 1,260 | $3,913 | $385.21 | 40% |
| Fripp Island | 124 | $3,827 | $413.61 | 37% |
| Kiawah Island | 532 | $3,755 | $514.97 | 35% |