Providence Airbnb Market Analysis 2026: Short Term Rental Data & Vacation Rental Statistics in Rhode Island, United States
Is Airbnb profitable in Providence in 2026? Explore comprehensive Airbnb analytics for Providence, Rhode Island, United States to uncover income potential. This 2026 STR market report for Providence, based on AirROI data from February 2025 to January 2026, reveals key trends in the market of 793 active listings.
Whether you're considering an Airbnb investment in Providence, optimizing your existing vacation rental, or exploring rental arbitrage opportunities, understanding the Providence Airbnb data is crucial. Navigating the high regulation landscape is key to maximizing your short term rental income potential. Let's dive into the specifics.
Key Providence Airbnb Performance Metrics Overview
Monthly Airbnb Revenue Variations & Income Potential in Providence (2026)
Understanding the monthly revenue variations for Airbnb listings in Providence is key to maximizing your short term rental income potential. Seasonality significantly impacts earnings. Our analysis, based on data from the past 12 months, shows that the peak revenue month for STRs in Providence is typically July, while February often presents the lowest earnings, highlighting opportunities for strategic pricing adjustments during shoulder and low seasons. Explore the typical Airbnb income in Providence across different performance tiers:
- Best-in-class properties (Top 10%) achieve $6,534+ monthly, often utilizing dynamic pricing and superior guest experiences.
- Strong performing properties (Top 25%) earn $4,250 or more, indicating effective management and desirable locations/amenities.
- Typical properties (Median) generate around $2,488 per month, representing the average market performance.
- Entry-level properties (Bottom 25%) see earnings around $1,277, often with potential for optimization.
Average Monthly Airbnb Earnings Trend in Providence
Providence Airbnb Occupancy Rate Trends (2026)
Maximize your bookings by understanding the Providence STR occupancy trends. Seasonal demand shifts significantly influence how often properties are booked. Typically, Julysees the highest demand (peak season occupancy), while January experiences the lowest (low season). Effective strategies, like adjusting minimum stays or offering promotions, can boost occupancy during slower periods. Here's how different property tiers perform in Providence:
- Best-in-class properties (Top 10%) achieve 85%+ occupancy, indicating high desirability and potentially optimized availability.
- Strong performing properties (Top 25%) maintain 72% or higher occupancy, suggesting good market fit and guest satisfaction.
- Typical properties (Median) have an occupancy rate around 53%.
- Entry-level properties (Bottom 25%) average 31% occupancy, potentially facing higher vacancy.
Average Monthly Occupancy Rate Trend in Providence
Average Daily Rate (ADR) Airbnb Trends in Providence (2026)
Effective short term rental pricing strategy in Providence involves understanding monthly ADR fluctuations. The Average Daily Rate (ADR) for Airbnb in Providence typically peaks in September and dips lowest during February. Leveraging Airbnb dynamic pricing tools or strategies based on this seasonality can significantly boost revenue. Here's a look at the typical nightly rates achieved:
- Best-in-class properties (Top 10%) command rates of $385+ per night, often due to premium features or locations.
- Strong performing properties (Top 25%) achieve nightly rates of $236 or more.
- Typical properties (Median) charge around $156 per night.
- Entry-level properties (Bottom 25%) earn around $93 per night.
Average Daily Rate (ADR) Trend by Month in Providence
Get Live Providence Market Intelligence 👇

Explore Real-time Analytics
Airbnb Seasonality Analysis & Trends in Providence (2026)
Peak Season (July, August, June)
- Revenue averages $4,281 per month
- Occupancy rates average 60.5%
- Daily rates average $227
Shoulder Season
- Revenue averages $3,241 per month
- Occupancy maintains around 51.9%
- Daily rates hold near $218
Low Season (January, February, December)
- Revenue drops to average $2,293 per month
- Occupancy decreases to average 41.6%
- Daily rates adjust to average $210
Seasonality Insights for Providence
- The Airbnb seasonality in Providence shows highly seasonal trends requiring careful strategy. While the sections above show seasonal averages, it's also insightful to look at the extremes:
- During the high season, the absolute peak month showcases Providence's highest earning potential, with monthly revenues capable of climbing to $4,473, occupancy reaching a high of 61.5%, and ADRs peaking at $234.
- Conversely, the slowest single month of the year, typically falling within the low season, marks the market's lowest point. In this month, revenue might dip to $2,104, occupancy could drop to 37.4%, and ADRs may adjust down to $192.
- Understanding both the seasonal averages and these monthly peaks and troughs in revenue, occupancy, and ADR is crucial for maximizing your Airbnb profit potential in Providence.
Seasonal Strategies for Maximizing Profit
- Peak Season: Maximize revenue through premium pricing and potentially longer minimum stays. Ensure high availability.
- Low Season: Offer competitive pricing, special promotions (e.g., extended stay discounts), and flexible cancellation policies. Target off-season travelers like remote workers or budget-conscious guests.
- Shoulder Seasons: Implement dynamic pricing that balances peak and low rates. Target weekend travelers or specific events. Offer slightly more flexible terms than peak season.
- Regularly analyze your own performance against these Providence seasonality benchmarks and adjust your pricing and availability strategy accordingly.
Best Areas for Airbnb Investment in Providence (2026)
Exploring the top neighborhoods for short-term rentals in Providence? This section highlights key areas, outlining why they are attractive for hosts and guests, along with notable local attractions. Consider these locations based on your target guest profile and investment strategy.
| Neighborhood / Area | Why Host Here? (Target Guests & Appeal) | Key Attractions & Landmarks |
|---|---|---|
| Federal Hill | Renowned for its Italian heritage and vibrant food scene, Federal Hill is a prime location for tourists seeking culture and dining experiences. The area boasts a variety of restaurants and is close to downtown Providence. | Atwells Avenue, Holy Ghost Church, Federal Hill Park, Restaurants and cafes, Italian cultural festivals |
| Downtown Providence | The heart of the city's business and cultural activities, Downtown Providence attracts both tourists and professionals with its historic charm, art, and entertainment options. | WaterFire, Providence Performing Arts Center, Johnson and Wales University, Providence Place Mall, The Arcade |
| Thayer Street | Situated near Brown University and RISD, Thayer Street is popular among students and young adults, offering a mix of trendy shops, cafes, and eateries. This vibrant area has a youthful energy appealing to many visitors. | Brown University, Rhode Island School of Design, Shops and boutiques, Restaurants and coffee shops, The Vets Theater |
| East Side | A picturesque residential area known for its historic homes and tree-lined streets, the East Side attracts those looking for a charming neighborhood atmosphere while still being close to downtown and universities. | Blackstone Boulevard, India Point Park, Benefit Street Historic District, Lippitt Memorial Park, TheRISD Museum |
| Wickenden Street | Wickenden is a trendy area known for its artsy vibe, featuring a collection of unique shops, galleries, and eateries. The area attracts a diverse crowd that appreciates local artisans and culture. | Wickenden Street shops, Art galleries, Waterfront access, Cafes and restaurants, Local events |
| Mount Pleasant | A quieter residential area that appeals to families and those looking for a peaceful retreat. It offers a more suburban feel while still being accessible to the activities of the city. | Roger Williams Park, Mount Pleasant Park, Cranston Country Club, Local shops and diners, Community events |
| South Providence | Emerging as an area of interest for young travelers and creatives, South Providence offers cultural diversity and a growing arts scene, making it a fascinating destination. | The Steel Yard, The Avenue Concept, Local eateries, Cultural events, Art studios |
| Fox Point | A historic and picturesque neighborhood with a charming local atmosphere, Fox Point is close to the waterfront and offers a blend of residential life and accessibility to downtown attractions. | India Point Park, Waterfront, East Bay Bike Path, Local cafes, Community events |
Understanding Airbnb License Requirements & STR Laws in Providence (2026)
Yes, Providence, Rhode Island, United States enforces high STR regulations. Obtaining a license and ensuring compliance is almost certainly required according to current 2026 STR laws. Always verify the latest short term rental regulations and Airbnb license requirements directly with local government authorities for Providence to ensure full compliance before hosting.
(Source: AirROI data, 2026, based on 87% licensed listings)
Top Performing Airbnb Properties in Providence (2026)
Benchmark your potential! Explore examples of top-performing Airbnb properties in Providencebased on Trailing Twelve Month (TTM) revenue. Analyze their characteristics, revenue, occupancy rate, and ADR to understand what drives success in this market.
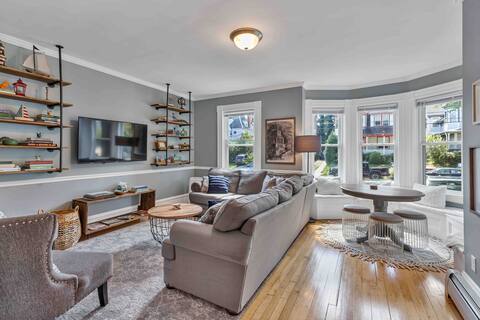
The Wayland House - 6BR Family ❤️ Retreat Sleeps 15
Entire Place • 6 bedrooms
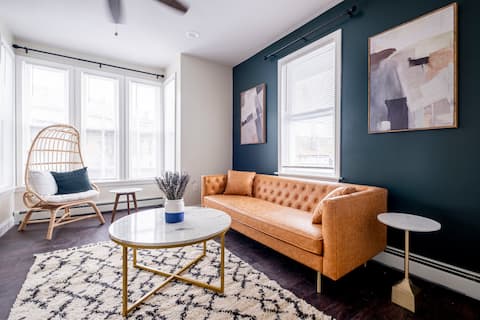
★Modern & Spacious # 10-Bedrooms! Great For Groups
Entire Place • 10 bedrooms
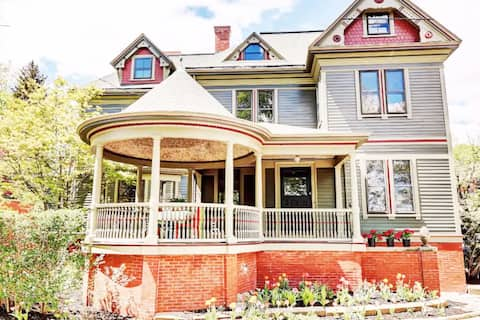
Elegant Victorian House, sleeps 14 near Brown/RISD
Entire Place • 7 bedrooms
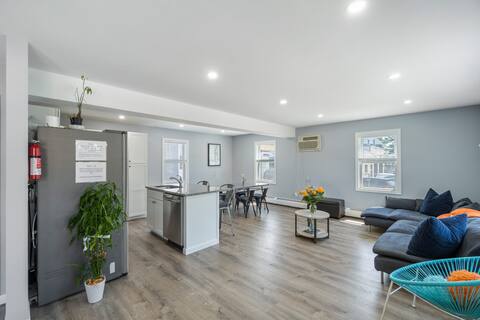
Sun Room @ The Admiral-Walk to Providence College
Private Room • N/A

The Garbaldi-Steps to downtown & Federal Hill
Entire Place • 12 bedrooms
Benefit Street home minutes from Brown and RISD
Entire Place • 4 bedrooms
Note: Performance varies based on location, size, amenities, seasonality, and management quality. Data reflects the past 12 months.
Top Performing Airbnb Hosts in Providence (2026)
Learn from the best! This table showcases top-performing Airbnb hosts in Providence based on the number of properties managed and estimated total revenue over the past year. Analyze their scale and performance metrics.
| Host Name | Properties | Grossing Revenue | Stay Reviews | Avg Rating |
|---|---|---|---|---|
| Totana | 25 | $1,711,503 | 1378 | 4.86/5.0 |
| Jennifer | 23 | $1,553,910 | 5242 | 4.93/5.0 |
| Aref | 22 | $935,260 | 5660 | 4.91/5.0 |
| Keiko | 4 | $604,774 | 327 | 5.00/5.0 |
| Xiaoshan And Boris | 13 | $576,744 | 1150 | 4.84/5.0 |
| Gabriel | 16 | $545,324 | 379 | 4.98/5.0 |
| Boris | 14 | $515,950 | 1840 | 4.73/5.0 |
| Haûte Hospitality Team | 29 | $503,095 | 996 | 4.39/5.0 |
| Richard | 6 | $426,621 | 339 | 4.92/5.0 |
| Firas | 9 | $413,277 | 378 | 4.91/5.0 |
Analyzing the strategies of top hosts, such as their property selection, pricing, and guest communication, can offer valuable lessons for optimizing your own Airbnb operations in Providence.
Dive Deeper: Advanced Providence STR Market Data (2026)
Ready to unlock more insights? AirROI provides access to advanced metrics and comprehensive Airbnb data for Providence. Explore detailed analytics beyond this report to refine your investment strategy, optimize pricing, and maximize your vacation rental profits.
Explore Advanced MetricsProvidence Short-Term Rental Market Composition (2026): Property & Room Types
Room Type Distribution
Property Type Distribution
Market Composition Insights for Providence
- The Providence Airbnb market composition is heavily skewed towards Entire Home/Apt listings, which make up 71.1% of the 793 active rentals. This indicates strong guest preference for privacy and space.
- Looking at the property type distribution in Providence, Apartment/Condo properties are the most common (68.5%), reflecting the local real estate landscape.
- Houses represent a significant 25.5% portion, catering likely to families or larger groups.
- Smaller segments like others, hotel/boutique, outdoor/unique, unique stays (combined 6.0%) offer potential for unique stay experiences.
Providence Airbnb Room Capacity Analysis (2026): Bedroom Distribution
Distribution of Listings by Number of Bedrooms
Room Capacity Insights for Providence
- The dominant room capacity in Providence is 2 bedrooms listings, making up 25.1% of the market. This suggests a strong demand for properties suitable for couples or solo travelers.
- Together, 2 bedrooms and 1 bedroom properties represent 45.8% of the active Airbnb listings in Providence, indicating a high concentration in these sizes.
- A significant 25.3% of listings offer 3+ bedrooms, catering to larger groups and families seeking more space in Providence.
Providence Vacation Rental Guest Capacity Trends (2026)
Distribution of Listings by Guest Capacity
Guest Capacity Insights for Providence
- The most common guest capacity trend in Providence vacation rentals is listings accommodating 4 guests (16.9%). This suggests the primary traveler segment is likely small families or groups.
- Properties designed for 4 guests and 2 guests dominate the Providence STR market, accounting for 30.1% of listings.
- 30.1% of properties accommodate 6+ guests, serving the market segment for larger families or group travel in Providence.
- On average, properties in Providence are equipped to host 3.5 guests.
Providence Airbnb Booking Patterns (2026): Available vs. Booked Days
Available Days Distribution
Booked Days Distribution
Booking Pattern Insights for Providence
- The most common availability pattern in Providence falls within the 271-366 days range, representing 30.3% of listings. This suggests many properties have significant open periods on their calendars.
- Approximately 60.1% of listings show high availability (181+ days open annually), indicating potential for increased bookings or specific owner usage patterns.
- For booked days, the 181-270 days range is most frequent in Providence (30.6%), reflecting common guest stay durations or potential owner blocking patterns.
- A notable 41.4% of properties secure long booking periods (181+ days booked per year), highlighting successful long-term rental strategies or significant owner usage.
Providence Airbnb Minimum Stay Requirements Analysis
Distribution of Listings by Minimum Night Requirement
1 Night
257 listings
32.4% of total
2 Nights
183 listings
23.1% of total
3 Nights
29 listings
3.7% of total
4-6 Nights
25 listings
3.2% of total
7-29 Nights
79 listings
10% of total
30+ Nights
220 listings
27.7% of total
Key Insights
- The most prevalent minimum stay requirement in Providence is 1 Night, adopted by 32.4% of listings. This highlights the market's preference for shorter, flexible bookings.
- A significant segment (27.7%) caters to monthly stays (30+ nights) in Providence, pointing to opportunities in the extended-stay market.
Recommendations
- Align with the market by considering a 1 Night minimum stay, as 32.4% of Providence hosts use this setting.
- Explore offering discounts for stays of 30+ nights to attract the 27.7% of the market seeking extended stays.
- Adjust minimum nights based on seasonality – potentially shorter during low season and longer during peak demand periods in Providence.
Providence Airbnb Cancellation Policy Trends Analysis (2026)
Super Strict 30 Days
6 listings
0.8% of total
Limited
15 listings
1.9% of total
Flexible
127 listings
16% of total
Moderate
217 listings
27.4% of total
Firm
218 listings
27.5% of total
Strict
209 listings
26.4% of total
Cancellation Policy Insights for Providence
- The prevailing Airbnb cancellation policy trend in Providence is Firm, used by 27.5% of listings.
- A majority (53.9%) of hosts in Providence utilize Firm or Strict policies, indicating a market where hosts prioritize booking security.
Recommendations for Hosts
- Consider adopting a Firm policy to align with the 27.5% market standard in Providence.
- Regularly review your cancellation policy against competitors and market demand shifts in Providence.
Providence STR Booking Lead Time Analysis (2026)
Average Booking Lead Time by Month
Booking Lead Time Insights for Providence
- The overall average booking lead time for vacation rentals in Providence is 43 days.
- Guests book furthest in advance for stays during May (average 81 days), likely coinciding with peak travel demand or local events.
- The shortest booking windows occur for stays in February (average 20 days), indicating more last-minute travel plans during this time.
- Seasonally, Spring (48 days avg.) sees the longest lead times, while Winter (30 days avg.) has the shortest, reflecting typical travel planning cycles.
Recommendations for Hosts
- Use the overall average lead time (43 days) as a baseline for your pricing and availability strategy in Providence.
- For May stays, consider implementing length-of-stay discounts or slightly higher rates for bookings made less than 81 days out to capitalize on advance planning.
- Target marketing efforts for the Spring season well in advance (at least 48 days) to capture early planners.
- Monitor your own booking lead times against these Providence averages to identify opportunities for dynamic pricing adjustments.
Popular & Essential Airbnb Amenities in Providence (2026)
Amenity Prevalence
Amenity Insights for Providence
- Essential amenities in Providence that guests expect include: Wifi, Smoke alarm, Heating, Carbon monoxide alarm, Air conditioning. Lacking these (any) could significantly impact bookings.
- Popular amenities like Hot water, Kitchen, Dishes and silverware are common but not universal. Offering these can provide a competitive edge.
Recommendations for Hosts
- Ensure your listing includes all essential amenities for Providence: Wifi, Smoke alarm, Heating, Carbon monoxide alarm, Air conditioning.
- Prioritize adding missing essentials: Wifi, Smoke alarm, Heating, Carbon monoxide alarm, Air conditioning.
- Consider adding popular differentiators like Hot water or Kitchen to increase appeal.
- Highlight unique or less common amenities you offer (e.g., hot tub, dedicated workspace, EV charger) in your listing description and photos.
- Regularly check competitor amenities in Providence to stay competitive.
Providence Airbnb Guest Demographics & Profile Analysis (2026)
Guest Profile Summary for Providence
- The typical guest profile for Airbnb in Providence consists of primarily domestic travelers (91%), often arriving from nearby New York, typically belonging to the Post-2000s (Gen Z/Alpha) group (50%), primarily speaking English or Spanish.
- Domestic travelers account for 91.0% of guests.
- Key international markets include United States (91%) and Canada (1.5%).
- Top languages spoken are English (62.6%) followed by Spanish (14.2%).
- A significant demographic segment is the Post-2000s (Gen Z/Alpha) group, representing 50% of guests.
Recommendations for Hosts
- Target domestic marketing efforts towards travelers from New York and Boston.
- Tailor amenities and listing descriptions to appeal to the dominant Post-2000s (Gen Z/Alpha) demographic (e.g., highlight fast WiFi, smart home features, local guides).
- Highlight unique local experiences or amenities relevant to the primary guest profile.
- Consider seasonal promotions aligned with peak travel times for key origin markets.
Nearby Short-Term Rental Market Comparison
How does the Providence Airbnb market stack up against its neighbors? Compare key performance metrics like average monthly revenue, ADR, and occupancy rates in surrounding areas to understand the broader regional STR landscape.
| Market | Active Properties | Monthly Revenue | Daily Rate | Avg. Occupancy |
|---|---|---|---|---|
| Nantucket | 539 | $7,748 | $1045.40 | 41% |
| Sag Harbor | 15 | $6,129 | $1280.84 | 40% |
| Town of East Hampton | 1,327 | $5,945 | $986.02 | 36% |
| Middletown | 395 | $5,781 | $589.01 | 45% |
| North Andover | 12 | $5,625 | $440.84 | 45% |
| Town of Southampton | 1,201 | $5,620 | $1002.45 | 33% |
| Nahant | 13 | $5,564 | $602.44 | 42% |
| Southampton | 19 | $5,405 | $1456.43 | 30% |
| New Shoreham | 120 | $5,359 | $637.79 | 45% |
| Wellesley | 22 | $5,310 | $520.90 | 50% |