Newport Airbnb Market Analysis 2026: Short Term Rental Data & Vacation Rental Statistics in Rhode Island, United States
Is Airbnb profitable in Newport in 2026? Explore comprehensive Airbnb analytics for Newport, Rhode Island, United States to uncover income potential. This 2026 STR market report for Newport, based on AirROI data from February 2025 to January 2026, reveals key trends in the market of 680 active listings.
Whether you're considering an Airbnb investment in Newport, optimizing your existing vacation rental, or exploring rental arbitrage opportunities, understanding the Newport Airbnb data is crucial. Navigating the high regulation landscape is key to maximizing your short term rental income potential. Let's dive into the specifics.
Key Newport Airbnb Performance Metrics Overview
Monthly Airbnb Revenue Variations & Income Potential in Newport (2026)
Understanding the monthly revenue variations for Airbnb listings in Newport is key to maximizing your short term rental income potential. Seasonality significantly impacts earnings. Our analysis, based on data from the past 12 months, shows that the peak revenue month for STRs in Newport is typically August, while February often presents the lowest earnings, highlighting opportunities for strategic pricing adjustments during shoulder and low seasons. Explore the typical Airbnb income in Newport across different performance tiers:
- Best-in-class properties (Top 10%) achieve $10,487+ monthly, often utilizing dynamic pricing and superior guest experiences.
- Strong performing properties (Top 25%) earn $6,788 or more, indicating effective management and desirable locations/amenities.
- Typical properties (Median) generate around $4,162 per month, representing the average market performance.
- Entry-level properties (Bottom 25%) see earnings around $2,347, often with potential for optimization.
Average Monthly Airbnb Earnings Trend in Newport
Newport Airbnb Occupancy Rate Trends (2026)
Maximize your bookings by understanding the Newport STR occupancy trends. Seasonal demand shifts significantly influence how often properties are booked. Typically, Augustsees the highest demand (peak season occupancy), while January experiences the lowest (low season). Effective strategies, like adjusting minimum stays or offering promotions, can boost occupancy during slower periods. Here's how different property tiers perform in Newport:
- Best-in-class properties (Top 10%) achieve 74%+ occupancy, indicating high desirability and potentially optimized availability.
- Strong performing properties (Top 25%) maintain 58% or higher occupancy, suggesting good market fit and guest satisfaction.
- Typical properties (Median) have an occupancy rate around 39%.
- Entry-level properties (Bottom 25%) average 23% occupancy, potentially facing higher vacancy.
Average Monthly Occupancy Rate Trend in Newport
Average Daily Rate (ADR) Airbnb Trends in Newport (2026)
Effective short term rental pricing strategy in Newport involves understanding monthly ADR fluctuations. The Average Daily Rate (ADR) for Airbnb in Newport typically peaks in July and dips lowest during January. Leveraging Airbnb dynamic pricing tools or strategies based on this seasonality can significantly boost revenue. Here's a look at the typical nightly rates achieved:
- Best-in-class properties (Top 10%) command rates of $736+ per night, often due to premium features or locations.
- Strong performing properties (Top 25%) achieve nightly rates of $498 or more.
- Typical properties (Median) charge around $324 per night.
- Entry-level properties (Bottom 25%) earn around $216 per night.
Average Daily Rate (ADR) Trend by Month in Newport
Get Live Newport Market Intelligence 👇

Explore Real-time Analytics
Airbnb Seasonality Analysis & Trends in Newport (2026)
Peak Season (August, July, September)
- Revenue averages $9,179 per month
- Occupancy rates average 56.6%
- Daily rates average $462
Shoulder Season
- Revenue averages $5,067 per month
- Occupancy maintains around 40.7%
- Daily rates hold near $404
Low Season (January, February, March)
- Revenue drops to average $2,144 per month
- Occupancy decreases to average 25.3%
- Daily rates adjust to average $361
Seasonality Insights for Newport
- The Airbnb seasonality in Newport shows highly seasonal trends requiring careful strategy. While the sections above show seasonal averages, it's also insightful to look at the extremes:
- During the high season, the absolute peak month showcases Newport's highest earning potential, with monthly revenues capable of climbing to $9,936, occupancy reaching a high of 59.7%, and ADRs peaking at $471.
- Conversely, the slowest single month of the year, typically falling within the low season, marks the market's lowest point. In this month, revenue might dip to $1,770, occupancy could drop to 21.4%, and ADRs may adjust down to $357.
- Understanding both the seasonal averages and these monthly peaks and troughs in revenue, occupancy, and ADR is crucial for maximizing your Airbnb profit potential in Newport.
Seasonal Strategies for Maximizing Profit
- Peak Season: Maximize revenue through premium pricing and potentially longer minimum stays. Ensure high availability.
- Low Season: Offer competitive pricing, special promotions (e.g., extended stay discounts), and flexible cancellation policies. Target off-season travelers like remote workers or budget-conscious guests.
- Shoulder Seasons: Implement dynamic pricing that balances peak and low rates. Target weekend travelers or specific events. Offer slightly more flexible terms than peak season.
- Regularly analyze your own performance against these Newport seasonality benchmarks and adjust your pricing and availability strategy accordingly.
Best Areas for Airbnb Investment in Newport (2026)
Exploring the top neighborhoods for short-term rentals in Newport? This section highlights key areas, outlining why they are attractive for hosts and guests, along with notable local attractions. Consider these locations based on your target guest profile and investment strategy.
| Neighborhood / Area | Why Host Here? (Target Guests & Appeal) | Key Attractions & Landmarks |
|---|---|---|
| Thames Street | Historic street lined with shops, restaurants, and bars, right in the heart of downtown Newport. Ideal for tourists wanting to experience local culture and cuisine, especially during events and festivals. | Bowen's Wharf, The Jane Pickens Theater, Museum of Newport History, The Black Pearl, The Red Parrot |
| Cliff Walk | Famous scenic walkway along the coastline offering breathtaking views of the ocean and stunning mansions. Attracts nature lovers and tourists looking for beautiful views and a relaxing stroll. | Cliff Walk, The Breakers, Marble House, Fort Adams State Park, Easton Beach |
| Ocean Drive | A picturesque 10-mile scenic road offering some of the best ocean views and luxurious mansions of Newport. Popular for sightseeing, cycling, and enjoying the coastal breeze. | Bellevue Avenue Mansions, Brenton Point State Park, Gooseberry Beach, Fort Adams, Special Events at the Mansions |
| Bellevue Avenue | Known for its high-end shops and historic mansions, this area provides a luxurious experience and is close to many cultural attractions. | The Elms, Chateau-sur-Mer, Rosecliff, Newport Art Museum, International Tennis Hall of Fame |
| Newport Harbor | Central to the city's maritime history and summer sailing events, this area attracts boating enthusiasts and tourists looking for seaside activities. | Newport Harbor, Sail Newport, The Naval War College Museum, Regattas and sailing events, Restaurants with harbor views |
| Easton Beach | Family-friendly beach with facilities for swimming, sunbathing, and nearby attractions. Great for visitors looking for a beach day during their stay. | Easton Beach, The Carousel, Surfer's End, Nearby restaurants, Beach activities |
| Fort Adams | Historic fort offering tours and stunning views of the bay, popular for history buffs and those looking for unique experiences in Newport. | Fort Adams State Park, Annual Jazz & Folk Festivals, Scenic views of the harbor, Historic reenactments, Picnic areas |
| Castle Hill | A waterfront neighborhood with stunning views of Narragansett Bay. Ideal for upscale travelers looking for relaxation and luxury accommodations. | Castle Hill Lighthouse, Castle Hill Inn, Waterfront dining, Nature trails, Kayaking and sailing opportunities |
Understanding Airbnb License Requirements & STR Laws in Newport (2026)
Yes, Newport, Rhode Island, United States enforces high STR regulations. Obtaining a license and ensuring compliance is almost certainly required according to current 2026 STR laws. Always verify the latest short term rental regulations and Airbnb license requirements directly with local government authorities for Newport to ensure full compliance before hosting.
(Source: AirROI data, 2026, based on 79% licensed listings)
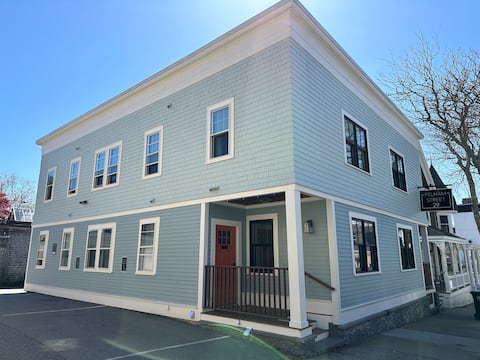
Top Performing Airbnb Properties in Newport (2026)
Benchmark your potential! Explore examples of top-performing Airbnb properties in Newportbased on Trailing Twelve Month (TTM) revenue. Analyze their characteristics, revenue, occupancy rate, and ADR to understand what drives success in this market.
Entire Modern 7 Unit 7 Bath Boutique Inn
Entire Place • 7 bedrooms

Former Fire Station on Thames Street Circa 1892
Entire Place • 6 bedrooms
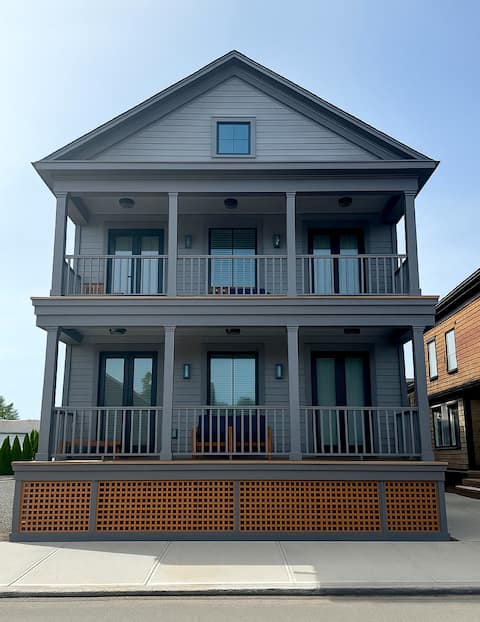
Brand New Construction! 3 Unit/5 Bed Property
Entire Place • 5 bedrooms
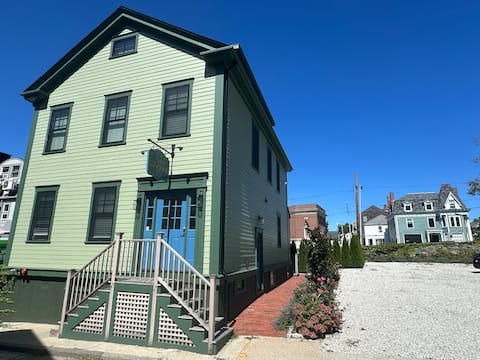
Prime Location! Renovated House! 6 bed/4 bath
Entire Place • 6 bedrooms

Elegant 6 Bedroom Penthouse on Thames
Entire Place • 6 bedrooms

86 Dr Marcus House - Popular Broadway Area
Entire Place • 6 bedrooms
Note: Performance varies based on location, size, amenities, seasonality, and management quality. Data reflects the past 12 months.
Top Performing Airbnb Hosts in Newport (2026)
Learn from the best! This table showcases top-performing Airbnb hosts in Newport based on the number of properties managed and estimated total revenue over the past year. Analyze their scale and performance metrics.
| Host Name | Properties | Grossing Revenue | Stay Reviews | Avg Rating |
|---|---|---|---|---|
| Matthew | 34 | $3,519,255 | 2984 | 4.89/5.0 |
| Chris | 24 | $2,100,949 | 1249 | 4.84/5.0 |
| Stay | 23 | $1,580,898 | 251 | 4.70/5.0 |
| Liliane | 18 | $802,986 | 2043 | 4.83/5.0 |
| Amanda | 14 | $781,389 | 2395 | 4.83/5.0 |
| Sandi | 13 | $635,994 | 1742 | 4.92/5.0 |
| Live Suite | 32 | $516,636 | 230 | 4.67/5.0 |
| Chris | 10 | $515,784 | 60 | 4.91/5.0 |
| Mark | 10 | $431,710 | 1390 | 4.94/5.0 |
| Jay | 5 | $416,339 | 1563 | 4.88/5.0 |
Analyzing the strategies of top hosts, such as their property selection, pricing, and guest communication, can offer valuable lessons for optimizing your own Airbnb operations in Newport.
Dive Deeper: Advanced Newport STR Market Data (2026)
Ready to unlock more insights? AirROI provides access to advanced metrics and comprehensive Airbnb data for Newport. Explore detailed analytics beyond this report to refine your investment strategy, optimize pricing, and maximize your vacation rental profits.
Explore Advanced MetricsNewport Short-Term Rental Market Composition (2026): Property & Room Types
Room Type Distribution
Property Type Distribution
Market Composition Insights for Newport
- The Newport Airbnb market composition is heavily skewed towards Entire Home/Apt listings, which make up 78.4% of the 680 active rentals. This indicates strong guest preference for privacy and space.
- Looking at the property type distribution in Newport, Apartment/Condo properties are the most common (59.7%), reflecting the local real estate landscape.
- Houses represent a significant 20.3% portion, catering likely to families or larger groups.
- The presence of 14.7% Hotel/Boutique listings indicates integration with traditional hospitality.
- Smaller segments like others, outdoor/unique (combined 5.3%) offer potential for unique stay experiences.
Newport Airbnb Room Capacity Analysis (2026): Bedroom Distribution
Distribution of Listings by Number of Bedrooms
Room Capacity Insights for Newport
- The dominant room capacity in Newport is 1 bedroom listings, making up 38.2% of the market. This suggests a strong demand for properties suitable for couples or solo travelers.
- Together, 1 bedroom and 2 bedrooms properties represent 72.9% of the active Airbnb listings in Newport, indicating a high concentration in these sizes.
Newport Vacation Rental Guest Capacity Trends (2026)
Distribution of Listings by Guest Capacity
Guest Capacity Insights for Newport
- The most common guest capacity trend in Newport vacation rentals is listings accommodating 4 guests (32.9%). This suggests the primary traveler segment is likely small families or groups.
- Properties designed for 4 guests and 2 guests dominate the Newport STR market, accounting for 53.9% of listings.
- 29.0% of properties accommodate 6+ guests, serving the market segment for larger families or group travel in Newport.
- On average, properties in Newport are equipped to host 4.1 guests.
Newport Airbnb Booking Patterns (2026): Available vs. Booked Days
Available Days Distribution
Booked Days Distribution
Booking Pattern Insights for Newport
- The most common availability pattern in Newport falls within the 271-366 days range, representing 50.1% of listings. This suggests many properties have significant open periods on their calendars.
- Approximately 86.9% of listings show high availability (181+ days open annually), indicating potential for increased bookings or specific owner usage patterns.
- For booked days, the 91-180 days range is most frequent in Newport (37.6%), reflecting common guest stay durations or potential owner blocking patterns.
- A notable 15.3% of properties secure long booking periods (181+ days booked per year), highlighting successful long-term rental strategies or significant owner usage.
Newport Airbnb Minimum Stay Requirements Analysis
Distribution of Listings by Minimum Night Requirement
1 Night
103 listings
15.1% of total
2 Nights
166 listings
24.4% of total
3 Nights
33 listings
4.9% of total
4-6 Nights
18 listings
2.6% of total
7-29 Nights
82 listings
12.1% of total
30+ Nights
278 listings
40.9% of total
Key Insights
- The most prevalent minimum stay requirement in Newport is 30+ Nights, adopted by 40.9% of listings. This highlights the market's preference for longer commitments.
- A significant segment (40.9%) caters to monthly stays (30+ nights) in Newport, pointing to opportunities in the extended-stay market.
Recommendations
- Align with the market by considering a 30+ Nights minimum stay, as 40.9% of Newport hosts use this setting.
- If feasible, allowing 1-night stays, especially midweek or during low season, could capture last-minute bookings, as only 15.1% currently do.
- Explore offering discounts for stays of 30+ nights to attract the 40.9% of the market seeking extended stays.
- Adjust minimum nights based on seasonality – potentially shorter during low season and longer during peak demand periods in Newport.
Newport Airbnb Cancellation Policy Trends Analysis (2026)
Refundable
5 listings
0.7% of total
Super Strict 60 Days
24 listings
3.5% of total
Limited
1 listings
0.1% of total
Super Strict 30 Days
34 listings
5% of total
Flexible
54 listings
8% of total
Moderate
88 listings
13% of total
Firm
219 listings
32.3% of total
Strict
252 listings
37.2% of total
Cancellation Policy Insights for Newport
- The prevailing Airbnb cancellation policy trend in Newport is Strict, used by 37.2% of listings.
- A majority (69.5%) of hosts in Newport utilize Firm or Strict policies, indicating a market where hosts prioritize booking security.
Recommendations for Hosts
- Consider adopting a Strict policy to align with the 37.2% market standard in Newport.
- With 37.2% using Strict terms, this is a viable option in Newport, particularly for high-value properties or during peak demand periods.
- Regularly review your cancellation policy against competitors and market demand shifts in Newport.
Newport STR Booking Lead Time Analysis (2026)
Average Booking Lead Time by Month
Booking Lead Time Insights for Newport
- The overall average booking lead time for vacation rentals in Newport is 75 days.
- Guests book furthest in advance for stays during July (average 103 days), likely coinciding with peak travel demand or local events.
- The shortest booking windows occur for stays in February (average 35 days), indicating more last-minute travel plans during this time.
- Seasonally, Summer (92 days avg.) sees the longest lead times, while Winter (47 days avg.) has the shortest, reflecting typical travel planning cycles.
Recommendations for Hosts
- Use the overall average lead time (75 days) as a baseline for your pricing and availability strategy in Newport.
- For July stays, consider implementing length-of-stay discounts or slightly higher rates for bookings made less than 103 days out to capitalize on advance planning.
- Target marketing efforts for the Summer season well in advance (at least 92 days) to capture early planners.
- Monitor your own booking lead times against these Newport averages to identify opportunities for dynamic pricing adjustments.
Popular & Essential Airbnb Amenities in Newport (2026)
Amenity Prevalence
Amenity Insights for Newport
- Essential amenities in Newport that guests expect include: Smoke alarm, Wifi, Air conditioning. Lacking these (any) could significantly impact bookings.
- Popular amenities like Heating, Carbon monoxide alarm, TV are common but not universal. Offering these can provide a competitive edge.
Recommendations for Hosts
- Ensure your listing includes all essential amenities for Newport: Smoke alarm, Wifi, Air conditioning.
- Prioritize adding missing essentials: Smoke alarm, Wifi, Air conditioning.
- Consider adding popular differentiators like Heating or Carbon monoxide alarm to increase appeal.
- Highlight unique or less common amenities you offer (e.g., hot tub, dedicated workspace, EV charger) in your listing description and photos.
- Regularly check competitor amenities in Newport to stay competitive.
Newport Airbnb Guest Demographics & Profile Analysis (2026)
Guest Profile Summary for Newport
- The typical guest profile for Airbnb in Newport consists of primarily domestic travelers (95%), often arriving from nearby New York, typically belonging to the Post-2000s (Gen Z/Alpha) group (50%), primarily speaking English or Spanish.
- Domestic travelers account for 95.4% of guests.
- Key international markets include United States (95.4%) and DC (1.3%).
- Top languages spoken are English (73.1%) followed by Spanish (10.3%).
- A significant demographic segment is the Post-2000s (Gen Z/Alpha) group, representing 50% of guests.
Recommendations for Hosts
- Target domestic marketing efforts towards travelers from New York and Boston.
- Tailor amenities and listing descriptions to appeal to the dominant Post-2000s (Gen Z/Alpha) demographic (e.g., highlight fast WiFi, smart home features, local guides).
- Highlight unique local experiences or amenities relevant to the primary guest profile.
- Consider seasonal promotions aligned with peak travel times for key origin markets.
Nearby Short-Term Rental Market Comparison
How does the Newport Airbnb market stack up against its neighbors? Compare key performance metrics like average monthly revenue, ADR, and occupancy rates in surrounding areas to understand the broader regional STR landscape.
| Market | Active Properties | Monthly Revenue | Daily Rate | Avg. Occupancy |
|---|---|---|---|---|
| Nantucket | 539 | $7,748 | $1045.40 | 41% |
| Sag Harbor | 15 | $6,129 | $1280.84 | 40% |
| Town of East Hampton | 1,327 | $5,945 | $986.02 | 36% |
| Middletown | 395 | $5,781 | $589.01 | 45% |
| North Andover | 12 | $5,625 | $440.84 | 45% |
| Town of Southampton | 1,201 | $5,620 | $1002.45 | 33% |
| Nahant | 13 | $5,564 | $602.44 | 42% |
| Southampton | 19 | $5,405 | $1456.43 | 30% |
| New Shoreham | 120 | $5,359 | $637.79 | 45% |
| Wellesley | 22 | $5,310 | $520.90 | 50% |