East Greenwich Airbnb Market Analysis 2026: Short Term Rental Data & Vacation Rental Statistics in Rhode Island, United States
Is Airbnb profitable in East Greenwich in 2026? Explore comprehensive Airbnb analytics for East Greenwich, Rhode Island, United States to uncover income potential. This 2026 STR market report for East Greenwich, based on AirROI data from February 2025 to January 2026, reveals key trends in the niche market of 26 active listings.
Whether you're considering an Airbnb investment in East Greenwich, optimizing your existing vacation rental, or exploring rental arbitrage opportunities, understanding the East Greenwich Airbnb data is crucial. Navigating the high regulation landscape is key to maximizing your short term rental income potential. Let's dive into the specifics.
Key East Greenwich Airbnb Performance Metrics Overview
Monthly Airbnb Revenue Variations & Income Potential in East Greenwich (2026)
Understanding the monthly revenue variations for Airbnb listings in East Greenwich is key to maximizing your short term rental income potential. Seasonality significantly impacts earnings. Our analysis, based on data from the past 12 months, shows that the peak revenue month for STRs in East Greenwich is typically July, while January often presents the lowest earnings, highlighting opportunities for strategic pricing adjustments during shoulder and low seasons. Explore the typical Airbnb income in East Greenwich across different performance tiers:
- Best-in-class properties (Top 10%) achieve $5,799+ monthly, often utilizing dynamic pricing and superior guest experiences.
- Strong performing properties (Top 25%) earn $4,292 or more, indicating effective management and desirable locations/amenities.
- Typical properties (Median) generate around $2,983 per month, representing the average market performance.
- Entry-level properties (Bottom 25%) see earnings around $2,047, often with potential for optimization.
Average Monthly Airbnb Earnings Trend in East Greenwich
East Greenwich Airbnb Occupancy Rate Trends (2026)
Maximize your bookings by understanding the East Greenwich STR occupancy trends. Seasonal demand shifts significantly influence how often properties are booked. Typically, Augustsees the highest demand (peak season occupancy), while January experiences the lowest (low season). Effective strategies, like adjusting minimum stays or offering promotions, can boost occupancy during slower periods. Here's how different property tiers perform in East Greenwich:
- Best-in-class properties (Top 10%) achieve 85%+ occupancy, indicating high desirability and potentially optimized availability.
- Strong performing properties (Top 25%) maintain 73% or higher occupancy, suggesting good market fit and guest satisfaction.
- Typical properties (Median) have an occupancy rate around 55%.
- Entry-level properties (Bottom 25%) average 36% occupancy, potentially facing higher vacancy.
Average Monthly Occupancy Rate Trend in East Greenwich
Average Daily Rate (ADR) Airbnb Trends in East Greenwich (2026)
Effective short term rental pricing strategy in East Greenwich involves understanding monthly ADR fluctuations. The Average Daily Rate (ADR) for Airbnb in East Greenwich typically peaks in July and dips lowest during February. Leveraging Airbnb dynamic pricing tools or strategies based on this seasonality can significantly boost revenue. Here's a look at the typical nightly rates achieved:
- Best-in-class properties (Top 10%) command rates of $342+ per night, often due to premium features or locations.
- Strong performing properties (Top 25%) achieve nightly rates of $271 or more.
- Typical properties (Median) charge around $181 per night.
- Entry-level properties (Bottom 25%) earn around $136 per night.
Average Daily Rate (ADR) Trend by Month in East Greenwich
Get Live East Greenwich Market Intelligence 👇

Explore Real-time Analytics
Airbnb Seasonality Analysis & Trends in East Greenwich (2026)
Peak Season (July, August, June)
- Revenue averages $5,693 per month
- Occupancy rates average 68.3%
- Daily rates average $273
Shoulder Season
- Revenue averages $3,181 per month
- Occupancy maintains around 52.9%
- Daily rates hold near $242
Low Season (January, February, April)
- Revenue drops to average $1,931 per month
- Occupancy decreases to average 43.4%
- Daily rates adjust to average $202
Seasonality Insights for East Greenwich
- The Airbnb seasonality in East Greenwich shows highly seasonal trends requiring careful strategy. While the sections above show seasonal averages, it's also insightful to look at the extremes:
- During the high season, the absolute peak month showcases East Greenwich's highest earning potential, with monthly revenues capable of climbing to $6,162, occupancy reaching a high of 74.1%, and ADRs peaking at $284.
- Conversely, the slowest single month of the year, typically falling within the low season, marks the market's lowest point. In this month, revenue might dip to $1,792, occupancy could drop to 34.9%, and ADRs may adjust down to $184.
- Understanding both the seasonal averages and these monthly peaks and troughs in revenue, occupancy, and ADR is crucial for maximizing your Airbnb profit potential in East Greenwich.
Seasonal Strategies for Maximizing Profit
- Peak Season: Maximize revenue through premium pricing and potentially longer minimum stays. Ensure high availability.
- Low Season: Offer competitive pricing, special promotions (e.g., extended stay discounts), and flexible cancellation policies. Target off-season travelers like remote workers or budget-conscious guests.
- Shoulder Seasons: Implement dynamic pricing that balances peak and low rates. Target weekend travelers or specific events. Offer slightly more flexible terms than peak season.
- Regularly analyze your own performance against these East Greenwich seasonality benchmarks and adjust your pricing and availability strategy accordingly.
Best Areas for Airbnb Investment in East Greenwich (2026)
Exploring the top neighborhoods for short-term rentals in East Greenwich? This section highlights key areas, outlining why they are attractive for hosts and guests, along with notable local attractions. Consider these locations based on your target guest profile and investment strategy.
| Neighborhood / Area | Why Host Here? (Target Guests & Appeal) | Key Attractions & Landmarks |
|---|---|---|
| East Greenwich Historic District | Charming area known for its historic architecture and quaint shops. Attracts visitors looking for a unique New England experience with a small-town feel. | Hatsune Japanese Restaurant, East Greenwich Town Beach, Old Academy Building, East Greenwich Golf Club |
| Goddard Memorial State Park | A large park offering natural beauty with walking trails, beach access, and recreational activities. Popular for families and outdoor enthusiasts. | Goddard Park Beach, Nature trails, Horseback riding, Picnic areas |
| Main Street | The vibrant heart of East Greenwich featuring local boutiques, restaurants, and cafes. A hotspot for foodies and shopping enthusiasts. | Siena Restaurant, Goddard Park, The Village Hearth Bakery Cafe, Various local shops |
| Eagle Point | A picturesque waterfront neighborhood with stunning views of the bay, ideal for visitors wanting tranquility and nature. | Eagle Point Beach, Waterfront parks, Scenic picnic spots |
| Cranston | Adjacent to East Greenwich, this city offers more urban amenities and attractions close by, appealing to a broad range of visitors. | Garden City Center, Cranston's parks and recreational areas, Shopping and dining options |
| Warwick | Only a short drive away; known for its larger shopping areas and easy access to beaches, making it appealing for broader tourist demographics. | Warwick City Park, Plaine Memorial Park, Crowne Plaza Hotel Beach |
| Jamestown | Nearby island offering stunning views, outdoor activities, and natural scenery, perfect for those wanting a getaway feel. | Jamestown Windmill, Fort Wetherill State Park, Beaches, Boating and fishing |
| Narragansett | Located a bit further but renowned for its beaches and nightlife scene; ideal for summer vacationers and beach lovers. | Narragansett Town Beach, Galilee, Scarborough State Beach, Restaurants and nightlife |
Understanding Airbnb License Requirements & STR Laws in East Greenwich (2026)
Yes, East Greenwich, Rhode Island, United States enforces high STR regulations. Obtaining a license and ensuring compliance is almost certainly required according to current 2026 STR laws. Always verify the latest short term rental regulations and Airbnb license requirements directly with local government authorities for East Greenwich to ensure full compliance before hosting.
(Source: AirROI data, 2026, based on 96% licensed listings)
Top Performing Airbnb Properties in East Greenwich (2026)
Benchmark your potential! Explore examples of top-performing Airbnb properties in East Greenwichbased on Trailing Twelve Month (TTM) revenue. Analyze their characteristics, revenue, occupancy rate, and ADR to understand what drives success in this market.

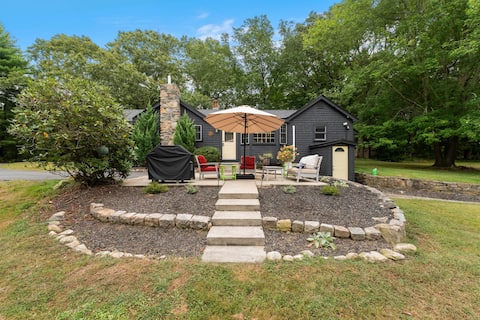
1 Acre, Central Air, Fire Pit, Fenced Yard, Patio
Entire Place • 3 bedrooms
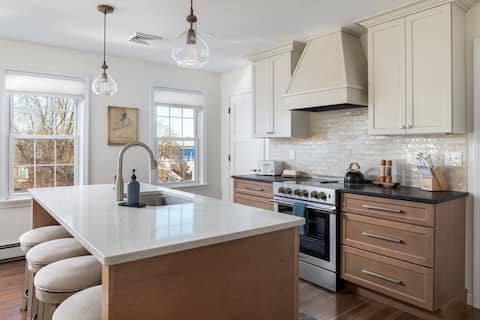
Castle St Retreat - Walk to Town
Entire Place • 3 bedrooms
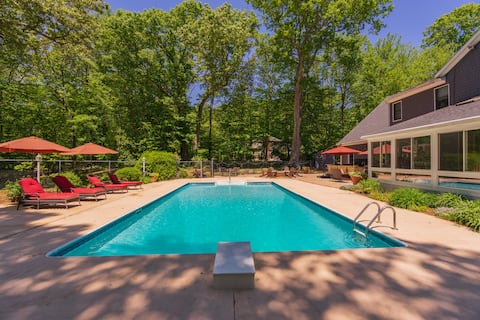
Fire Pit Patio & Pool Retreat in East Greenwich
Entire Place • 4 bedrooms
Peaceful Oasis
Entire Place • 3 bedrooms

Quarters on Castle - Walk to Water and Main Street
Entire Place • 2 bedrooms

3 Bdrm Townhome Steps from Main St & EG Waterfront
Entire Place • 3 bedrooms
Note: Performance varies based on location, size, amenities, seasonality, and management quality. Data reflects the past 12 months.
Top Performing Airbnb Hosts in East Greenwich (2026)
Learn from the best! This table showcases top-performing Airbnb hosts in East Greenwich based on the number of properties managed and estimated total revenue over the past year. Analyze their scale and performance metrics.
| Host Name | Properties | Grossing Revenue | Stay Reviews | Avg Rating |
|---|---|---|---|---|
| Sarah | 8 | $258,064 | 952 | 4.89/5.0 |
| Scott | 4 | $146,993 | 143 | 4.80/5.0 |
| Matthew | 2 | $113,467 | 200 | 4.88/5.0 |
| Tyler | 1 | $80,754 | 50 | 4.64/5.0 |
| Air Hostd | 1 | $65,285 | 32 | 4.53/5.0 |
| Jennifer | 1 | $57,110 | 35 | 5.00/5.0 |
| Brendan | 2 | $43,473 | 97 | 4.76/5.0 |
| Prutha | 1 | $34,676 | 124 | 4.85/5.0 |
| Kim | 1 | $34,090 | 74 | 4.99/5.0 |
| Ian | 1 | $31,324 | 24 | 4.92/5.0 |
Analyzing the strategies of top hosts, such as their property selection, pricing, and guest communication, can offer valuable lessons for optimizing your own Airbnb operations in East Greenwich.
Dive Deeper: Advanced East Greenwich STR Market Data (2026)
Ready to unlock more insights? AirROI provides access to advanced metrics and comprehensive Airbnb data for East Greenwich. Explore detailed analytics beyond this report to refine your investment strategy, optimize pricing, and maximize your vacation rental profits.
Explore Advanced MetricsEast Greenwich Short-Term Rental Market Composition (2026): Property & Room Types
Room Type Distribution
Property Type Distribution
Market Composition Insights for East Greenwich
- The East Greenwich Airbnb market composition is heavily skewed towards Entire Home/Apt listings, which make up 100% of the 26 active rentals. This indicates strong guest preference for privacy and space.
- Looking at the property type distribution in East Greenwich, Apartment/Condo properties are the most common (57.7%), reflecting the local real estate landscape.
- Houses represent a significant 38.5% portion, catering likely to families or larger groups.
- Smaller segments like hotel/boutique (combined 3.8%) offer potential for unique stay experiences.
East Greenwich Airbnb Room Capacity Analysis (2026): Bedroom Distribution
Distribution of Listings by Number of Bedrooms
Room Capacity Insights for East Greenwich
- The dominant room capacity in East Greenwich is 1 bedroom listings, making up 50% of the market. This suggests a strong demand for properties suitable for couples or solo travelers.
- Together, 1 bedroom and 2 bedrooms properties represent 73.1% of the active Airbnb listings in East Greenwich, indicating a high concentration in these sizes.
- A significant 26.9% of listings offer 3+ bedrooms, catering to larger groups and families seeking more space in East Greenwich.
East Greenwich Vacation Rental Guest Capacity Trends (2026)
Distribution of Listings by Guest Capacity
Guest Capacity Insights for East Greenwich
- The most common guest capacity trend in East Greenwich vacation rentals is listings accommodating 4 guests (30.8%). This suggests the primary traveler segment is likely small families or groups.
- Properties designed for 4 guests and 2 guests dominate the East Greenwich STR market, accounting for 53.9% of listings.
- 34.6% of properties accommodate 6+ guests, serving the market segment for larger families or group travel in East Greenwich.
- On average, properties in East Greenwich are equipped to host 4.5 guests.
East Greenwich Airbnb Booking Patterns (2026): Available vs. Booked Days
Available Days Distribution
Booked Days Distribution
Booking Pattern Insights for East Greenwich
- The most common availability pattern in East Greenwich falls within the 91-180 days range, representing 50% of listings. This suggests many properties have significant open periods on their calendars.
- Approximately 46.1% of listings show high availability (181+ days open annually), indicating potential for increased bookings or specific owner usage patterns.
- For booked days, the 181-270 days range is most frequent in East Greenwich (50%), reflecting common guest stay durations or potential owner blocking patterns.
- A notable 53.8% of properties secure long booking periods (181+ days booked per year), highlighting successful long-term rental strategies or significant owner usage.
East Greenwich Airbnb Minimum Stay Requirements Analysis
Distribution of Listings by Minimum Night Requirement
1 Night
1 listings
3.8% of total
2 Nights
5 listings
19.2% of total
3 Nights
8 listings
30.8% of total
4-6 Nights
1 listings
3.8% of total
7-29 Nights
2 listings
7.7% of total
30+ Nights
9 listings
34.6% of total
Key Insights
- The most prevalent minimum stay requirement in East Greenwich is 30+ Nights, adopted by 34.6% of listings. This highlights the market's preference for longer commitments.
- A significant segment (34.6%) caters to monthly stays (30+ nights) in East Greenwich, pointing to opportunities in the extended-stay market.
Recommendations
- Align with the market by considering a 30+ Nights minimum stay, as 34.6% of East Greenwich hosts use this setting.
- If feasible, allowing 1-night stays, especially midweek or during low season, could capture last-minute bookings, as only 3.8% currently do.
- Explore offering discounts for stays of 30+ nights to attract the 34.6% of the market seeking extended stays.
- Adjust minimum nights based on seasonality – potentially shorter during low season and longer during peak demand periods in East Greenwich.
East Greenwich Airbnb Cancellation Policy Trends Analysis (2026)
Limited
1 listings
3.8% of total
Flexible
1 listings
3.8% of total
Moderate
4 listings
15.4% of total
Firm
11 listings
42.3% of total
Strict
9 listings
34.6% of total
Cancellation Policy Insights for East Greenwich
- The prevailing Airbnb cancellation policy trend in East Greenwich is Firm, used by 42.3% of listings.
- A majority (76.9%) of hosts in East Greenwich utilize Firm or Strict policies, indicating a market where hosts prioritize booking security.
Recommendations for Hosts
- Consider adopting a Firm policy to align with the 42.3% market standard in East Greenwich.
- With 34.6% using Strict terms, this is a viable option in East Greenwich, particularly for high-value properties or during peak demand periods.
- Regularly review your cancellation policy against competitors and market demand shifts in East Greenwich.
East Greenwich STR Booking Lead Time Analysis (2026)
Average Booking Lead Time by Month
Booking Lead Time Insights for East Greenwich
- The overall average booking lead time for vacation rentals in East Greenwich is 49 days.
- Guests book furthest in advance for stays during July (average 70 days), likely coinciding with peak travel demand or local events.
- The shortest booking windows occur for stays in February (average 9 days), indicating more last-minute travel plans during this time.
- Seasonally, Summer (62 days avg.) sees the longest lead times, while Winter (38 days avg.) has the shortest, reflecting typical travel planning cycles.
Recommendations for Hosts
- Use the overall average lead time (49 days) as a baseline for your pricing and availability strategy in East Greenwich.
- For July stays, consider implementing length-of-stay discounts or slightly higher rates for bookings made less than 70 days out to capitalize on advance planning.
- During February, focus on last-minute booking availability and promotions, as guests book with very short notice (9 days avg.).
- Target marketing efforts for the Summer season well in advance (at least 62 days) to capture early planners.
- Monitor your own booking lead times against these East Greenwich averages to identify opportunities for dynamic pricing adjustments.
Popular & Essential Airbnb Amenities in East Greenwich (2026)
Amenity Prevalence
Amenity Insights for East Greenwich
- Essential amenities in East Greenwich that guests expect include: Heating, Kitchen, Smoke alarm, Carbon monoxide alarm, Wifi, Air conditioning, TV, Refrigerator, Coffee maker, Dishes and silverware. Lacking these (any) could significantly impact bookings.
Recommendations for Hosts
- Ensure your listing includes all essential amenities for East Greenwich: Heating, Kitchen, Smoke alarm, Carbon monoxide alarm, Wifi, Air conditioning, TV, Refrigerator, Coffee maker, Dishes and silverware.
- Prioritize adding missing essentials: Refrigerator, Coffee maker, Dishes and silverware.
- Highlight unique or less common amenities you offer (e.g., hot tub, dedicated workspace, EV charger) in your listing description and photos.
- Regularly check competitor amenities in East Greenwich to stay competitive.
East Greenwich Airbnb Guest Demographics & Profile Analysis (2026)
Guest Profile Summary for East Greenwich
- The typical guest profile for Airbnb in East Greenwich consists of primarily domestic travelers (95%), often arriving from nearby New York, typically belonging to the Post-2000s (Gen Z/Alpha) group (50%), primarily speaking English or Spanish.
- Domestic travelers account for 94.6% of guests.
- Key international markets include United States (94.6%) and DC (1.6%).
- Top languages spoken are English (69.1%) followed by Spanish (14%).
- A significant demographic segment is the Post-2000s (Gen Z/Alpha) group, representing 50% of guests.
Recommendations for Hosts
- Target domestic marketing efforts towards travelers from New York and Los Angeles.
- Tailor amenities and listing descriptions to appeal to the dominant Post-2000s (Gen Z/Alpha) demographic (e.g., highlight fast WiFi, smart home features, local guides).
- Highlight unique local experiences or amenities relevant to the primary guest profile.
- Consider seasonal promotions aligned with peak travel times for key origin markets.
Nearby Short-Term Rental Market Comparison
How does the East Greenwich Airbnb market stack up against its neighbors? Compare key performance metrics like average monthly revenue, ADR, and occupancy rates in surrounding areas to understand the broader regional STR landscape.
| Market | Active Properties | Monthly Revenue | Daily Rate | Avg. Occupancy |
|---|---|---|---|---|
| Nantucket | 539 | $7,748 | $1045.40 | 41% |
| Sag Harbor | 15 | $6,129 | $1280.84 | 40% |
| Town of East Hampton | 1,327 | $5,945 | $986.02 | 36% |
| Middletown | 395 | $5,781 | $589.01 | 45% |
| North Andover | 12 | $5,625 | $440.84 | 45% |
| Town of Southampton | 1,201 | $5,620 | $1002.45 | 33% |
| Nahant | 13 | $5,564 | $602.44 | 42% |
| Southampton | 19 | $5,405 | $1456.43 | 30% |
| New Shoreham | 120 | $5,359 | $637.79 | 45% |
| Wellesley | 22 | $5,310 | $520.90 | 50% |