Charlestown Airbnb Market Analysis 2026: Short Term Rental Data & Vacation Rental Statistics in Rhode Island, United States
Is Airbnb profitable in Charlestown in 2026? Explore comprehensive Airbnb analytics for Charlestown, Rhode Island, United States to uncover income potential. This 2026 STR market report for Charlestown, based on AirROI data from February 2025 to January 2026, reveals key trends in the niche market of 77 active listings.
Whether you're considering an Airbnb investment in Charlestown, optimizing your existing vacation rental, or exploring rental arbitrage opportunities, understanding the Charlestown Airbnb data is crucial. Navigating the high regulation landscape is key to maximizing your short term rental income potential. Let's dive into the specifics.
Key Charlestown Airbnb Performance Metrics Overview
Monthly Airbnb Revenue Variations & Income Potential in Charlestown (2026)
Understanding the monthly revenue variations for Airbnb listings in Charlestown is key to maximizing your short term rental income potential. Seasonality significantly impacts earnings. Our analysis, based on data from the past 12 months, shows that the peak revenue month for STRs in Charlestown is typically August, while January often presents the lowest earnings, highlighting opportunities for strategic pricing adjustments during shoulder and low seasons. Explore the typical Airbnb income in Charlestown across different performance tiers:
- Best-in-class properties (Top 10%) achieve $10,340+ monthly, often utilizing dynamic pricing and superior guest experiences.
- Strong performing properties (Top 25%) earn $7,094 or more, indicating effective management and desirable locations/amenities.
- Typical properties (Median) generate around $4,261 per month, representing the average market performance.
- Entry-level properties (Bottom 25%) see earnings around $2,382, often with potential for optimization.
Average Monthly Airbnb Earnings Trend in Charlestown
Charlestown Airbnb Occupancy Rate Trends (2026)
Maximize your bookings by understanding the Charlestown STR occupancy trends. Seasonal demand shifts significantly influence how often properties are booked. Typically, Augustsees the highest demand (peak season occupancy), while January experiences the lowest (low season). Effective strategies, like adjusting minimum stays or offering promotions, can boost occupancy during slower periods. Here's how different property tiers perform in Charlestown:
- Best-in-class properties (Top 10%) achieve 74%+ occupancy, indicating high desirability and potentially optimized availability.
- Strong performing properties (Top 25%) maintain 58% or higher occupancy, suggesting good market fit and guest satisfaction.
- Typical properties (Median) have an occupancy rate around 39%.
- Entry-level properties (Bottom 25%) average 23% occupancy, potentially facing higher vacancy.
Average Monthly Occupancy Rate Trend in Charlestown
Average Daily Rate (ADR) Airbnb Trends in Charlestown (2026)
Effective short term rental pricing strategy in Charlestown involves understanding monthly ADR fluctuations. The Average Daily Rate (ADR) for Airbnb in Charlestown typically peaks in September and dips lowest during February. Leveraging Airbnb dynamic pricing tools or strategies based on this seasonality can significantly boost revenue. Here's a look at the typical nightly rates achieved:
- Best-in-class properties (Top 10%) command rates of $711+ per night, often due to premium features or locations.
- Strong performing properties (Top 25%) achieve nightly rates of $471 or more.
- Typical properties (Median) charge around $341 per night.
- Entry-level properties (Bottom 25%) earn around $254 per night.
Average Daily Rate (ADR) Trend by Month in Charlestown
Get Live Charlestown Market Intelligence 👇

Explore Real-time Analytics
Airbnb Seasonality Analysis & Trends in Charlestown (2026)
Peak Season (August, July, September)
- Revenue averages $9,228 per month
- Occupancy rates average 65.2%
- Daily rates average $436
Shoulder Season
- Revenue averages $4,835 per month
- Occupancy maintains around 37.9%
- Daily rates hold near $415
Low Season (January, February, March)
- Revenue drops to average $2,368 per month
- Occupancy decreases to average 24.8%
- Daily rates adjust to average $398
Seasonality Insights for Charlestown
- The Airbnb seasonality in Charlestown shows highly seasonal trends requiring careful strategy. While the sections above show seasonal averages, it's also insightful to look at the extremes:
- During the high season, the absolute peak month showcases Charlestown's highest earning potential, with monthly revenues capable of climbing to $10,407, occupancy reaching a high of 73.6%, and ADRs peaking at $437.
- Conversely, the slowest single month of the year, typically falling within the low season, marks the market's lowest point. In this month, revenue might dip to $1,964, occupancy could drop to 14.9%, and ADRs may adjust down to $385.
- Understanding both the seasonal averages and these monthly peaks and troughs in revenue, occupancy, and ADR is crucial for maximizing your Airbnb profit potential in Charlestown.
Seasonal Strategies for Maximizing Profit
- Peak Season: Maximize revenue through premium pricing and potentially longer minimum stays. Ensure high availability.
- Low Season: Offer competitive pricing, special promotions (e.g., extended stay discounts), and flexible cancellation policies. Target off-season travelers like remote workers or budget-conscious guests.
- Shoulder Seasons: Implement dynamic pricing that balances peak and low rates. Target weekend travelers or specific events. Offer slightly more flexible terms than peak season.
- Regularly analyze your own performance against these Charlestown seasonality benchmarks and adjust your pricing and availability strategy accordingly.
Best Areas for Airbnb Investment in Charlestown (2026)
Exploring the top neighborhoods for short-term rentals in Charlestown? This section highlights key areas, outlining why they are attractive for hosts and guests, along with notable local attractions. Consider these locations based on your target guest profile and investment strategy.
| Neighborhood / Area | Why Host Here? (Target Guests & Appeal) | Key Attractions & Landmarks |
|---|---|---|
| East Beach | A serene and picturesque beach area that attracts families and those looking for a relaxing getaway. Close proximity to the beach and nature trails makes it a desirable location for tourists. | East Beach, Charlestown Town Beach, Ninigret Pond, Ninigret National Wildlife Refuge, Charlestown Breachway |
| West Beach | Known for its stunning sunsets and tranquil environment, West Beach is perfect for those wanting a peaceful retreat. Nearby shops and cafes provide convenience for guests. | West Beach, Charlestown Beach, Blue Shutters Beach, Route 1 Open Market, The Breachway Grill |
| Sandy Point Beach | A hidden gem that offers a more secluded beach experience. Ideal for travelers seeking quiet and beautiful coastal views away from the more crowded beaches. | Sandy Point Beach, Ninigret Park, Fishing and boating opportunities, Wildlife viewing, Scenic picnic areas |
| Charlestown Village | The rustic charm of Charlestown Village attracts tourists who appreciate local history and culture. Proximity to shops and restaurants makes it a convenient choice. | Historic Charlestown, Local artist galleries, Charlestown Library, The Methodist Meeting House, Nearby farms and markets |
| Ninigret Pond | A popular spot for water-related activities, Ninigret Pond provides adventure options for water sports lovers. The surrounding nature trails attract nature enthusiasts. | Ninigret Pond, Kayaking and paddleboarding, Bird watching, Walking trails, Ninigret National Wildlife Refuge |
| Matunuck | Close to the surf and vibrant beach life, Matunuck is great for beachgoers and those who enjoy seafood restaurants and nightlife. Offers a lively beach experience. | Matunuck Beach, Matunuck Oyster Bar, Surf shops and rentals, Local live music venues, Nearby parks |
| Block Island Ferry Terminal | A convenient location for travelers heading to Block Island. Offers a lively atmosphere with ferry services, making it a popular choice for transient guests. | Block Island Ferry, Harbor views, Dining options nearby, Water activities, Local tourism offices |
| The Nature Conservancy's Ninigret | A beautiful natural area that attracts eco-tourists and those interested in hiking and outdoor activities. A unique selling point for nature-focused Airbnb experiences. | Nature trails, Wildlife watching, Educational programs, Land and water conservation areas, Scenic landscapes |
Understanding Airbnb License Requirements & STR Laws in Charlestown (2026)
Yes, Charlestown, Rhode Island, United States enforces high STR regulations. Obtaining a license and ensuring compliance is almost certainly required according to current 2026 STR laws. Always verify the latest short term rental regulations and Airbnb license requirements directly with local government authorities for Charlestown to ensure full compliance before hosting.
(Source: AirROI data, 2026, based on 90% licensed listings)
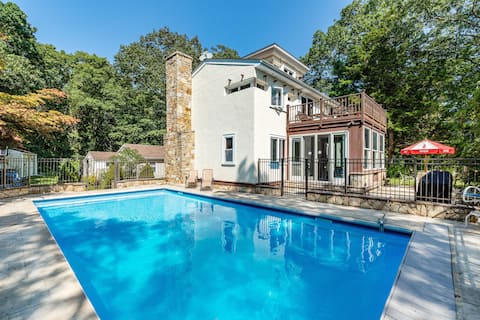
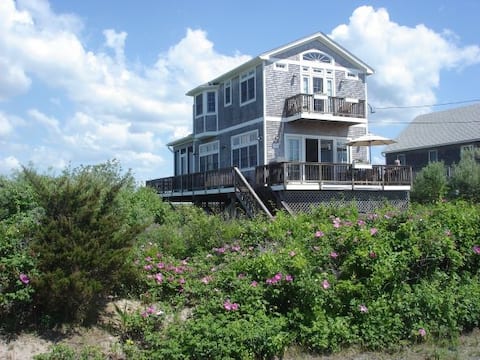
Top Performing Airbnb Properties in Charlestown (2026)
Benchmark your potential! Explore examples of top-performing Airbnb properties in Charlestownbased on Trailing Twelve Month (TTM) revenue. Analyze their characteristics, revenue, occupancy rate, and ADR to understand what drives success in this market.
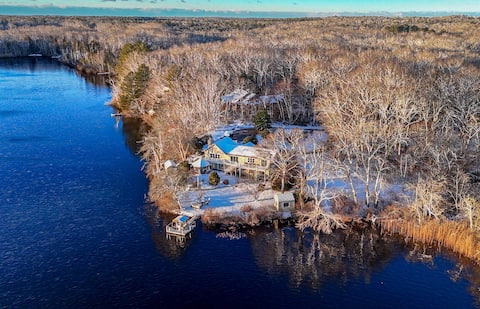
2 Acre Lakefront Getaway (Sauna/Firepit/Kayaks)
Entire Place • 4 bedrooms

Surf House - Charlestown Beach
Entire Place • 6 bedrooms

Pet-Friendly Private Beach Oceanfront Cottage A/C
Entire Place • 3 bedrooms
The Bunker
Entire Place • 5 bedrooms
Oceanfront Beachhouse-Stunning Views, WiFi, A/C
Entire Place • 2 bedrooms

Spacious RI Beach Escape
Entire Place • 3 bedrooms
Note: Performance varies based on location, size, amenities, seasonality, and management quality. Data reflects the past 12 months.
Top Performing Airbnb Hosts in Charlestown (2026)
Learn from the best! This table showcases top-performing Airbnb hosts in Charlestown based on the number of properties managed and estimated total revenue over the past year. Analyze their scale and performance metrics.
| Host Name | Properties | Grossing Revenue | Stay Reviews | Avg Rating |
|---|---|---|---|---|
| Daniela | 1 | $165,744 | 88 | 4.99/5.0 |
| Brendan | 1 | $150,002 | 17 | 5.00/5.0 |
| Elizabeth Anne | 1 | $135,843 | 187 | 4.91/5.0 |
| Alberto | 1 | $134,652 | 9 | 4.67/5.0 |
| Geo | 1 | $120,628 | 25 | 4.96/5.0 |
| Pamela | 1 | $115,594 | 191 | 4.90/5.0 |
| Melissa | 1 | $112,269 | 23 | 5.00/5.0 |
| Alyssa | 1 | $76,773 | 43 | 4.95/5.0 |
| Celine | 1 | $75,439 | 28 | 4.96/5.0 |
| Steven | 1 | $74,557 | 12 | 4.92/5.0 |
Analyzing the strategies of top hosts, such as their property selection, pricing, and guest communication, can offer valuable lessons for optimizing your own Airbnb operations in Charlestown.
Dive Deeper: Advanced Charlestown STR Market Data (2026)
Ready to unlock more insights? AirROI provides access to advanced metrics and comprehensive Airbnb data for Charlestown. Explore detailed analytics beyond this report to refine your investment strategy, optimize pricing, and maximize your vacation rental profits.
Explore Advanced MetricsCharlestown Short-Term Rental Market Composition (2026): Property & Room Types
Room Type Distribution
Property Type Distribution
Market Composition Insights for Charlestown
- The Charlestown Airbnb market composition is heavily skewed towards Entire Home/Apt listings, which make up 96.1% of the 77 active rentals. This indicates strong guest preference for privacy and space.
- Looking at the property type distribution in Charlestown, House properties are the most common (83.1%), reflecting the local real estate landscape.
- Houses represent a significant 83.1% portion, catering likely to families or larger groups.
- The presence of 5.2% Hotel/Boutique listings indicates integration with traditional hospitality.
- Smaller segments like apartment/condo, outdoor/unique (combined 5.2%) offer potential for unique stay experiences.
Charlestown Airbnb Room Capacity Analysis (2026): Bedroom Distribution
Distribution of Listings by Number of Bedrooms
Room Capacity Insights for Charlestown
- The dominant room capacity in Charlestown is 3 bedrooms listings, making up 49.4% of the market. This suggests a strong demand for properties suitable for families or small groups.
- Together, 3 bedrooms and 2 bedrooms properties represent 65.0% of the active Airbnb listings in Charlestown, indicating a high concentration in these sizes.
- A significant 66.3% of listings offer 3+ bedrooms, catering to larger groups and families seeking more space in Charlestown.
Charlestown Vacation Rental Guest Capacity Trends (2026)
Distribution of Listings by Guest Capacity
Guest Capacity Insights for Charlestown
- The most common guest capacity trend in Charlestown vacation rentals is listings accommodating 8+ guests (32.5%). This suggests the primary traveler segment is likely larger groups.
- Properties designed for 8+ guests and 6 guests dominate the Charlestown STR market, accounting for 61.1% of listings.
- 66.3% of properties accommodate 6+ guests, serving the market segment for larger families or group travel in Charlestown.
- On average, properties in Charlestown are equipped to host 5.8 guests.
Charlestown Airbnb Booking Patterns (2026): Available vs. Booked Days
Available Days Distribution
Booked Days Distribution
Booking Pattern Insights for Charlestown
- The most common availability pattern in Charlestown falls within the 181-270 days range, representing 45.5% of listings. This suggests many properties have significant open periods on their calendars.
- Approximately 88.4% of listings show high availability (181+ days open annually), indicating potential for increased bookings or specific owner usage patterns.
- For booked days, the 91-180 days range is most frequent in Charlestown (46.8%), reflecting common guest stay durations or potential owner blocking patterns.
- A notable 13.0% of properties secure long booking periods (181+ days booked per year), highlighting successful long-term rental strategies or significant owner usage.
Charlestown Airbnb Minimum Stay Requirements Analysis
Distribution of Listings by Minimum Night Requirement
1 Night
2 listings
2.6% of total
2 Nights
11 listings
14.3% of total
3 Nights
14 listings
18.2% of total
4-6 Nights
18 listings
23.4% of total
7-29 Nights
9 listings
11.7% of total
30+ Nights
23 listings
29.9% of total
Key Insights
- The most prevalent minimum stay requirement in Charlestown is 30+ Nights, adopted by 29.9% of listings. This highlights the market's preference for longer commitments.
- Very short stays (1-2 nights) are less common (16.9%), suggesting hosts prefer slightly longer bookings to optimize turnover.
- A significant segment (29.9%) caters to monthly stays (30+ nights) in Charlestown, pointing to opportunities in the extended-stay market.
Recommendations
- Align with the market by considering a 30+ Nights minimum stay, as 29.9% of Charlestown hosts use this setting.
- If feasible, allowing 1-night stays, especially midweek or during low season, could capture last-minute bookings, as only 2.6% currently do.
- Explore offering discounts for stays of 30+ nights to attract the 29.9% of the market seeking extended stays.
- Adjust minimum nights based on seasonality – potentially shorter during low season and longer during peak demand periods in Charlestown.
Charlestown Airbnb Cancellation Policy Trends Analysis (2026)
Super Strict 60 Days
1 listings
1.3% of total
Flexible
9 listings
11.7% of total
Moderate
12 listings
15.6% of total
Firm
37 listings
48.1% of total
Strict
18 listings
23.4% of total
Cancellation Policy Insights for Charlestown
- The prevailing Airbnb cancellation policy trend in Charlestown is Firm, used by 48.1% of listings.
- A majority (71.5%) of hosts in Charlestown utilize Firm or Strict policies, indicating a market where hosts prioritize booking security.
Recommendations for Hosts
- Consider adopting a Firm policy to align with the 48.1% market standard in Charlestown.
- Regularly review your cancellation policy against competitors and market demand shifts in Charlestown.
Charlestown STR Booking Lead Time Analysis (2026)
Average Booking Lead Time by Month
Booking Lead Time Insights for Charlestown
- The overall average booking lead time for vacation rentals in Charlestown is 85 days.
- Guests book furthest in advance for stays during August (average 130 days), likely coinciding with peak travel demand or local events.
- The shortest booking windows occur for stays in February (average 17 days), indicating more last-minute travel plans during this time.
- Seasonally, Summer (118 days avg.) sees the longest lead times, while Winter (34 days avg.) has the shortest, reflecting typical travel planning cycles.
Recommendations for Hosts
- Use the overall average lead time (85 days) as a baseline for your pricing and availability strategy in Charlestown.
- For August stays, consider implementing length-of-stay discounts or slightly higher rates for bookings made less than 130 days out to capitalize on advance planning.
- Target marketing efforts for the Summer season well in advance (at least 118 days) to capture early planners.
- Monitor your own booking lead times against these Charlestown averages to identify opportunities for dynamic pricing adjustments.
Popular & Essential Airbnb Amenities in Charlestown (2026)
Amenity Prevalence
Amenity Insights for Charlestown
- Essential amenities in Charlestown that guests expect include: Free parking on premises, Smoke alarm, Wifi, TV. Lacking these (any) could significantly impact bookings.
- Popular amenities like Dishes and silverware, Carbon monoxide alarm, Kitchen are common but not universal. Offering these can provide a competitive edge.
Recommendations for Hosts
- Ensure your listing includes all essential amenities for Charlestown: Free parking on premises, Smoke alarm, Wifi, TV.
- Prioritize adding missing essentials: Smoke alarm, Wifi, TV.
- Consider adding popular differentiators like Dishes and silverware or Carbon monoxide alarm to increase appeal.
- Highlight unique or less common amenities you offer (e.g., hot tub, dedicated workspace, EV charger) in your listing description and photos.
- Regularly check competitor amenities in Charlestown to stay competitive.
Charlestown Airbnb Guest Demographics & Profile Analysis (2026)
Guest Profile Summary for Charlestown
- The typical guest profile for Airbnb in Charlestown consists of primarily domestic travelers (97%), often arriving from nearby New York, typically belonging to the Post-2000s (Gen Z/Alpha) group (50%), primarily speaking English or Spanish.
- Domestic travelers account for 97.2% of guests.
- Key international markets include United States (97.2%) and DC (1.3%).
- Top languages spoken are English (75%) followed by Spanish (12.2%).
- A significant demographic segment is the Post-2000s (Gen Z/Alpha) group, representing 50% of guests.
Recommendations for Hosts
- Target domestic marketing efforts towards travelers from New York and Providence.
- Tailor amenities and listing descriptions to appeal to the dominant Post-2000s (Gen Z/Alpha) demographic (e.g., highlight fast WiFi, smart home features, local guides).
- Highlight unique local experiences or amenities relevant to the primary guest profile.
- Consider seasonal promotions aligned with peak travel times for key origin markets.
Nearby Short-Term Rental Market Comparison
How does the Charlestown Airbnb market stack up against its neighbors? Compare key performance metrics like average monthly revenue, ADR, and occupancy rates in surrounding areas to understand the broader regional STR landscape.
| Market | Active Properties | Monthly Revenue | Daily Rate | Avg. Occupancy |
|---|---|---|---|---|
| Nantucket | 539 | $7,748 | $1045.40 | 41% |
| Sag Harbor | 15 | $6,129 | $1280.84 | 40% |
| Town of East Hampton | 1,327 | $5,945 | $986.02 | 36% |
| Middletown | 395 | $5,781 | $589.01 | 45% |
| North Andover | 12 | $5,625 | $440.84 | 45% |
| Town of Southampton | 1,201 | $5,620 | $1002.45 | 33% |
| Nahant | 13 | $5,564 | $602.44 | 42% |
| Southampton | 19 | $5,405 | $1456.43 | 30% |
| New Shoreham | 120 | $5,359 | $637.79 | 45% |
| Wellesley | 22 | $5,310 | $520.90 | 50% |