Barrington Airbnb Market Analysis 2026: Short Term Rental Data & Vacation Rental Statistics in Rhode Island, United States
Is Airbnb profitable in Barrington in 2026? Explore comprehensive Airbnb analytics for Barrington, Rhode Island, United States to uncover income potential. This 2026 STR market report for Barrington, based on AirROI data from February 2025 to January 2026, reveals key trends in the niche market of 33 active listings.
Whether you're considering an Airbnb investment in Barrington, optimizing your existing vacation rental, or exploring rental arbitrage opportunities, understanding the Barrington Airbnb data is crucial. Navigating the high regulation landscape is key to maximizing your short term rental income potential. Let's dive into the specifics.
Key Barrington Airbnb Performance Metrics Overview
Monthly Airbnb Revenue Variations & Income Potential in Barrington (2026)
Understanding the monthly revenue variations for Airbnb listings in Barrington is key to maximizing your short term rental income potential. Seasonality significantly impacts earnings. Our analysis, based on data from the past 12 months, shows that the peak revenue month for STRs in Barrington is typically July, while February often presents the lowest earnings, highlighting opportunities for strategic pricing adjustments during shoulder and low seasons. Explore the typical Airbnb income in Barrington across different performance tiers:
- Best-in-class properties (Top 10%) achieve $11,909+ monthly, often utilizing dynamic pricing and superior guest experiences.
- Strong performing properties (Top 25%) earn $6,846 or more, indicating effective management and desirable locations/amenities.
- Typical properties (Median) generate around $4,413 per month, representing the average market performance.
- Entry-level properties (Bottom 25%) see earnings around $2,552, often with potential for optimization.
Average Monthly Airbnb Earnings Trend in Barrington
Barrington Airbnb Occupancy Rate Trends (2026)
Maximize your bookings by understanding the Barrington STR occupancy trends. Seasonal demand shifts significantly influence how often properties are booked. Typically, Julysees the highest demand (peak season occupancy), while January experiences the lowest (low season). Effective strategies, like adjusting minimum stays or offering promotions, can boost occupancy during slower periods. Here's how different property tiers perform in Barrington:
- Best-in-class properties (Top 10%) achieve 78%+ occupancy, indicating high desirability and potentially optimized availability.
- Strong performing properties (Top 25%) maintain 65% or higher occupancy, suggesting good market fit and guest satisfaction.
- Typical properties (Median) have an occupancy rate around 47%.
- Entry-level properties (Bottom 25%) average 26% occupancy, potentially facing higher vacancy.
Average Monthly Occupancy Rate Trend in Barrington
Average Daily Rate (ADR) Airbnb Trends in Barrington (2026)
Effective short term rental pricing strategy in Barrington involves understanding monthly ADR fluctuations. The Average Daily Rate (ADR) for Airbnb in Barrington typically peaks in July and dips lowest during January. Leveraging Airbnb dynamic pricing tools or strategies based on this seasonality can significantly boost revenue. Here's a look at the typical nightly rates achieved:
- Best-in-class properties (Top 10%) command rates of $919+ per night, often due to premium features or locations.
- Strong performing properties (Top 25%) achieve nightly rates of $557 or more.
- Typical properties (Median) charge around $323 per night.
- Entry-level properties (Bottom 25%) earn around $226 per night.
Average Daily Rate (ADR) Trend by Month in Barrington
Get Live Barrington Market Intelligence 👇

Explore Real-time Analytics
Airbnb Seasonality Analysis & Trends in Barrington (2026)
Peak Season (July, August, September)
- Revenue averages $9,132 per month
- Occupancy rates average 61.1%
- Daily rates average $488
Shoulder Season
- Revenue averages $5,554 per month
- Occupancy maintains around 48.5%
- Daily rates hold near $446
Low Season (January, February, March)
- Revenue drops to average $2,250 per month
- Occupancy decreases to average 27.8%
- Daily rates adjust to average $427
Seasonality Insights for Barrington
- The Airbnb seasonality in Barrington shows highly seasonal trends requiring careful strategy. While the sections above show seasonal averages, it's also insightful to look at the extremes:
- During the high season, the absolute peak month showcases Barrington's highest earning potential, with monthly revenues capable of climbing to $10,251, occupancy reaching a high of 63.6%, and ADRs peaking at $504.
- Conversely, the slowest single month of the year, typically falling within the low season, marks the market's lowest point. In this month, revenue might dip to $1,763, occupancy could drop to 23.8%, and ADRs may adjust down to $412.
- Understanding both the seasonal averages and these monthly peaks and troughs in revenue, occupancy, and ADR is crucial for maximizing your Airbnb profit potential in Barrington.
Seasonal Strategies for Maximizing Profit
- Peak Season: Maximize revenue through premium pricing and potentially longer minimum stays. Ensure high availability.
- Low Season: Offer competitive pricing, special promotions (e.g., extended stay discounts), and flexible cancellation policies. Target off-season travelers like remote workers or budget-conscious guests.
- Shoulder Seasons: Implement dynamic pricing that balances peak and low rates. Target weekend travelers or specific events. Offer slightly more flexible terms than peak season.
- Regularly analyze your own performance against these Barrington seasonality benchmarks and adjust your pricing and availability strategy accordingly.
Best Areas for Airbnb Investment in Barrington (2026)
Exploring the top neighborhoods for short-term rentals in Barrington? This section highlights key areas, outlining why they are attractive for hosts and guests, along with notable local attractions. Consider these locations based on your target guest profile and investment strategy.
| Neighborhood / Area | Why Host Here? (Target Guests & Appeal) | Key Attractions & Landmarks |
|---|---|---|
| Barrington Town Center | The heart of Barrington offers a charming New England vibe, with local shops, restaurants, and easy access to East Bay bike path, ideal for both families and business travelers. | Barrington Library, Barrington Public Schools, Bayside Restaurant, East Bay Bike Path, Haines Memorial State Park |
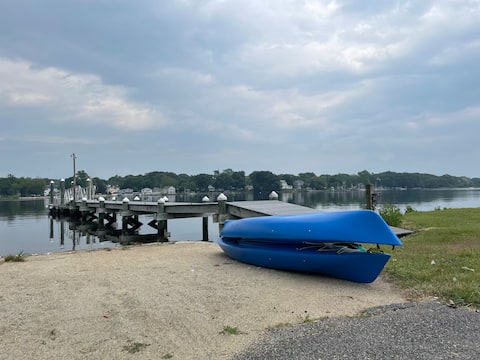
| Bayside | A scenic waterfront area perfect for those seeking a peaceful escape with stunning views. Ideal for visitors wanting to enjoy outdoor activities like boating and fishing. | Narragansett Bay, Bayside Beach, Golfing at Barrington Golf Club, Water activities, Nature trails |
| Sowams | A quiet residential neighborhood known for its family-friendly atmosphere and proximity to parks and schools. Attractive for families visiting relatives or during school events. | Sowams Woods, Hampden Meadows School, Local parks, Family-friendly restaurants, Nature walks |
| East Bay | This region provides beautiful waterfront access along with a variety of outdoor recreational activities, attracting nature lovers and those wanting a retreat from the city. | Colt State Park, Wildlife watching, Picnicking areas, Scenic coastal views, Kayaking |
| West Barrington | A peaceful neighborhood away from the hustle and bustle, perfect for those seeking tranquility without being far from amenities. | Local shops, Community events, Parks and green spaces, Casual dining options, Family-oriented community |
| Primrose Hill | Home to some of Barrington's most picturesque views, this area is a favorite among tourists for scenic walks and proximity to the water. | Primrose Hill Park, Scenic viewpoints, Historic homes, Walking trails, Community events |
| Cove | A historic area with beautiful landscapes and water features, offering a relaxed atmosphere perfect for vacation rentals. | Cove Beach, Sandy Point Beach, Local art galleries, Historic sites, Waterfront dining |
| East Bay Bike Path | Known for its recreational opportunities, this area attracts cyclists and outdoor enthusiasts, making it perfect for tourism rentals focused on outdoor activities. | Bike rental stations, Scenic bike routes, Parks along the path, Community events, Nature exploration |
Understanding Airbnb License Requirements & STR Laws in Barrington (2026)
Yes, Barrington, Rhode Island, United States enforces high STR regulations. Obtaining a license and ensuring compliance is almost certainly required according to current 2026 STR laws. Always verify the latest short term rental regulations and Airbnb license requirements directly with local government authorities for Barrington to ensure full compliance before hosting.
(Source: AirROI data, 2026, based on 91% licensed listings)
Top Performing Airbnb Properties in Barrington (2026)
Benchmark your potential! Explore examples of top-performing Airbnb properties in Barringtonbased on Trailing Twelve Month (TTM) revenue. Analyze their characteristics, revenue, occupancy rate, and ADR to understand what drives success in this market.

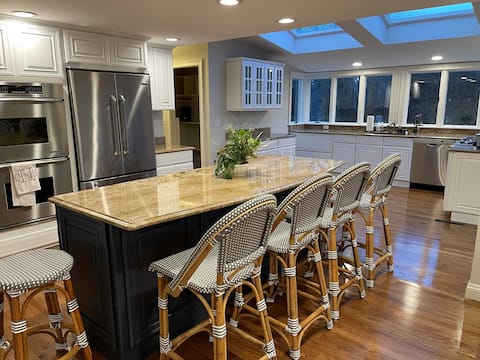
Waterfront Home with Pool & Hot Tub in Barrington
Entire Place • 3 bedrooms
Premium waterfront house!
Entire Place • 10 bedrooms
Beautiful Home on the Harbor
Entire Place • 4 bedrooms

Barrington Oasis: Waterview with an Inground Pool!
Entire Place • 3 bedrooms

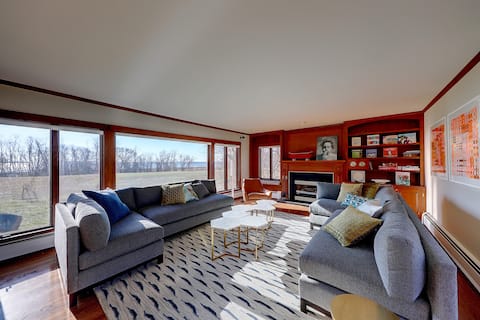
Luxury waterfront home with breathtaking views
Entire Place • 3 bedrooms
Seaside Home with Beach Access
Entire Place • 4 bedrooms
Note: Performance varies based on location, size, amenities, seasonality, and management quality. Data reflects the past 12 months.
Top Performing Airbnb Hosts in Barrington (2026)
Learn from the best! This table showcases top-performing Airbnb hosts in Barrington based on the number of properties managed and estimated total revenue over the past year. Analyze their scale and performance metrics.
| Host Name | Properties | Grossing Revenue | Stay Reviews | Avg Rating |
|---|---|---|---|---|
| Roberta | 1 | $177,944 | 48 | 4.92/5.0 |
| Zhongyuan | 1 | $160,390 | 63 | 4.89/5.0 |
| Carolyn | 1 | $122,659 | 28 | 4.96/5.0 |
| Amy | 1 | $105,453 | 54 | 4.98/5.0 |
| Thomas | 1 | $101,946 | 24 | 5.00/5.0 |
| Thomas | 1 | $97,532 | 93 | 4.94/5.0 |
| Leonard | 1 | $80,231 | 56 | 4.91/5.0 |
| Indigo | 2 | $79,568 | 54 | 4.98/5.0 |
| Leigh Anne | 1 | $76,425 | 44 | 5.00/5.0 |
| John | 1 | $68,416 | 52 | 4.96/5.0 |
Analyzing the strategies of top hosts, such as their property selection, pricing, and guest communication, can offer valuable lessons for optimizing your own Airbnb operations in Barrington.
Dive Deeper: Advanced Barrington STR Market Data (2026)
Ready to unlock more insights? AirROI provides access to advanced metrics and comprehensive Airbnb data for Barrington. Explore detailed analytics beyond this report to refine your investment strategy, optimize pricing, and maximize your vacation rental profits.
Explore Advanced MetricsBarrington Short-Term Rental Market Composition (2026): Property & Room Types
Room Type Distribution
Property Type Distribution
Market Composition Insights for Barrington
- The Barrington Airbnb market composition is heavily skewed towards Entire Home/Apt listings, which make up 97% of the 33 active rentals. This indicates strong guest preference for privacy and space.
- Looking at the property type distribution in Barrington, House properties are the most common (75.8%), reflecting the local real estate landscape.
- Houses represent a significant 75.8% portion, catering likely to families or larger groups.
- The presence of 6.1% Hotel/Boutique listings indicates integration with traditional hospitality.
- Smaller segments like unique stays (combined 3.0%) offer potential for unique stay experiences.
Barrington Airbnb Room Capacity Analysis (2026): Bedroom Distribution
Distribution of Listings by Number of Bedrooms
Room Capacity Insights for Barrington
- The dominant room capacity in Barrington is 3 bedrooms listings, making up 27.3% of the market. This suggests a strong demand for properties suitable for families or small groups.
- Together, 3 bedrooms and 2 bedrooms properties represent 54.6% of the active Airbnb listings in Barrington, indicating a high concentration in these sizes.
- A significant 48.5% of listings offer 3+ bedrooms, catering to larger groups and families seeking more space in Barrington.
Barrington Vacation Rental Guest Capacity Trends (2026)
Distribution of Listings by Guest Capacity
Guest Capacity Insights for Barrington
- The most common guest capacity trend in Barrington vacation rentals is listings accommodating 8+ guests (27.3%). This suggests the primary traveler segment is likely larger groups.
- Properties designed for 8+ guests and 4 guests dominate the Barrington STR market, accounting for 51.5% of listings.
- 54.6% of properties accommodate 6+ guests, serving the market segment for larger families or group travel in Barrington.
- On average, properties in Barrington are equipped to host 5.5 guests.
Barrington Airbnb Booking Patterns (2026): Available vs. Booked Days
Available Days Distribution
Booked Days Distribution
Booking Pattern Insights for Barrington
- The most common availability pattern in Barrington falls within the 181-270 days range, representing 36.4% of listings. This suggests many properties have significant open periods on their calendars.
- Approximately 69.7% of listings show high availability (181+ days open annually), indicating potential for increased bookings or specific owner usage patterns.
- For booked days, the 181-270 days range is most frequent in Barrington (36.4%), reflecting common guest stay durations or potential owner blocking patterns.
- A notable 36.4% of properties secure long booking periods (181+ days booked per year), highlighting successful long-term rental strategies or significant owner usage.
Barrington Airbnb Minimum Stay Requirements Analysis
Distribution of Listings by Minimum Night Requirement
1 Night
4 listings
12.1% of total
2 Nights
9 listings
27.3% of total
3 Nights
3 listings
9.1% of total
7-29 Nights
3 listings
9.1% of total
30+ Nights
14 listings
42.4% of total
Key Insights
- The most prevalent minimum stay requirement in Barrington is 30+ Nights, adopted by 42.4% of listings. This highlights the market's preference for longer commitments.
- A significant segment (42.4%) caters to monthly stays (30+ nights) in Barrington, pointing to opportunities in the extended-stay market.
Recommendations
- Align with the market by considering a 30+ Nights minimum stay, as 42.4% of Barrington hosts use this setting.
- If feasible, allowing 1-night stays, especially midweek or during low season, could capture last-minute bookings, as only 12.1% currently do.
- Explore offering discounts for stays of 30+ nights to attract the 42.4% of the market seeking extended stays.
- Adjust minimum nights based on seasonality – potentially shorter during low season and longer during peak demand periods in Barrington.
Barrington Airbnb Cancellation Policy Trends Analysis (2026)
Super Strict 30 Days
1 listings
3% of total
Flexible
3 listings
9.1% of total
Moderate
9 listings
27.3% of total
Firm
12 listings
36.4% of total
Strict
8 listings
24.2% of total
Cancellation Policy Insights for Barrington
- The prevailing Airbnb cancellation policy trend in Barrington is Firm, used by 36.4% of listings.
- A majority (60.6%) of hosts in Barrington utilize Firm or Strict policies, indicating a market where hosts prioritize booking security.
Recommendations for Hosts
- Consider adopting a Firm policy to align with the 36.4% market standard in Barrington.
- Regularly review your cancellation policy against competitors and market demand shifts in Barrington.
Barrington STR Booking Lead Time Analysis (2026)
Average Booking Lead Time by Month
Booking Lead Time Insights for Barrington
- The overall average booking lead time for vacation rentals in Barrington is 71 days.
- Guests book furthest in advance for stays during August (average 115 days), likely coinciding with peak travel demand or local events.
- The shortest booking windows occur for stays in February (average 15 days), indicating more last-minute travel plans during this time.
- Seasonally, Summer (96 days avg.) sees the longest lead times, while Winter (30 days avg.) has the shortest, reflecting typical travel planning cycles.
Recommendations for Hosts
- Use the overall average lead time (71 days) as a baseline for your pricing and availability strategy in Barrington.
- For August stays, consider implementing length-of-stay discounts or slightly higher rates for bookings made less than 115 days out to capitalize on advance planning.
- Target marketing efforts for the Summer season well in advance (at least 96 days) to capture early planners.
- Monitor your own booking lead times against these Barrington averages to identify opportunities for dynamic pricing adjustments.
Popular & Essential Airbnb Amenities in Barrington (2026)
Amenity Prevalence
Amenity Insights for Barrington
- Essential amenities in Barrington that guests expect include: Smoke alarm, Air conditioning, Dishes and silverware, Carbon monoxide alarm, Coffee maker, Heating, TV, Wifi, Free parking on premises. Lacking these (any) could significantly impact bookings.
- Popular amenities like Hangers are common but not universal. Offering these can provide a competitive edge.
Recommendations for Hosts
- Ensure your listing includes all essential amenities for Barrington: Smoke alarm, Air conditioning, Dishes and silverware, Carbon monoxide alarm, Coffee maker, Heating, TV, Wifi, Free parking on premises.
- Prioritize adding missing essentials: Air conditioning, Dishes and silverware, Carbon monoxide alarm, Coffee maker, Heating, TV, Wifi, Free parking on premises.
- Consider adding popular differentiators like Hangers to increase appeal.
- Highlight unique or less common amenities you offer (e.g., hot tub, dedicated workspace, EV charger) in your listing description and photos.
- Regularly check competitor amenities in Barrington to stay competitive.
Barrington Airbnb Guest Demographics & Profile Analysis (2026)
Guest Profile Summary for Barrington
- The typical guest profile for Airbnb in Barrington consists of primarily domestic travelers (96%), often arriving from nearby New York, typically belonging to the Post-2000s (Gen Z/Alpha) group (50%), primarily speaking English or Spanish.
- Domestic travelers account for 95.9% of guests.
- Key international markets include United States (95.9%) and DC (0.8%).
- Top languages spoken are English (74%) followed by Spanish (8.1%).
- A significant demographic segment is the Post-2000s (Gen Z/Alpha) group, representing 50% of guests.
Recommendations for Hosts
- Target domestic marketing efforts towards travelers from New York and Boston.
- Tailor amenities and listing descriptions to appeal to the dominant Post-2000s (Gen Z/Alpha) demographic (e.g., highlight fast WiFi, smart home features, local guides).
- Highlight unique local experiences or amenities relevant to the primary guest profile.
- Consider seasonal promotions aligned with peak travel times for key origin markets.
Nearby Short-Term Rental Market Comparison
How does the Barrington Airbnb market stack up against its neighbors? Compare key performance metrics like average monthly revenue, ADR, and occupancy rates in surrounding areas to understand the broader regional STR landscape.
| Market | Active Properties | Monthly Revenue | Daily Rate | Avg. Occupancy |
|---|---|---|---|---|
| Nantucket | 539 | $7,748 | $1045.40 | 41% |
| Sag Harbor | 15 | $6,129 | $1280.84 | 40% |
| Town of East Hampton | 1,327 | $5,945 | $986.02 | 36% |
| Middletown | 395 | $5,781 | $589.01 | 45% |
| North Andover | 12 | $5,625 | $440.84 | 45% |
| Town of Southampton | 1,201 | $5,620 | $1002.45 | 33% |
| Nahant | 13 | $5,564 | $602.44 | 42% |
| Southampton | 19 | $5,405 | $1456.43 | 30% |
| New Shoreham | 120 | $5,359 | $637.79 | 45% |
| Wellesley | 22 | $5,310 | $520.90 | 50% |