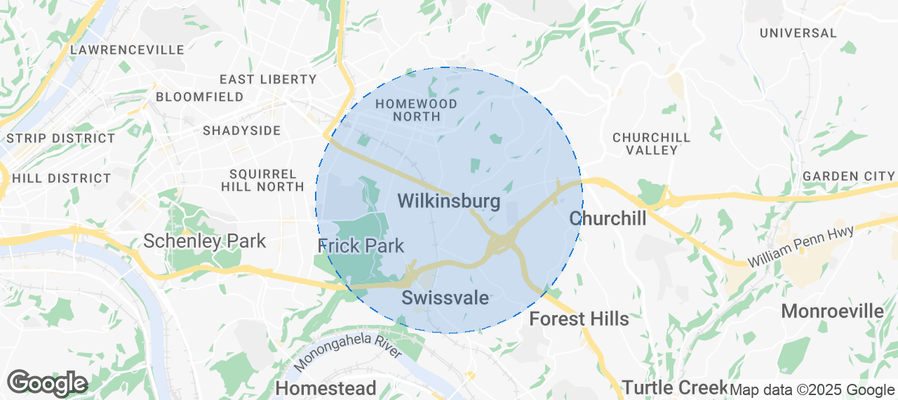
Wilkinsburg Airbnb Market Analysis 2026: Short Term Rental Data & Vacation Rental Statistics in Pennsylvania, United States
Is Airbnb profitable in Wilkinsburg in 2026? Explore comprehensive Airbnb analytics for Wilkinsburg, Pennsylvania, United States to uncover income potential. This 2026 STR market report for Wilkinsburg, based on AirROI data from February 2025 to January 2026, reveals key trends in the niche market of 38 active listings.
Whether you're considering an Airbnb investment in Wilkinsburg, optimizing your existing vacation rental, or exploring rental arbitrage opportunities, understanding the Wilkinsburg Airbnb data is crucial. Leveraging the low regulation environment is key to maximizing your short term rental income potential. Let's dive into the specifics.
Key Wilkinsburg Airbnb Performance Metrics Overview
Monthly Airbnb Revenue Variations & Income Potential in Wilkinsburg (2026)
Understanding the monthly revenue variations for Airbnb listings in Wilkinsburg is key to maximizing your short term rental income potential. Seasonality significantly impacts earnings. Our analysis, based on data from the past 12 months, shows that the peak revenue month for STRs in Wilkinsburg is typically October, while January often presents the lowest earnings, highlighting opportunities for strategic pricing adjustments during shoulder and low seasons. Explore the typical Airbnb income in Wilkinsburg across different performance tiers:
- Best-in-class properties (Top 10%) achieve $4,004+ monthly, often utilizing dynamic pricing and superior guest experiences.
- Strong performing properties (Top 25%) earn $2,574 or more, indicating effective management and desirable locations/amenities.
- Typical properties (Median) generate around $1,219 per month, representing the average market performance.
- Entry-level properties (Bottom 25%) see earnings around $531, often with potential for optimization.
Average Monthly Airbnb Earnings Trend in Wilkinsburg
Wilkinsburg Airbnb Occupancy Rate Trends (2026)
Maximize your bookings by understanding the Wilkinsburg STR occupancy trends. Seasonal demand shifts significantly influence how often properties are booked. Typically, Maysees the highest demand (peak season occupancy), while January experiences the lowest (low season). Effective strategies, like adjusting minimum stays or offering promotions, can boost occupancy during slower periods. Here's how different property tiers perform in Wilkinsburg:
- Best-in-class properties (Top 10%) achieve 72%+ occupancy, indicating high desirability and potentially optimized availability.
- Strong performing properties (Top 25%) maintain 54% or higher occupancy, suggesting good market fit and guest satisfaction.
- Typical properties (Median) have an occupancy rate around 32%.
- Entry-level properties (Bottom 25%) average 18% occupancy, potentially facing higher vacancy.
Average Monthly Occupancy Rate Trend in Wilkinsburg
Average Daily Rate (ADR) Airbnb Trends in Wilkinsburg (2026)
Effective short term rental pricing strategy in Wilkinsburg involves understanding monthly ADR fluctuations. The Average Daily Rate (ADR) for Airbnb in Wilkinsburg typically peaks in June and dips lowest during February. Leveraging Airbnb dynamic pricing tools or strategies based on this seasonality can significantly boost revenue. Here's a look at the typical nightly rates achieved:
- Best-in-class properties (Top 10%) command rates of $215+ per night, often due to premium features or locations.
- Strong performing properties (Top 25%) achieve nightly rates of $171 or more.
- Typical properties (Median) charge around $106 per night.
- Entry-level properties (Bottom 25%) earn around $53 per night.
Average Daily Rate (ADR) Trend by Month in Wilkinsburg
Get Live Wilkinsburg Market Intelligence 👇
Explore Real-time Analytics
Airbnb Seasonality Analysis & Trends in Wilkinsburg (2026)
Peak Season (October, June, December)
- Revenue averages $2,172 per month
- Occupancy rates average 39.7%
- Daily rates average $131
Shoulder Season
- Revenue averages $1,786 per month
- Occupancy maintains around 39.1%
- Daily rates hold near $123
Low Season (January, March, April)
- Revenue drops to average $1,311 per month
- Occupancy decreases to average 32.6%
- Daily rates adjust to average $115
Seasonality Insights for Wilkinsburg
- The Airbnb seasonality in Wilkinsburg shows moderate seasonality with distinct peak and low periods. While the sections above show seasonal averages, it's also insightful to look at the extremes:
- During the high season, the absolute peak month showcases Wilkinsburg's highest earning potential, with monthly revenues capable of climbing to $2,229, occupancy reaching a high of 47.5%, and ADRs peaking at $134.
- Conversely, the slowest single month of the year, typically falling within the low season, marks the market's lowest point. In this month, revenue might dip to $1,131, occupancy could drop to 27.7%, and ADRs may adjust down to $109.
- Understanding both the seasonal averages and these monthly peaks and troughs in revenue, occupancy, and ADR is crucial for maximizing your Airbnb profit potential in Wilkinsburg.
Seasonal Strategies for Maximizing Profit
- Peak Season: Maximize revenue through premium pricing and potentially longer minimum stays. Ensure high availability.
- Low Season: Offer competitive pricing, special promotions (e.g., extended stay discounts), and flexible cancellation policies. Target off-season travelers like remote workers or budget-conscious guests.
- Shoulder Seasons: Implement dynamic pricing that balances peak and low rates. Target weekend travelers or specific events. Offer slightly more flexible terms than peak season.
- Regularly analyze your own performance against these Wilkinsburg seasonality benchmarks and adjust your pricing and availability strategy accordingly.
Best Areas for Airbnb Investment in Wilkinsburg (2026)
Exploring the top neighborhoods for short-term rentals in Wilkinsburg? This section highlights key areas, outlining why they are attractive for hosts and guests, along with notable local attractions. Consider these locations based on your target guest profile and investment strategy.
| Neighborhood / Area | Why Host Here? (Target Guests & Appeal) | Key Attractions & Landmarks |
|---|---|---|
| East Hills | A suburban area known for its quiet residential vibe, making it attractive for families and longer-term stays. Proximity to parks and schools adds to its appeal. | Schenley Park, East Hills Park, Pittsburgh Zoo & PPG Aquarium, Frick Park, Local shopping centers |
| Wilkinsburg Business District | As a commercial hub with a diverse range of shops and restaurants, it attracts guests looking for convenience and local culture. The area is becoming increasingly popular for short stays. | Wilkinsburg Town Hall, Anchor Presbyterian Church, Great Allegheny Passage, Local art galleries, Restaurants and cafes |
| Longwood | A residential neighborhood featuring a mix of single-family homes and apartments. It's appealing for those needing easy access to nearby universities and medical facilities. | Longwood Gardens, Shadyside, Local parks, Pittsburgh Botanical Gardens |
| Swissvale | Adjacent to Wilkinsburg, Swissvale has its own charm and growing appeal. It is known for its community events and local parks, making it a cozy spot for visitors. | Swissvale Park, Local cafes, Community art events, Public library, Shops along Suez Street |
| Chatham Village | A historic community known for its unique architecture and communal living. It attracts guests interested in history and architecture. | Chatham Village Historic District, Schenley Park, Community gardens, Nearby shopping |
| Forest Hills | This neighborhood provides a more suburban feel, making it great for families. It's also close to transit options, allowing easy access to downtown Pittsburgh. | Forest Hills Park, Public library, Local dining options, Parks and recreation areas |
| Braddock | An up-and-coming area with a rich history, attracting those looking for affordable accommodations and a taste of local culture. | The Braddock Tunnel, Braddock Library, Local music events, Shops and eateries, Community parks |
| Squirrel Hill | A vibrant community known for its diverse dining options and cultural attractions. Its proximity to cultural institutions makes it a favorite among visitors. | The Carnegie Library, Pittsburgh Film Office, Frick Park, Shopping on Murray Avenue, Local restaurants |
Understanding Airbnb License Requirements & STR Laws in Wilkinsburg (2026)
While Wilkinsburg, Pennsylvania, United States currently shows low STR regulations, specific Airbnb license requirements might still exist or change. Always verify the latest short term rental regulations and Airbnb license requirements directly with local government authorities for Wilkinsburg to ensure full compliance before hosting.
(Source: AirROI data, 2026, finding no licensed listings among those analyzed)
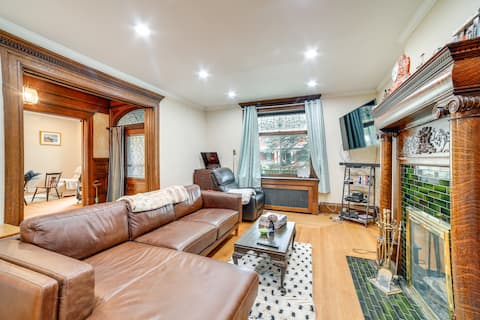
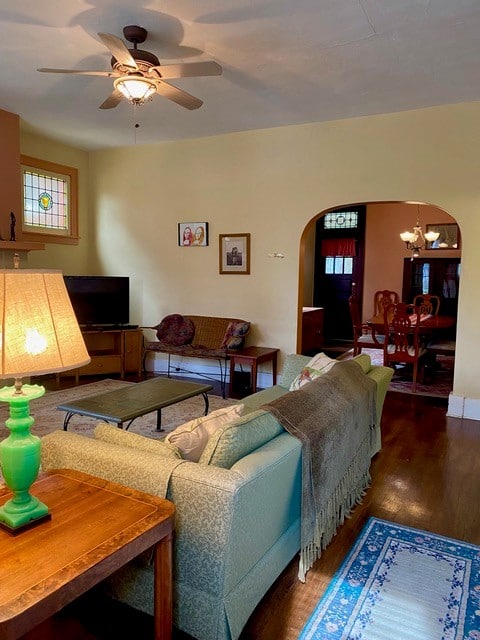
Top Performing Airbnb Properties in Wilkinsburg (2026)
Benchmark your potential! Explore examples of top-performing Airbnb properties in Wilkinsburgbased on Trailing Twelve Month (TTM) revenue. Analyze their characteristics, revenue, occupancy rate, and ADR to understand what drives success in this market.

Walk to Cafes + Frick Park From A Breezy Retreat
Entire Place • 4 bedrooms
Spacious Pittsburgh Rental: Walk to Frick Park!
Entire Place • 3 bedrooms
east end inn
Entire Place • 4 bedrooms

Secret Garden by Frick Park with Garage Parking
Entire Place • 3 bedrooms

Wilkinsburg Sanctuary w/ Free Street Parking
Entire Place • 2 bedrooms

Oasis by Frick Park w Garage Parking and Workspace
Entire Place • 3 bedrooms
Note: Performance varies based on location, size, amenities, seasonality, and management quality. Data reflects the past 12 months.
Top Performing Airbnb Hosts in Wilkinsburg (2026)
Learn from the best! This table showcases top-performing Airbnb hosts in Wilkinsburg based on the number of properties managed and estimated total revenue over the past year. Analyze their scale and performance metrics.
| Host Name | Properties | Grossing Revenue | Stay Reviews | Avg Rating |
|---|---|---|---|---|
| Stacey | 3 | $99,651 | 196 | 4.95/5.0 |
| Evolve | 2 | $65,709 | 46 | 4.21/5.0 |
| Andrew | 1 | $65,464 | 40 | 4.93/5.0 |
| Glenn | 2 | $46,673 | 341 | 4.71/5.0 |
| Maria | 4 | $34,493 | 57 | 4.62/5.0 |
| Justin | 1 | $28,228 | 145 | 4.82/5.0 |
| Kelly Jane | 1 | $27,047 | 164 | 4.92/5.0 |
| Tim | 1 | $20,764 | 257 | 4.81/5.0 |
| Phebee | 3 | $19,869 | 43 | 4.66/5.0 |
| RedAwning | 1 | $19,019 | 11 | 4.55/5.0 |
Analyzing the strategies of top hosts, such as their property selection, pricing, and guest communication, can offer valuable lessons for optimizing your own Airbnb operations in Wilkinsburg.
Dive Deeper: Advanced Wilkinsburg STR Market Data (2026)
Ready to unlock more insights? AirROI provides access to advanced metrics and comprehensive Airbnb data for Wilkinsburg. Explore detailed analytics beyond this report to refine your investment strategy, optimize pricing, and maximize your vacation rental profits.
Explore Advanced MetricsWilkinsburg Short-Term Rental Market Composition (2026): Property & Room Types
Room Type Distribution
Property Type Distribution
Market Composition Insights for Wilkinsburg
- The Wilkinsburg Airbnb market composition is heavily skewed towards Entire Home/Apt listings, which make up 57.9% of the 38 active rentals. This indicates strong guest preference for privacy and space.
- However, a notable 42.1% share for Private Rooms suggests opportunities for budget-conscious travelers or hosts renting out spare rooms.
- Looking at the property type distribution in Wilkinsburg, House properties are the most common (50%), reflecting the local real estate landscape.
- Houses represent a significant 50% portion, catering likely to families or larger groups.
- Smaller segments like hotel/boutique (combined 2.6%) offer potential for unique stay experiences.
Wilkinsburg Airbnb Room Capacity Analysis (2026): Bedroom Distribution
Distribution of Listings by Number of Bedrooms
Room Capacity Insights for Wilkinsburg
- The dominant room capacity in Wilkinsburg is 1 bedroom listings, making up 23.7% of the market. This suggests a strong demand for properties suitable for couples or solo travelers.
- Together, 1 bedroom and 3 bedrooms properties represent 47.4% of the active Airbnb listings in Wilkinsburg, indicating a high concentration in these sizes.
- A significant 34.2% of listings offer 3+ bedrooms, catering to larger groups and families seeking more space in Wilkinsburg.
Wilkinsburg Vacation Rental Guest Capacity Trends (2026)
Distribution of Listings by Guest Capacity
Guest Capacity Insights for Wilkinsburg
- The most common guest capacity trend in Wilkinsburg vacation rentals is listings accommodating 6 guests (18.4%). This suggests the primary traveler segment is likely larger groups.
- Properties designed for 6 guests and 4 guests dominate the Wilkinsburg STR market, accounting for 28.9% of listings.
- 31.6% of properties accommodate 6+ guests, serving the market segment for larger families or group travel in Wilkinsburg.
- On average, properties in Wilkinsburg are equipped to host 3.0 guests.
Wilkinsburg Airbnb Booking Patterns (2026): Available vs. Booked Days
Available Days Distribution
Booked Days Distribution
Booking Pattern Insights for Wilkinsburg
- The most common availability pattern in Wilkinsburg falls within the 271-366 days range, representing 52.6% of listings. This suggests many properties have significant open periods on their calendars.
- Approximately 92.1% of listings show high availability (181+ days open annually), indicating potential for increased bookings or specific owner usage patterns.
- For booked days, the 91-180 days range is most frequent in Wilkinsburg (36.8%), reflecting common guest stay durations or potential owner blocking patterns.
- A notable 10.5% of properties secure long booking periods (181+ days booked per year), highlighting successful long-term rental strategies or significant owner usage.
Wilkinsburg Airbnb Minimum Stay Requirements Analysis
Distribution of Listings by Minimum Night Requirement
1 Night
3 listings
7.9% of total
2 Nights
24 listings
63.2% of total
3 Nights
1 listings
2.6% of total
4-6 Nights
1 listings
2.6% of total
7-29 Nights
2 listings
5.3% of total
30+ Nights
7 listings
18.4% of total
Key Insights
- The most prevalent minimum stay requirement in Wilkinsburg is 2 Nights, adopted by 63.2% of listings. This highlights the market's preference for shorter, flexible bookings.
- A strong majority (71.1%) of the Wilkinsburg Airbnb data shows acceptance of very short stays (1-2 nights), indicating a dynamic, high-turnover market.
- A significant segment (18.4%) caters to monthly stays (30+ nights) in Wilkinsburg, pointing to opportunities in the extended-stay market.
Recommendations
- Align with the market by considering a 2 Nights minimum stay, as 63.2% of Wilkinsburg hosts use this setting.
- If feasible, allowing 1-night stays, especially midweek or during low season, could capture last-minute bookings, as only 7.9% currently do.
- A 2-night minimum appears standard (63.2%). Consider this for weekends or peak periods.
- Explore offering discounts for stays of 30+ nights to attract the 18.4% of the market seeking extended stays.
- Adjust minimum nights based on seasonality – potentially shorter during low season and longer during peak demand periods in Wilkinsburg.
Wilkinsburg Airbnb Cancellation Policy Trends Analysis (2026)
Super Strict 30 Days
3 listings
7.9% of total
Flexible
12 listings
31.6% of total
Moderate
10 listings
26.3% of total
Firm
9 listings
23.7% of total
Strict
4 listings
10.5% of total
Cancellation Policy Insights for Wilkinsburg
- The prevailing Airbnb cancellation policy trend in Wilkinsburg is Flexible, used by 31.6% of listings.
- There's a relatively balanced mix between guest-friendly (57.9%) and stricter (34.2%) policies, offering choices for different guest needs.
Recommendations for Hosts
- Consider adopting a Flexible policy to align with the 31.6% market standard in Wilkinsburg.
- Using a Strict policy might deter some guests, as only 10.5% of listings use it. Evaluate if potential revenue protection outweighs possible lower booking rates.
- Regularly review your cancellation policy against competitors and market demand shifts in Wilkinsburg.
Wilkinsburg STR Booking Lead Time Analysis (2026)
Average Booking Lead Time by Month
Booking Lead Time Insights for Wilkinsburg
- The overall average booking lead time for vacation rentals in Wilkinsburg is 34 days.
- Guests book furthest in advance for stays during May (average 56 days), likely coinciding with peak travel demand or local events.
- The shortest booking windows occur for stays in February (average 11 days), indicating more last-minute travel plans during this time.
- Seasonally, Summer (37 days avg.) sees the longest lead times, while Winter (23 days avg.) has the shortest, reflecting typical travel planning cycles.
Recommendations for Hosts
- Use the overall average lead time (34 days) as a baseline for your pricing and availability strategy in Wilkinsburg.
- For May stays, consider implementing length-of-stay discounts or slightly higher rates for bookings made less than 56 days out to capitalize on advance planning.
- During February, focus on last-minute booking availability and promotions, as guests book with very short notice (11 days avg.).
- Target marketing efforts for the Summer season well in advance (at least 37 days) to capture early planners.
- Monitor your own booking lead times against these Wilkinsburg averages to identify opportunities for dynamic pricing adjustments.
Popular & Essential Airbnb Amenities in Wilkinsburg (2026)
Amenity Prevalence
Amenity Insights for Wilkinsburg
- Essential amenities in Wilkinsburg that guests expect include: Kitchen, Wifi, Smoke alarm. Lacking these (any) could significantly impact bookings.
- Popular amenities like Carbon monoxide alarm, Washer, Hot water are common but not universal. Offering these can provide a competitive edge.
Recommendations for Hosts
- Ensure your listing includes all essential amenities for Wilkinsburg: Kitchen, Wifi, Smoke alarm.
- Prioritize adding missing essentials: Smoke alarm.
- Consider adding popular differentiators like Carbon monoxide alarm or Washer to increase appeal.
- Highlight unique or less common amenities you offer (e.g., hot tub, dedicated workspace, EV charger) in your listing description and photos.
- Regularly check competitor amenities in Wilkinsburg to stay competitive.
Wilkinsburg Airbnb Guest Demographics & Profile Analysis (2026)
Guest Profile Summary for Wilkinsburg
- The typical guest profile for Airbnb in Wilkinsburg consists of primarily domestic travelers (96%), often arriving from nearby Pittsburgh, typically belonging to the Post-2000s (Gen Z/Alpha) group (50%), primarily speaking English or Spanish.
- Domestic travelers account for 96.0% of guests.
- Key international markets include United States (96%) and Canada (2%).
- Top languages spoken are English (69.7%) followed by Spanish (17.4%).
- A significant demographic segment is the Post-2000s (Gen Z/Alpha) group, representing 50% of guests.
Recommendations for Hosts
- Target domestic marketing efforts towards travelers from Pittsburgh and New York.
- Tailor amenities and listing descriptions to appeal to the dominant Post-2000s (Gen Z/Alpha) demographic (e.g., highlight fast WiFi, smart home features, local guides).
- Highlight unique local experiences or amenities relevant to the primary guest profile.
- Consider seasonal promotions aligned with peak travel times for key origin markets.
Nearby Short-Term Rental Market Comparison
How does the Wilkinsburg Airbnb market stack up against its neighbors? Compare key performance metrics like average monthly revenue, ADR, and occupancy rates in surrounding areas to understand the broader regional STR landscape.
| Market | Active Properties | Monthly Revenue | Daily Rate | Avg. Occupancy |
|---|---|---|---|---|
| Wardensville | 33 | $4,485 | $267.00 | 54% |
| McHenry | 605 | $3,928 | $598.59 | 28% |
| Pine Creek Township | 10 | $3,889 | $230.94 | 57% |
| Swanton | 250 | $3,870 | $639.77 | 30% |
| Garrett County | 11 | $3,848 | $705.84 | 24% |
| Sewickley | 14 | $3,774 | $230.59 | 59% |
| Buffalo Township | 11 | $3,682 | $257.23 | 44% |
| Friendsville | 15 | $3,676 | $500.61 | 36% |
| Halfmoon Township | 25 | $3,654 | $668.26 | 31% |
| Oakmont | 11 | $3,622 | $265.08 | 49% |