Tunkhannock Township Airbnb Market Analysis 2026: Short Term Rental Data & Vacation Rental Statistics in Pennsylvania, United States
Is Airbnb profitable in Tunkhannock Township in 2026? Explore comprehensive Airbnb analytics for Tunkhannock Township, Pennsylvania, United States to uncover income potential. This 2026 STR market report for Tunkhannock Township, based on AirROI data from February 2025 to January 2026, reveals key trends in the market of 249 active listings.
Whether you're considering an Airbnb investment in Tunkhannock Township, optimizing your existing vacation rental, or exploring rental arbitrage opportunities, understanding the Tunkhannock Township Airbnb data is crucial. Leveraging the low regulation environment is key to maximizing your short term rental income potential. Let's dive into the specifics.
Key Tunkhannock Township Airbnb Performance Metrics Overview
Monthly Airbnb Revenue Variations & Income Potential in Tunkhannock Township (2026)
Understanding the monthly revenue variations for Airbnb listings in Tunkhannock Township is key to maximizing your short term rental income potential. Seasonality significantly impacts earnings. Our analysis, based on data from the past 12 months, shows that the peak revenue month for STRs in Tunkhannock Township is typically August, while March often presents the lowest earnings, highlighting opportunities for strategic pricing adjustments during shoulder and low seasons. Explore the typical Airbnb income in Tunkhannock Township across different performance tiers:
- Best-in-class properties (Top 10%) achieve $9,292+ monthly, often utilizing dynamic pricing and superior guest experiences.
- Strong performing properties (Top 25%) earn $6,488 or more, indicating effective management and desirable locations/amenities.
- Typical properties (Median) generate around $4,154 per month, representing the average market performance.
- Entry-level properties (Bottom 25%) see earnings around $2,330, often with potential for optimization.
Average Monthly Airbnb Earnings Trend in Tunkhannock Township
Tunkhannock Township Airbnb Occupancy Rate Trends (2026)
Maximize your bookings by understanding the Tunkhannock Township STR occupancy trends. Seasonal demand shifts significantly influence how often properties are booked. Typically, Augustsees the highest demand (peak season occupancy), while September experiences the lowest (low season). Effective strategies, like adjusting minimum stays or offering promotions, can boost occupancy during slower periods. Here's how different property tiers perform in Tunkhannock Township:
- Best-in-class properties (Top 10%) achieve 71%+ occupancy, indicating high desirability and potentially optimized availability.
- Strong performing properties (Top 25%) maintain 53% or higher occupancy, suggesting good market fit and guest satisfaction.
- Typical properties (Median) have an occupancy rate around 36%.
- Entry-level properties (Bottom 25%) average 21% occupancy, potentially facing higher vacancy.
Average Monthly Occupancy Rate Trend in Tunkhannock Township
Average Daily Rate (ADR) Airbnb Trends in Tunkhannock Township (2026)
Effective short term rental pricing strategy in Tunkhannock Township involves understanding monthly ADR fluctuations. The Average Daily Rate (ADR) for Airbnb in Tunkhannock Township typically peaks in December and dips lowest during March. Leveraging Airbnb dynamic pricing tools or strategies based on this seasonality can significantly boost revenue. Here's a look at the typical nightly rates achieved:
- Best-in-class properties (Top 10%) command rates of $654+ per night, often due to premium features or locations.
- Strong performing properties (Top 25%) achieve nightly rates of $479 or more.
- Typical properties (Median) charge around $344 per night.
- Entry-level properties (Bottom 25%) earn around $252 per night.
Average Daily Rate (ADR) Trend by Month in Tunkhannock Township
Get Live Tunkhannock Township Market Intelligence 👇

Explore Real-time Analytics
Airbnb Seasonality Analysis & Trends in Tunkhannock Township (2026)
Peak Season (August, July, December)
- Revenue averages $7,324 per month
- Occupancy rates average 48.5%
- Daily rates average $450
Shoulder Season
- Revenue averages $4,362 per month
- Occupancy maintains around 35.5%
- Daily rates hold near $402
Low Season (March, April, September)
- Revenue drops to average $3,338 per month
- Occupancy decreases to average 32.7%
- Daily rates adjust to average $359
Seasonality Insights for Tunkhannock Township
- The Airbnb seasonality in Tunkhannock Township shows highly seasonal trends requiring careful strategy. While the sections above show seasonal averages, it's also insightful to look at the extremes:
- During the high season, the absolute peak month showcases Tunkhannock Township's highest earning potential, with monthly revenues capable of climbing to $8,330, occupancy reaching a high of 56.8%, and ADRs peaking at $467.
- Conversely, the slowest single month of the year, typically falling within the low season, marks the market's lowest point. In this month, revenue might dip to $3,037, occupancy could drop to 31.0%, and ADRs may adjust down to $336.
- Understanding both the seasonal averages and these monthly peaks and troughs in revenue, occupancy, and ADR is crucial for maximizing your Airbnb profit potential in Tunkhannock Township.
Seasonal Strategies for Maximizing Profit
- Peak Season: Maximize revenue through premium pricing and potentially longer minimum stays. Ensure high availability.
- Low Season: Offer competitive pricing, special promotions (e.g., extended stay discounts), and flexible cancellation policies. Target off-season travelers like remote workers or budget-conscious guests.
- Shoulder Seasons: Implement dynamic pricing that balances peak and low rates. Target weekend travelers or specific events. Offer slightly more flexible terms than peak season.
- Regularly analyze your own performance against these Tunkhannock Township seasonality benchmarks and adjust your pricing and availability strategy accordingly.
Best Areas for Airbnb Investment in Tunkhannock Township (2026)
Exploring the top neighborhoods for short-term rentals in Tunkhannock Township? This section highlights key areas, outlining why they are attractive for hosts and guests, along with notable local attractions. Consider these locations based on your target guest profile and investment strategy.
| Neighborhood / Area | Why Host Here? (Target Guests & Appeal) | Key Attractions & Landmarks |
|---|---|---|
| Tunkhannock | Charming small town atmosphere with a rich history and close-knit community. Popular for tourists visiting the Endless Mountains and exploring local culture. | Tunkhannock River, Tunkhannock Creek Trail, Dietrich Theater, Wyoming County Historical Society, Shadowbrook Inn and Resort |
| Laceyville | A quaint village surrounded by natural beauty, perfect for those looking for outdoor adventures and a quiet getaway. Attracts nature lovers and families. | Susquehanna River, Topsail Trail, Laceyville's Historical Society, Local parks and fishing spots |
| Meshoppen | A peaceful rural area with access to beautiful landscapes and outdoor activities. Ideal for travelers seeking tranquility and nature-based experiences. | Meshoppen Creek, Fishing and boating activities, Local hiking trails, Scenic views |
| Falls | This area offers a slice of rural Pennsylvania with easy access to the nearby Susquehanna River. Great for those interested in fishing and outdoor activities. | Susquehanna River, Natural Parks, Local wildlife viewing, Hiking trails |
| West Wyoming | A family-friendly suburb of the larger Wilkes-Barre area, making it a convenient stay for visitors to the Wyoming Valley. | Wyoming Valley Mall, Local dining options, Nearby parks and recreation |
| Shickshinny | A small town with beautiful views along the river. Appeals to visitors looking for a peaceful retreat away from city life. | Shickshinny Lake, Historic downtown, Local trails and parks |
| Duryea | A quiet town close to larger cities, offering affordable accommodations for business and leisure travelers alike. | Local shops and cafes, Access to major roads and highways, Nearby attractions in Scranton and Wilkes-Barre |
| West Hazleton | A growing community with a mix of residential and commercial developments. Attracts visitors looking for an affordable stay while exploring the Greater Hazleton Area. | Shopping centers, Parks and recreation, Proximity to local attractions |
Understanding Airbnb License Requirements & STR Laws in Tunkhannock Township (2026)
While Tunkhannock Township, Pennsylvania, United States currently shows low STR regulations, specific Airbnb license requirements might still exist or change. Always verify the latest short term rental regulations and Airbnb license requirements directly with local government authorities for Tunkhannock Township to ensure full compliance before hosting.
(Source: AirROI data, 2026, based on 0% licensed listings)
Top Performing Airbnb Properties in Tunkhannock Township (2026)
Benchmark your potential! Explore examples of top-performing Airbnb properties in Tunkhannock Townshipbased on Trailing Twelve Month (TTM) revenue. Analyze their characteristics, revenue, occupancy rate, and ADR to understand what drives success in this market.
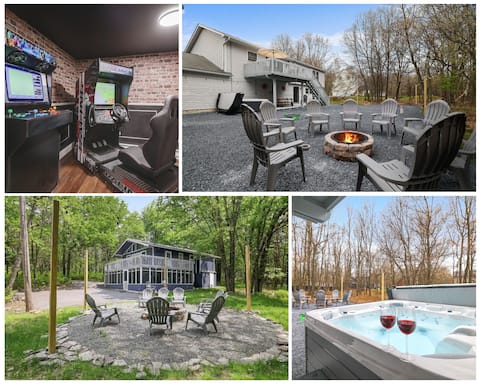
Two House Haven~Sleeps30~2 HotTubs~Pool~speakeasy
Entire Place • 12 bedrooms
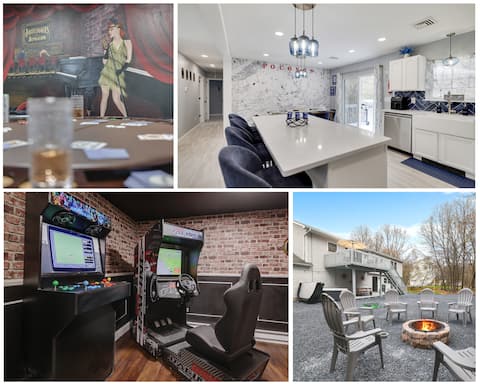
Bootlegger's Bungalow ~ Unique Speakeasy ~ Hot Tub ~ Pool
Entire Place • 6 bedrooms

Luxury Retreat: Pool, Hot Tub, Sauna & Arcade
Entire Place • 3 bedrooms

Private Pool, Hot Tub, Game Rm, Fire Pit, Luxury!
Entire Place • 5 bedrooms

Charming Cabin Retreat - Hot Tub, Sauna & Pool!
Entire Place • 4 bedrooms
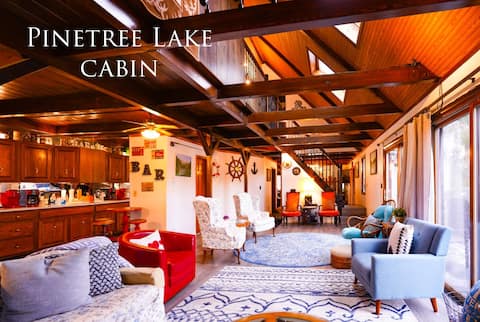
Lake Front Rustic Cabin, Boats, Hot Tub, Game Room
Entire Place • 5 bedrooms
Note: Performance varies based on location, size, amenities, seasonality, and management quality. Data reflects the past 12 months.
Top Performing Airbnb Hosts in Tunkhannock Township (2026)
Learn from the best! This table showcases top-performing Airbnb hosts in Tunkhannock Township based on the number of properties managed and estimated total revenue over the past year. Analyze their scale and performance metrics.
| Host Name | Properties | Grossing Revenue | Stay Reviews | Avg Rating |
|---|---|---|---|---|
| AvantStay Poconos | 11 | $631,011 | 620 | 4.71/5.0 |
| Sameer | 2 | $421,826 | 125 | 4.78/5.0 |
| Calibrate | 4 | $368,267 | 291 | 4.86/5.0 |
| Evolve | 11 | $308,150 | 309 | 4.79/5.0 |
| Danny Kim | 2 | $233,480 | 596 | 4.95/5.0 |
| Margaret | 3 | $228,918 | 148 | 4.88/5.0 |
| Steve | 2 | $217,890 | 335 | 4.92/5.0 |
| Maggie | 2 | $184,023 | 44 | 5.00/5.0 |
| Willy | 4 | $174,773 | 205 | 4.89/5.0 |
| Ivan | 2 | $163,853 | 146 | 4.96/5.0 |
Analyzing the strategies of top hosts, such as their property selection, pricing, and guest communication, can offer valuable lessons for optimizing your own Airbnb operations in Tunkhannock Township.
Dive Deeper: Advanced Tunkhannock Township STR Market Data (2026)
Ready to unlock more insights? AirROI provides access to advanced metrics and comprehensive Airbnb data for Tunkhannock Township. Explore detailed analytics beyond this report to refine your investment strategy, optimize pricing, and maximize your vacation rental profits.
Explore Advanced MetricsTunkhannock Township Short-Term Rental Market Composition (2026): Property & Room Types
Room Type Distribution
Property Type Distribution
Market Composition Insights for Tunkhannock Township
- The Tunkhannock Township Airbnb market composition is heavily skewed towards Entire Home/Apt listings, which make up 100% of the 249 active rentals. This indicates strong guest preference for privacy and space.
- Looking at the property type distribution in Tunkhannock Township, House properties are the most common (82.7%), reflecting the local real estate landscape.
- Houses represent a significant 82.7% portion, catering likely to families or larger groups.
- Smaller segments like others (combined 0.4%) offer potential for unique stay experiences.
Tunkhannock Township Airbnb Room Capacity Analysis (2026): Bedroom Distribution
Distribution of Listings by Number of Bedrooms
Room Capacity Insights for Tunkhannock Township
- The dominant room capacity in Tunkhannock Township is 3 bedrooms listings, making up 54.2% of the market. This suggests a strong demand for properties suitable for families or small groups.
- Together, 3 bedrooms and 4 bedrooms properties represent 75.1% of the active Airbnb listings in Tunkhannock Township, indicating a high concentration in these sizes.
- A significant 93.2% of listings offer 3+ bedrooms, catering to larger groups and families seeking more space in Tunkhannock Township.
Tunkhannock Township Vacation Rental Guest Capacity Trends (2026)
Distribution of Listings by Guest Capacity
Guest Capacity Insights for Tunkhannock Township
- The most common guest capacity trend in Tunkhannock Township vacation rentals is listings accommodating 8+ guests (84.3%). This suggests the primary traveler segment is likely larger groups.
- Properties designed for 8+ guests and 6 guests dominate the Tunkhannock Township STR market, accounting for 93.1% of listings.
- 95.5% of properties accommodate 6+ guests, serving the market segment for larger families or group travel in Tunkhannock Township.
- On average, properties in Tunkhannock Township are equipped to host 7.6 guests.
Tunkhannock Township Airbnb Booking Patterns (2026): Available vs. Booked Days
Available Days Distribution
Booked Days Distribution
Booking Pattern Insights for Tunkhannock Township
- The most common availability pattern in Tunkhannock Township falls within the 181-270 days range, representing 46.6% of listings. This suggests many properties have significant open periods on their calendars.
- Approximately 83.5% of listings show high availability (181+ days open annually), indicating potential for increased bookings or specific owner usage patterns.
- For booked days, the 91-180 days range is most frequent in Tunkhannock Township (47%), reflecting common guest stay durations or potential owner blocking patterns.
- A notable 18.1% of properties secure long booking periods (181+ days booked per year), highlighting successful long-term rental strategies or significant owner usage.
Tunkhannock Township Airbnb Minimum Stay Requirements Analysis
Distribution of Listings by Minimum Night Requirement
1 Night
23 listings
9.2% of total
2 Nights
150 listings
60.2% of total
3 Nights
6 listings
2.4% of total
4-6 Nights
1 listings
0.4% of total
30+ Nights
69 listings
27.7% of total
Key Insights
- The most prevalent minimum stay requirement in Tunkhannock Township is 2 Nights, adopted by 60.2% of listings. This highlights the market's preference for shorter, flexible bookings.
- A strong majority (69.4%) of the Tunkhannock Township Airbnb data shows acceptance of very short stays (1-2 nights), indicating a dynamic, high-turnover market.
- A significant segment (27.7%) caters to monthly stays (30+ nights) in Tunkhannock Township, pointing to opportunities in the extended-stay market.
Recommendations
- Align with the market by considering a 2 Nights minimum stay, as 60.2% of Tunkhannock Township hosts use this setting.
- If feasible, allowing 1-night stays, especially midweek or during low season, could capture last-minute bookings, as only 9.2% currently do.
- A 2-night minimum appears standard (60.2%). Consider this for weekends or peak periods.
- Explore offering discounts for stays of 30+ nights to attract the 27.7% of the market seeking extended stays.
- Adjust minimum nights based on seasonality – potentially shorter during low season and longer during peak demand periods in Tunkhannock Township.
Tunkhannock Township Airbnb Cancellation Policy Trends Analysis (2026)
Super Strict 30 Days
5 listings
2% of total
Limited
11 listings
4.4% of total
Flexible
20 listings
8% of total
Moderate
65 listings
26.1% of total
Firm
99 listings
39.8% of total
Strict
49 listings
19.7% of total
Cancellation Policy Insights for Tunkhannock Township
- The prevailing Airbnb cancellation policy trend in Tunkhannock Township is Firm, used by 39.8% of listings.
- A majority (59.5%) of hosts in Tunkhannock Township utilize Firm or Strict policies, indicating a market where hosts prioritize booking security.
Recommendations for Hosts
- Consider adopting a Firm policy to align with the 39.8% market standard in Tunkhannock Township.
- Regularly review your cancellation policy against competitors and market demand shifts in Tunkhannock Township.
Tunkhannock Township STR Booking Lead Time Analysis (2026)
Average Booking Lead Time by Month
Booking Lead Time Insights for Tunkhannock Township
- The overall average booking lead time for vacation rentals in Tunkhannock Township is 43 days.
- Guests book furthest in advance for stays during June (average 71 days), likely coinciding with peak travel demand or local events.
- The shortest booking windows occur for stays in March (average 28 days), indicating more last-minute travel plans during this time.
- Seasonally, Summer (67 days avg.) sees the longest lead times, while Spring (33 days avg.) has the shortest, reflecting typical travel planning cycles.
Recommendations for Hosts
- Use the overall average lead time (43 days) as a baseline for your pricing and availability strategy in Tunkhannock Township.
- For June stays, consider implementing length-of-stay discounts or slightly higher rates for bookings made less than 71 days out to capitalize on advance planning.
- Target marketing efforts for the Summer season well in advance (at least 67 days) to capture early planners.
- Monitor your own booking lead times against these Tunkhannock Township averages to identify opportunities for dynamic pricing adjustments.
Popular & Essential Airbnb Amenities in Tunkhannock Township (2026)
Amenity Prevalence
Amenity Insights for Tunkhannock Township
- Essential amenities in Tunkhannock Township that guests expect include: Smoke alarm, Wifi, Kitchen, Heating, TV, Refrigerator, Carbon monoxide alarm, Hot water, Coffee maker, Free parking on premises. Lacking these (any) could significantly impact bookings.
Recommendations for Hosts
- Ensure your listing includes all essential amenities for Tunkhannock Township: Smoke alarm, Wifi, Kitchen, Heating, TV, Refrigerator, Carbon monoxide alarm, Hot water, Coffee maker, Free parking on premises.
- Prioritize adding missing essentials: Kitchen, Heating, TV, Refrigerator, Carbon monoxide alarm, Hot water, Coffee maker, Free parking on premises.
- Highlight unique or less common amenities you offer (e.g., hot tub, dedicated workspace, EV charger) in your listing description and photos.
- Regularly check competitor amenities in Tunkhannock Township to stay competitive.
Tunkhannock Township Airbnb Guest Demographics & Profile Analysis (2026)
Guest Profile Summary for Tunkhannock Township
- The typical guest profile for Airbnb in Tunkhannock Township consists of primarily domestic travelers (97%), often arriving from nearby New York, typically belonging to the Post-2000s (Gen Z/Alpha) group (50%), primarily speaking English or Spanish.
- Domestic travelers account for 96.9% of guests.
- Key international markets include United States (96.9%) and DC (0.9%).
- Top languages spoken are English (66.2%) followed by Spanish (18.4%).
- A significant demographic segment is the Post-2000s (Gen Z/Alpha) group, representing 50% of guests.
Recommendations for Hosts
- Target domestic marketing efforts towards travelers from New York and Philadelphia.
- Tailor amenities and listing descriptions to appeal to the dominant Post-2000s (Gen Z/Alpha) demographic (e.g., highlight fast WiFi, smart home features, local guides).
- Highlight unique local experiences or amenities relevant to the primary guest profile.
- Consider seasonal promotions aligned with peak travel times for key origin markets.
Nearby Short-Term Rental Market Comparison
How does the Tunkhannock Township Airbnb market stack up against its neighbors? Compare key performance metrics like average monthly revenue, ADR, and occupancy rates in surrounding areas to understand the broader regional STR landscape.
| Market | Active Properties | Monthly Revenue | Daily Rate | Avg. Occupancy |
|---|---|---|---|---|
| Freeland | 11 | $8,436 | $684.29 | 42% |
| Berlin Township | 15 | $7,208 | $729.10 | 35% |
| Polk Township | 15 | $6,974 | $520.26 | 38% |
| Town of Kingston | 10 | $6,470 | $473.76 | 49% |
| Frankford Township | 11 | $6,329 | $505.19 | 41% |
| Spring Lake Heights | 16 | $5,785 | $725.20 | 40% |
| Stroud Township | 137 | $5,728 | $478.40 | 40% |
| Town of Monroe | 22 | $5,690 | $720.52 | 37% |
| Hilltown Township | 11 | $5,557 | $578.96 | 40% |
| Town of Torrey | 34 | $5,535 | $437.35 | 50% |