South Hanover Township Airbnb Market Analysis 2026: Short Term Rental Data & Vacation Rental Statistics in Pennsylvania, United States
Is Airbnb profitable in South Hanover Township in 2026? Explore comprehensive Airbnb analytics for South Hanover Township, Pennsylvania, United States to uncover income potential. This 2026 STR market report for South Hanover Township, based on AirROI data from February 2025 to January 2026, reveals key trends in the niche market of 20 active listings.
Whether you're considering an Airbnb investment in South Hanover Township, optimizing your existing vacation rental, or exploring rental arbitrage opportunities, understanding the South Hanover Township Airbnb data is crucial. Leveraging the low regulation environment is key to maximizing your short term rental income potential. Let's dive into the specifics.
Key South Hanover Township Airbnb Performance Metrics Overview
Monthly Airbnb Revenue Variations & Income Potential in South Hanover Township (2026)
Understanding the monthly revenue variations for Airbnb listings in South Hanover Township is key to maximizing your short term rental income potential. Seasonality significantly impacts earnings. Our analysis, based on data from the past 12 months, shows that the peak revenue month for STRs in South Hanover Township is typically July, while March often presents the lowest earnings, highlighting opportunities for strategic pricing adjustments during shoulder and low seasons. Explore the typical Airbnb income in South Hanover Township across different performance tiers:
- Best-in-class properties (Top 10%) achieve $9,799+ monthly, often utilizing dynamic pricing and superior guest experiences.
- Strong performing properties (Top 25%) earn $6,836 or more, indicating effective management and desirable locations/amenities.
- Typical properties (Median) generate around $3,288 per month, representing the average market performance.
- Entry-level properties (Bottom 25%) see earnings around $1,574, often with potential for optimization.
Average Monthly Airbnb Earnings Trend in South Hanover Township
South Hanover Township Airbnb Occupancy Rate Trends (2026)
Maximize your bookings by understanding the South Hanover Township STR occupancy trends. Seasonal demand shifts significantly influence how often properties are booked. Typically, Julysees the highest demand (peak season occupancy), while April experiences the lowest (low season). Effective strategies, like adjusting minimum stays or offering promotions, can boost occupancy during slower periods. Here's how different property tiers perform in South Hanover Township:
- Best-in-class properties (Top 10%) achieve 74%+ occupancy, indicating high desirability and potentially optimized availability.
- Strong performing properties (Top 25%) maintain 57% or higher occupancy, suggesting good market fit and guest satisfaction.
- Typical properties (Median) have an occupancy rate around 38%.
- Entry-level properties (Bottom 25%) average 25% occupancy, potentially facing higher vacancy.
Average Monthly Occupancy Rate Trend in South Hanover Township
Average Daily Rate (ADR) Airbnb Trends in South Hanover Township (2026)
Effective short term rental pricing strategy in South Hanover Township involves understanding monthly ADR fluctuations. The Average Daily Rate (ADR) for Airbnb in South Hanover Township typically peaks in July and dips lowest during February. Leveraging Airbnb dynamic pricing tools or strategies based on this seasonality can significantly boost revenue. Here's a look at the typical nightly rates achieved:
- Best-in-class properties (Top 10%) command rates of $523+ per night, often due to premium features or locations.
- Strong performing properties (Top 25%) achieve nightly rates of $403 or more.
- Typical properties (Median) charge around $191 per night.
- Entry-level properties (Bottom 25%) earn around $94 per night.
Average Daily Rate (ADR) Trend by Month in South Hanover Township
Get Live South Hanover Township Market Intelligence 👇

Explore Real-time Analytics
Airbnb Seasonality Analysis & Trends in South Hanover Township (2026)
Peak Season (July, August, June)
- Revenue averages $10,708 per month
- Occupancy rates average 61.8%
- Daily rates average $364
Shoulder Season
- Revenue averages $4,975 per month
- Occupancy maintains around 37.9%
- Daily rates hold near $319
Low Season (February, March, April)
- Revenue drops to average $2,635 per month
- Occupancy decreases to average 31.3%
- Daily rates adjust to average $257
Seasonality Insights for South Hanover Township
- The Airbnb seasonality in South Hanover Township shows highly seasonal trends requiring careful strategy. While the sections above show seasonal averages, it's also insightful to look at the extremes:
- During the high season, the absolute peak month showcases South Hanover Township's highest earning potential, with monthly revenues capable of climbing to $12,167, occupancy reaching a high of 63.4%, and ADRs peaking at $371.
- Conversely, the slowest single month of the year, typically falling within the low season, marks the market's lowest point. In this month, revenue might dip to $2,250, occupancy could drop to 27.0%, and ADRs may adjust down to $251.
- Understanding both the seasonal averages and these monthly peaks and troughs in revenue, occupancy, and ADR is crucial for maximizing your Airbnb profit potential in South Hanover Township.
Seasonal Strategies for Maximizing Profit
- Peak Season: Maximize revenue through premium pricing and potentially longer minimum stays. Ensure high availability.
- Low Season: Offer competitive pricing, special promotions (e.g., extended stay discounts), and flexible cancellation policies. Target off-season travelers like remote workers or budget-conscious guests.
- Shoulder Seasons: Implement dynamic pricing that balances peak and low rates. Target weekend travelers or specific events. Offer slightly more flexible terms than peak season.
- Regularly analyze your own performance against these South Hanover Township seasonality benchmarks and adjust your pricing and availability strategy accordingly.
Best Areas for Airbnb Investment in South Hanover Township (2026)
Exploring the top neighborhoods for short-term rentals in South Hanover Township? This section highlights key areas, outlining why they are attractive for hosts and guests, along with notable local attractions. Consider these locations based on your target guest profile and investment strategy.
| Neighborhood / Area | Why Host Here? (Target Guests & Appeal) | Key Attractions & Landmarks |
|---|---|---|
| Harrisburg | The capital city of Pennsylvania, offering historical attractions, government buildings, and vibrant city life. A hub for business travelers and tourists visiting state institutions. | State Capitol Building, National Civil War Museum, Susquehanna River Walk, City Island, Whitaker Center for Science and the Arts |
| Lancaster | Known for its Amish community and rich cultural heritage, Lancaster attracts visitors interested in rural life, arts, and local crafts. Great for family and cultural tourism. | Lancaster Central Market, The Amish Farm and House, Sight & Sound Theatres, Lancaster County Park, Cherry Crest Adventure Farm |
| York | Rich in American history and heritage, York offers various historical sites and a vibrant downtown. It attracts history enthusiasts and families. | York County History Center, York Fairgrounds, Appell Center for the Performing Arts, Royal Square District, Bobcat's Playground |
| Gettysburg | Famous for its Civil War history, Gettysburg attracts tourists interested in the battlefield, history, and unique shops and restaurants. | Gettysburg National Military Park, Gettysburg Museum and Visitor Center, Eisenhower National Historic Site, Sachs Covered Bridge, Gettysburg Ghost Tours |
| Mechanicsburg | A charming suburb with a small-town feel, offering proximity to Harrisburg and outdoor activities. Ideal for families and travelers looking for a quieter stay. | Mechanicsburg Museum Association, Naylor Wine Cellars, Little Buffalo State Park, Mount Holly Springs, Cumberland Valley Rail Trail |
| Shippensburg | Home to Shippensburg University, this area attracts students and visitors, especially during university events and local festivals. | Shippensburg University, Shippensburg Railroad Museum, Norris S. B. Troupe Park, Shippensburg Historical Society, Shippensburg Community Pool |
| Carlisle | Known for its historic downtown and automotive history, Carlisle hosts numerous events and car shows, attracting visitors from all over. | Carlisle Fairgrounds, U.S. Army Heritage and Education Center, Cumberland County Historical Society, Carlisle Theatre, LeTort Spring Run |
| Camp Hill | A growing suburb with great amenities, Camp Hill attracts those looking for a suburban feel while being close to Harrisburg's attractions. | The West Shore Theater, Camp Hill Borough Park, Dauphin County Library, The Capital City Mall, Bitter Sweet Chocolates |
Understanding Airbnb License Requirements & STR Laws in South Hanover Township (2026)
While South Hanover Township, Pennsylvania, United States currently shows low STR regulations, specific Airbnb license requirements might still exist or change. Always verify the latest short term rental regulations and Airbnb license requirements directly with local government authorities for South Hanover Township to ensure full compliance before hosting.
(Source: AirROI data, 2026, finding no licensed listings among those analyzed)
Top Performing Airbnb Properties in South Hanover Township (2026)
Benchmark your potential! Explore examples of top-performing Airbnb properties in South Hanover Townshipbased on Trailing Twelve Month (TTM) revenue. Analyze their characteristics, revenue, occupancy rate, and ADR to understand what drives success in this market.
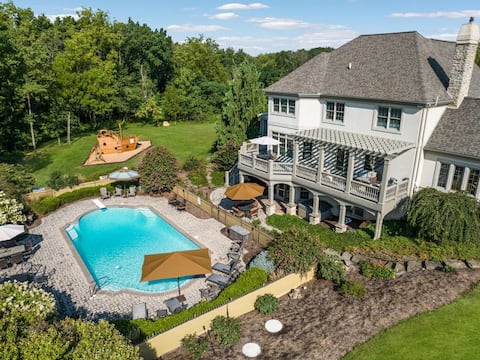
5 Star Family Hershey Retreat Pool Hot tub Theater
Entire Place • 7 bedrooms
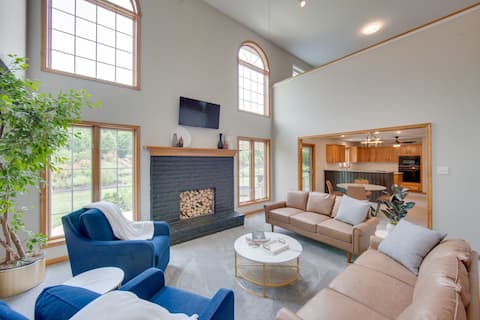
Game Room & Covered Patio: Hummelstown Hideaway
Entire Place • 5 bedrooms

"Grandview Saltwater Oasis | Minutes to Hershey"
Entire Place • 5 bedrooms

4 BR,4 Bath Hot tubMassageChairs4 miles to Hershey
Entire Place • 4 bedrooms

Super house
Entire Place • 5 bedrooms
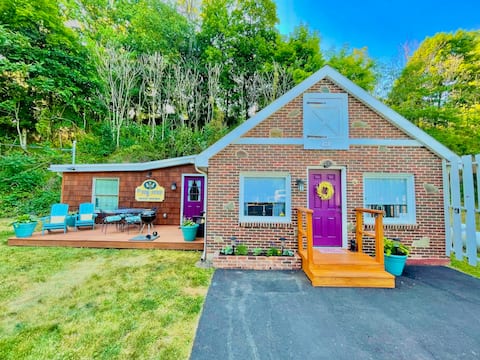
Cozy Corner Cottage - 2 bedroom home, pet friendly
Entire Place • 2 bedrooms
Note: Performance varies based on location, size, amenities, seasonality, and management quality. Data reflects the past 12 months.
Top Performing Airbnb Hosts in South Hanover Township (2026)
Learn from the best! This table showcases top-performing Airbnb hosts in South Hanover Township based on the number of properties managed and estimated total revenue over the past year. Analyze their scale and performance metrics.
| Host Name | Properties | Grossing Revenue | Stay Reviews | Avg Rating |
|---|---|---|---|---|
| Jeff | 1 | $345,281 | 43 | 5.00/5.0 |
| Evolve | 4 | $163,865 | 181 | 4.58/5.0 |
| Soe | 1 | $96,983 | 123 | 4.72/5.0 |
| James | 2 | $93,757 | 226 | 4.96/5.0 |
| Earl | 1 | $74,524 | 25 | 5.00/5.0 |
| Sang | 1 | $66,499 | 30 | 4.87/5.0 |
| Kay | 2 | $57,232 | 225 | 4.98/5.0 |
| Laura | 5 | $30,056 | 127 | 4.83/5.0 |
| Phil | 1 | $16,926 | 5 | 4.20/5.0 |
| Bonnie | 1 | $1,803 | 36 | 4.86/5.0 |
Analyzing the strategies of top hosts, such as their property selection, pricing, and guest communication, can offer valuable lessons for optimizing your own Airbnb operations in South Hanover Township.
Dive Deeper: Advanced South Hanover Township STR Market Data (2026)
Ready to unlock more insights? AirROI provides access to advanced metrics and comprehensive Airbnb data for South Hanover Township. Explore detailed analytics beyond this report to refine your investment strategy, optimize pricing, and maximize your vacation rental profits.
Explore Advanced MetricsSouth Hanover Township Short-Term Rental Market Composition (2026): Property & Room Types
Room Type Distribution
Property Type Distribution
Market Composition Insights for South Hanover Township
- The South Hanover Township Airbnb market composition is heavily skewed towards Entire Home/Apt listings, which make up 95% of the 20 active rentals. This indicates strong guest preference for privacy and space.
- Looking at the property type distribution in South Hanover Township, House properties are the most common (60%), reflecting the local real estate landscape.
- Houses represent a significant 60% portion, catering likely to families or larger groups.
South Hanover Township Airbnb Room Capacity Analysis (2026): Bedroom Distribution
Distribution of Listings by Number of Bedrooms
Room Capacity Insights for South Hanover Township
- The dominant room capacity in South Hanover Township is 2 bedrooms listings, making up 35% of the market. This suggests a strong demand for properties suitable for couples or solo travelers.
- Together, 2 bedrooms and 5+ bedrooms properties represent 65.0% of the active Airbnb listings in South Hanover Township, indicating a high concentration in these sizes.
- A significant 45.0% of listings offer 3+ bedrooms, catering to larger groups and families seeking more space in South Hanover Township.
South Hanover Township Vacation Rental Guest Capacity Trends (2026)
Distribution of Listings by Guest Capacity
Guest Capacity Insights for South Hanover Township
- The most common guest capacity trend in South Hanover Township vacation rentals is listings accommodating 8+ guests (45%). This suggests the primary traveler segment is likely larger groups.
- Properties designed for 8+ guests and 2 guests dominate the South Hanover Township STR market, accounting for 60.0% of listings.
- 60.0% of properties accommodate 6+ guests, serving the market segment for larger families or group travel in South Hanover Township.
- On average, properties in South Hanover Township are equipped to host 5.4 guests.
South Hanover Township Airbnb Booking Patterns (2026): Available vs. Booked Days
Available Days Distribution
Booked Days Distribution
Booking Pattern Insights for South Hanover Township
- The most common availability pattern in South Hanover Township falls within the 181-270 days range, representing 50% of listings. This suggests many properties have significant open periods on their calendars.
- Approximately 85.0% of listings show high availability (181+ days open annually), indicating potential for increased bookings or specific owner usage patterns.
- For booked days, the 91-180 days range is most frequent in South Hanover Township (50%), reflecting common guest stay durations or potential owner blocking patterns.
- A notable 15.0% of properties secure long booking periods (181+ days booked per year), highlighting successful long-term rental strategies or significant owner usage.
South Hanover Township Airbnb Minimum Stay Requirements Analysis
Distribution of Listings by Minimum Night Requirement
1 Night
3 listings
15% of total
2 Nights
4 listings
20% of total
7-29 Nights
1 listings
5% of total
30+ Nights
12 listings
60% of total
Key Insights
- The most prevalent minimum stay requirement in South Hanover Township is 30+ Nights, adopted by 60% of listings. This highlights the market's preference for longer commitments.
- A significant segment (60%) caters to monthly stays (30+ nights) in South Hanover Township, pointing to opportunities in the extended-stay market.
Recommendations
- Align with the market by considering a 30+ Nights minimum stay, as 60% of South Hanover Township hosts use this setting.
- If feasible, allowing 1-night stays, especially midweek or during low season, could capture last-minute bookings, as only 15% currently do.
- Explore offering discounts for stays of 30+ nights to attract the 60% of the market seeking extended stays.
- Adjust minimum nights based on seasonality – potentially shorter during low season and longer during peak demand periods in South Hanover Township.
South Hanover Township Airbnb Cancellation Policy Trends Analysis (2026)
Flexible
1 listings
5% of total
Moderate
8 listings
40% of total
Firm
8 listings
40% of total
Strict
3 listings
15% of total
Cancellation Policy Insights for South Hanover Township
- The prevailing Airbnb cancellation policy trend in South Hanover Township is Moderate, used by 40% of listings.
- A majority (55.0%) of hosts in South Hanover Township utilize Firm or Strict policies, indicating a market where hosts prioritize booking security.
Recommendations for Hosts
- Consider adopting a Moderate policy to align with the 40% market standard in South Hanover Township.
- Regularly review your cancellation policy against competitors and market demand shifts in South Hanover Township.
South Hanover Township STR Booking Lead Time Analysis (2026)
Average Booking Lead Time by Month
Booking Lead Time Insights for South Hanover Township
- The overall average booking lead time for vacation rentals in South Hanover Township is 65 days.
- Guests book furthest in advance for stays during July (average 113 days), likely coinciding with peak travel demand or local events.
- The shortest booking windows occur for stays in January (average 26 days), indicating more last-minute travel plans during this time.
- Seasonally, Summer (104 days avg.) sees the longest lead times, while Winter (50 days avg.) has the shortest, reflecting typical travel planning cycles.
Recommendations for Hosts
- Use the overall average lead time (65 days) as a baseline for your pricing and availability strategy in South Hanover Township.
- For July stays, consider implementing length-of-stay discounts or slightly higher rates for bookings made less than 113 days out to capitalize on advance planning.
- Target marketing efforts for the Summer season well in advance (at least 104 days) to capture early planners.
- Monitor your own booking lead times against these South Hanover Township averages to identify opportunities for dynamic pricing adjustments.
Popular & Essential Airbnb Amenities in South Hanover Township (2026)
Amenity Prevalence
Amenity Insights for South Hanover Township
- Essential amenities in South Hanover Township that guests expect include: Free parking on premises, Wifi, TV, Air conditioning, Coffee maker, Smoke alarm, Heating, Refrigerator, Kitchen, Hot water. Lacking these (any) could significantly impact bookings.
Recommendations for Hosts
- Ensure your listing includes all essential amenities for South Hanover Township: Free parking on premises, Wifi, TV, Air conditioning, Coffee maker, Smoke alarm, Heating, Refrigerator, Kitchen, Hot water.
- Prioritize adding missing essentials: Coffee maker, Smoke alarm, Heating, Refrigerator, Kitchen, Hot water.
- Highlight unique or less common amenities you offer (e.g., hot tub, dedicated workspace, EV charger) in your listing description and photos.
- Regularly check competitor amenities in South Hanover Township to stay competitive.
South Hanover Township Airbnb Guest Demographics & Profile Analysis (2026)
Guest Profile Summary for South Hanover Township
- The typical guest profile for Airbnb in South Hanover Township consists of primarily domestic travelers (95%), often arriving from nearby New York, typically belonging to the Post-2000s (Gen Z/Alpha) group (50%), primarily speaking English or Spanish.
- Domestic travelers account for 94.8% of guests.
- Key international markets include United States (94.8%) and DC (2.2%).
- Top languages spoken are English (76.6%) followed by Spanish (12.5%).
- A significant demographic segment is the Post-2000s (Gen Z/Alpha) group, representing 50% of guests.
Recommendations for Hosts
- Target domestic marketing efforts towards travelers from New York and Pittsburgh.
- Tailor amenities and listing descriptions to appeal to the dominant Post-2000s (Gen Z/Alpha) demographic (e.g., highlight fast WiFi, smart home features, local guides).
- Highlight unique local experiences or amenities relevant to the primary guest profile.
- Consider seasonal promotions aligned with peak travel times for key origin markets.
Nearby Short-Term Rental Market Comparison
How does the South Hanover Township Airbnb market stack up against its neighbors? Compare key performance metrics like average monthly revenue, ADR, and occupancy rates in surrounding areas to understand the broader regional STR landscape.
| Market | Active Properties | Monthly Revenue | Daily Rate | Avg. Occupancy |
|---|---|---|---|---|
| Freeland | 11 | $8,436 | $684.29 | 42% |
| Berlin Township | 15 | $7,208 | $729.10 | 35% |
| Polk Township | 15 | $6,974 | $520.26 | 38% |
| Lemont | 21 | $6,940 | $873.93 | 37% |
| College Township | 83 | $6,551 | $848.63 | 36% |
| Centreville | 17 | $6,298 | $565.66 | 45% |
| State College | 192 | $6,081 | $712.29 | 40% |
| Shannondale | 45 | $5,808 | $337.30 | 54% |
| Stroud Township | 137 | $5,728 | $478.40 | 40% |
| Hilltown Township | 11 | $5,557 | $578.96 | 40% |