Potter Township Airbnb Market Analysis 2026: Short Term Rental Data & Vacation Rental Statistics in Pennsylvania, United States
Is Airbnb profitable in Potter Township in 2026? Explore comprehensive Airbnb analytics for Potter Township, Pennsylvania, United States to uncover income potential. This 2026 STR market report for Potter Township, based on AirROI data from February 2025 to January 2026, reveals key trends in the niche market of 67 active listings.
Whether you're considering an Airbnb investment in Potter Township, optimizing your existing vacation rental, or exploring rental arbitrage opportunities, understanding the Potter Township Airbnb data is crucial. Leveraging the low regulation environment is key to maximizing your short term rental income potential. Let's dive into the specifics.
Key Potter Township Airbnb Performance Metrics Overview
Monthly Airbnb Revenue Variations & Income Potential in Potter Township (2026)
Understanding the monthly revenue variations for Airbnb listings in Potter Township is key to maximizing your short term rental income potential. Seasonality significantly impacts earnings. Our analysis, based on data from the past 12 months, shows that the peak revenue month for STRs in Potter Township is typically August, while January often presents the lowest earnings, highlighting opportunities for strategic pricing adjustments during shoulder and low seasons. Explore the typical Airbnb income in Potter Township across different performance tiers:
- Best-in-class properties (Top 10%) achieve $7,279+ monthly, often utilizing dynamic pricing and superior guest experiences.
- Strong performing properties (Top 25%) earn $3,247 or more, indicating effective management and desirable locations/amenities.
- Typical properties (Median) generate around $1,588 per month, representing the average market performance.
- Entry-level properties (Bottom 25%) see earnings around $796, often with potential for optimization.
Average Monthly Airbnb Earnings Trend in Potter Township
Potter Township Airbnb Occupancy Rate Trends (2026)
Maximize your bookings by understanding the Potter Township STR occupancy trends. Seasonal demand shifts significantly influence how often properties are booked. Typically, Augustsees the highest demand (peak season occupancy), while January experiences the lowest (low season). Effective strategies, like adjusting minimum stays or offering promotions, can boost occupancy during slower periods. Here's how different property tiers perform in Potter Township:
- Best-in-class properties (Top 10%) achieve 56%+ occupancy, indicating high desirability and potentially optimized availability.
- Strong performing properties (Top 25%) maintain 41% or higher occupancy, suggesting good market fit and guest satisfaction.
- Typical properties (Median) have an occupancy rate around 25%.
- Entry-level properties (Bottom 25%) average 15% occupancy, potentially facing higher vacancy.
Average Monthly Occupancy Rate Trend in Potter Township
Average Daily Rate (ADR) Airbnb Trends in Potter Township (2026)
Effective short term rental pricing strategy in Potter Township involves understanding monthly ADR fluctuations. The Average Daily Rate (ADR) for Airbnb in Potter Township typically peaks in September and dips lowest during February. Leveraging Airbnb dynamic pricing tools or strategies based on this seasonality can significantly boost revenue. Here's a look at the typical nightly rates achieved:
- Best-in-class properties (Top 10%) command rates of $612+ per night, often due to premium features or locations.
- Strong performing properties (Top 25%) achieve nightly rates of $395 or more.
- Typical properties (Median) charge around $202 per night.
- Entry-level properties (Bottom 25%) earn around $142 per night.
Average Daily Rate (ADR) Trend by Month in Potter Township
Get Live Potter Township Market Intelligence 👇
Explore Real-time Analytics
Airbnb Seasonality Analysis & Trends in Potter Township (2026)
Peak Season (August, April, September)
- Revenue averages $3,998 per month
- Occupancy rates average 35.9%
- Daily rates average $315
Shoulder Season
- Revenue averages $3,118 per month
- Occupancy maintains around 30.8%
- Daily rates hold near $312
Low Season (January, February, March)
- Revenue drops to average $1,699 per month
- Occupancy decreases to average 22.6%
- Daily rates adjust to average $297
Seasonality Insights for Potter Township
- The Airbnb seasonality in Potter Township shows highly seasonal trends requiring careful strategy. While the sections above show seasonal averages, it's also insightful to look at the extremes:
- During the high season, the absolute peak month showcases Potter Township's highest earning potential, with monthly revenues capable of climbing to $4,299, occupancy reaching a high of 43.3%, and ADRs peaking at $326.
- Conversely, the slowest single month of the year, typically falling within the low season, marks the market's lowest point. In this month, revenue might dip to $1,439, occupancy could drop to 17.6%, and ADRs may adjust down to $295.
- Understanding both the seasonal averages and these monthly peaks and troughs in revenue, occupancy, and ADR is crucial for maximizing your Airbnb profit potential in Potter Township.
Seasonal Strategies for Maximizing Profit
- Peak Season: Maximize revenue through premium pricing and potentially longer minimum stays. Ensure high availability.
- Low Season: Offer competitive pricing, special promotions (e.g., extended stay discounts), and flexible cancellation policies. Target off-season travelers like remote workers or budget-conscious guests.
- Shoulder Seasons: Implement dynamic pricing that balances peak and low rates. Target weekend travelers or specific events. Offer slightly more flexible terms than peak season.
- Regularly analyze your own performance against these Potter Township seasonality benchmarks and adjust your pricing and availability strategy accordingly.
Best Areas for Airbnb Investment in Potter Township (2026)
Exploring the top neighborhoods for short-term rentals in Potter Township? This section highlights key areas, outlining why they are attractive for hosts and guests, along with notable local attractions. Consider these locations based on your target guest profile and investment strategy.
| Neighborhood / Area | Why Host Here? (Target Guests & Appeal) | Key Attractions & Landmarks |
|---|---|---|
| Lake Harmony | A popular year-round destination known for its beautiful lake, ski resorts, and hiking trails. Perfect for outdoor enthusiasts and families seeking relaxation and adventure. | Big Boulder Lake, Lake Harmony, Jack Frost Ski Resort, Pinecrest Lake, Hickory Run State Park |
| The Poconos | A renowned vacation destination offering a variety of recreational activities. Ideal for both summer and winter getaways, attracting families and couples alike. | Camelback Mountain Resort, Delaware Water Gap, The Great Wolf Lodge, Kalahari Resorts, Poconos Mountains |
| Harrisburg | The state capital with rich history and cultural attractions. Great for business travelers and those visiting for events and conferences. | Pennsylvania State Capitol, The National Civil War Museum, Susquehanna Art Museum, City Island, Wildwood Park |
| Gettysburg | A historic town known for its Civil War significance, attracting history buffs and tourists. Ideal for short-term rentals during peak tourist seasons. | Gettysburg National Military Park, Gettysburg Museum of History, Eisenhower National Historic Site, David Wills House, Gettysburg Heritage Center |
| Lancaster | Known for its Amish community and rich agricultural landscape. Offers a unique cultural experience with a strong tourism market. | Amish Farm and House, Dutch Wonderland, Lancaster Central Market, The Amish Village, American Music Theatre |
| New Hope | A charming town along the Delaware River, known for its arts scene and quaint shops. Popular with weekend travelers from nearby cities. | Bucks County Playhouse, Delaware Canal State Park, New Hope Arts Center, Parry Mansion, New Hope Railroad |
| York | A city rich in history with a growing brewery scene. Attracts both history lovers and foodies looking for a unique culinary experience. | York County History Center, The Harley-Davidson Museum, York City Ice Arena, Codorus State Park, Central Market |
| State College | Home to Penn State University, this town attracts students, parents, and alumni. Ideal for short-term rentals around university events and sporting activities. | Penn State University, Beaver Stadium, Jordans Way, Mount Nittany, The Arboretum at Penn State |
Understanding Airbnb License Requirements & STR Laws in Potter Township (2026)
While Potter Township, Pennsylvania, United States currently shows low STR regulations, specific Airbnb license requirements might still exist or change. Always verify the latest short term rental regulations and Airbnb license requirements directly with local government authorities for Potter Township to ensure full compliance before hosting.
(Source: AirROI data, 2026, finding no licensed listings among those analyzed)
Top Performing Airbnb Properties in Potter Township (2026)
Benchmark your potential! Explore examples of top-performing Airbnb properties in Potter Townshipbased on Trailing Twelve Month (TTM) revenue. Analyze their characteristics, revenue, occupancy rate, and ADR to understand what drives success in this market.
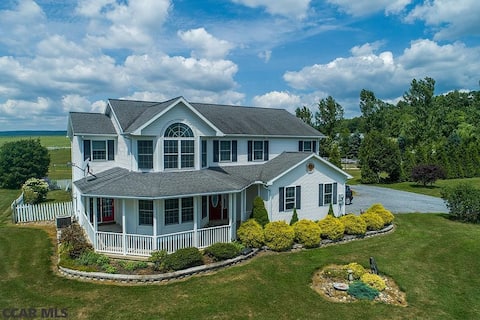
Tranquil family horse farm
Entire Place • 4 bedrooms
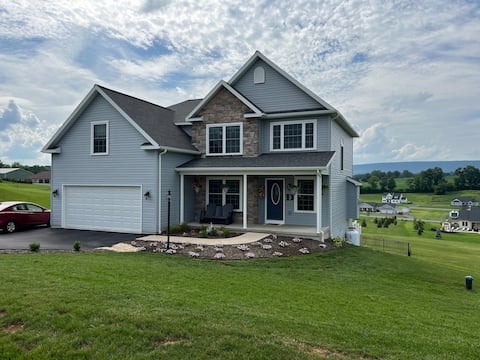
Amazing Home, Amazing View! Quiet Neighborhood!
Entire Place • 5 bedrooms

Cozy stay on WhippoorHill
Entire Place • 3 bedrooms
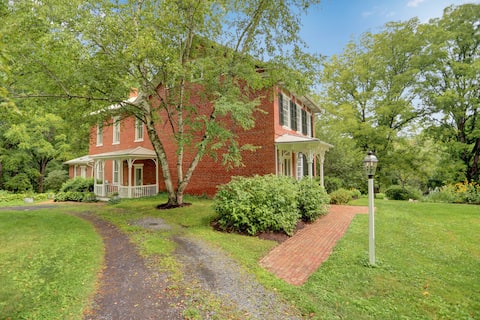
Historic Farmhouse on 12 acres near State College
Entire Place • 6 bedrooms

Near Penn State-2 bedrm, 2 bath
Entire Place • 2 bedrooms
Hidden Hollow Cabin - Close to State College
Entire Place • 5 bedrooms
Note: Performance varies based on location, size, amenities, seasonality, and management quality. Data reflects the past 12 months.
Top Performing Airbnb Hosts in Potter Township (2026)
Learn from the best! This table showcases top-performing Airbnb hosts in Potter Township based on the number of properties managed and estimated total revenue over the past year. Analyze their scale and performance metrics.
| Host Name | Properties | Grossing Revenue | Stay Reviews | Avg Rating |
|---|---|---|---|---|
| Kelli | 1 | $196,988 | 23 | 5.00/5.0 |
| Seven Mountains | 18 | $168,181 | 168 | 4.67/5.0 |
| Aaron | 1 | $160,770 | 8 | 4.88/5.0 |
| Scott | 4 | $115,083 | 124 | 4.91/5.0 |
| Nicole | 2 | $110,166 | 104 | 4.95/5.0 |
| Kelley | 1 | $98,567 | 7 | 5.00/5.0 |
| Binky | 1 | $84,912 | 21 | 5.00/5.0 |
| Rachel | 5 | $82,340 | 114 | 4.88/5.0 |
| Dean | 1 | $68,994 | 54 | 5.00/5.0 |
| Lynn | 1 | $60,826 | 9 | 4.89/5.0 |
Analyzing the strategies of top hosts, such as their property selection, pricing, and guest communication, can offer valuable lessons for optimizing your own Airbnb operations in Potter Township.
Dive Deeper: Advanced Potter Township STR Market Data (2026)
Ready to unlock more insights? AirROI provides access to advanced metrics and comprehensive Airbnb data for Potter Township. Explore detailed analytics beyond this report to refine your investment strategy, optimize pricing, and maximize your vacation rental profits.
Explore Advanced MetricsPotter Township Short-Term Rental Market Composition (2026): Property & Room Types
Room Type Distribution
Property Type Distribution
Market Composition Insights for Potter Township
- The Potter Township Airbnb market composition is heavily skewed towards Entire Home/Apt listings, which make up 91% of the 67 active rentals. This indicates strong guest preference for privacy and space.
- Looking at the property type distribution in Potter Township, Outdoor/Unique properties are the most common (41.8%), reflecting the local real estate landscape.
- Houses represent a significant 41.8% portion, catering likely to families or larger groups.
- Smaller segments like hotel/boutique (combined 4.5%) offer potential for unique stay experiences.
Potter Township Airbnb Room Capacity Analysis (2026): Bedroom Distribution
Distribution of Listings by Number of Bedrooms
Room Capacity Insights for Potter Township
- The dominant room capacity in Potter Township is 1 bedroom listings, making up 35.8% of the market. This suggests a strong demand for properties suitable for couples or solo travelers.
- Together, 1 bedroom and 2 bedrooms properties represent 55.2% of the active Airbnb listings in Potter Township, indicating a high concentration in these sizes.
- A significant 32.9% of listings offer 3+ bedrooms, catering to larger groups and families seeking more space in Potter Township.
Potter Township Vacation Rental Guest Capacity Trends (2026)
Distribution of Listings by Guest Capacity
Guest Capacity Insights for Potter Township
- The most common guest capacity trend in Potter Township vacation rentals is listings accommodating 6 guests (22.4%). This suggests the primary traveler segment is likely larger groups.
- Properties designed for 6 guests and 8+ guests dominate the Potter Township STR market, accounting for 43.3% of listings.
- 46.3% of properties accommodate 6+ guests, serving the market segment for larger families or group travel in Potter Township.
- On average, properties in Potter Township are equipped to host 5.1 guests.
Potter Township Airbnb Booking Patterns (2026): Available vs. Booked Days
Available Days Distribution
Booked Days Distribution
Booking Pattern Insights for Potter Township
- The most common availability pattern in Potter Township falls within the 271-366 days range, representing 61.2% of listings. This suggests many properties have significant open periods on their calendars.
- Approximately 94.0% of listings show high availability (181+ days open annually), indicating potential for increased bookings or specific owner usage patterns.
- For booked days, the 31-90 days range is most frequent in Potter Township (46.3%), reflecting common guest stay durations or potential owner blocking patterns.
- A notable 6.0% of properties secure long booking periods (181+ days booked per year), highlighting successful long-term rental strategies or significant owner usage.
Potter Township Airbnb Minimum Stay Requirements Analysis
Distribution of Listings by Minimum Night Requirement
1 Night
40 listings
59.7% of total
2 Nights
20 listings
29.9% of total
30+ Nights
7 listings
10.4% of total
Key Insights
- The most prevalent minimum stay requirement in Potter Township is 1 Night, adopted by 59.7% of listings. This highlights the market's preference for shorter, flexible bookings.
- A strong majority (89.6%) of the Potter Township Airbnb data shows acceptance of very short stays (1-2 nights), indicating a dynamic, high-turnover market.
- A significant segment (10.4%) caters to monthly stays (30+ nights) in Potter Township, pointing to opportunities in the extended-stay market.
Recommendations
- Align with the market by considering a 1 Night minimum stay, as 59.7% of Potter Township hosts use this setting.
- Explore offering discounts for stays of 30+ nights to attract the 10.4% of the market seeking extended stays.
- Adjust minimum nights based on seasonality – potentially shorter during low season and longer during peak demand periods in Potter Township.
Potter Township Airbnb Cancellation Policy Trends Analysis (2026)
Limited
2 listings
3% of total
Flexible
12 listings
17.9% of total
Moderate
27 listings
40.3% of total
Firm
22 listings
32.8% of total
Strict
4 listings
6% of total
Cancellation Policy Insights for Potter Township
- The prevailing Airbnb cancellation policy trend in Potter Township is Moderate, used by 40.3% of listings.
- There's a relatively balanced mix between guest-friendly (58.2%) and stricter (38.8%) policies, offering choices for different guest needs.
- Strict cancellation policies are quite rare (6%), potentially making listings with this policy less competitive unless justified by high demand or property type.
Recommendations for Hosts
- Consider adopting a Moderate policy to align with the 40.3% market standard in Potter Township.
- Using a Strict policy might deter some guests, as only 6% of listings use it. Evaluate if potential revenue protection outweighs possible lower booking rates.
- Regularly review your cancellation policy against competitors and market demand shifts in Potter Township.
Potter Township STR Booking Lead Time Analysis (2026)
Average Booking Lead Time by Month
Booking Lead Time Insights for Potter Township
- The overall average booking lead time for vacation rentals in Potter Township is 82 days.
- Guests book furthest in advance for stays during May (average 130 days), likely coinciding with peak travel demand or local events.
- The shortest booking windows occur for stays in February (average 32 days), indicating more last-minute travel plans during this time.
- Seasonally, Fall (107 days avg.) sees the longest lead times, while Winter (48 days avg.) has the shortest, reflecting typical travel planning cycles.
Recommendations for Hosts
- Use the overall average lead time (82 days) as a baseline for your pricing and availability strategy in Potter Township.
- For May stays, consider implementing length-of-stay discounts or slightly higher rates for bookings made less than 130 days out to capitalize on advance planning.
- Target marketing efforts for the Fall season well in advance (at least 107 days) to capture early planners.
- Monitor your own booking lead times against these Potter Township averages to identify opportunities for dynamic pricing adjustments.
Popular & Essential Airbnb Amenities in Potter Township (2026)
Amenity Prevalence
Amenity Insights for Potter Township
- Essential amenities in Potter Township that guests expect include: Smoke alarm. Lacking these (this) could significantly impact bookings.
- Popular amenities like Free parking on premises, Air conditioning, Heating are common but not universal. Offering these can provide a competitive edge.
- Warning: Wifi is not universally provided but is considered essential globally. Ensure reliable Wifi is offered.
Recommendations for Hosts
- Ensure your listing includes all essential amenities for Potter Township: Smoke alarm.
- Consider adding popular differentiators like Free parking on premises or Air conditioning to increase appeal.
- Highlight unique or less common amenities you offer (e.g., hot tub, dedicated workspace, EV charger) in your listing description and photos.
- Regularly check competitor amenities in Potter Township to stay competitive.
Potter Township Airbnb Guest Demographics & Profile Analysis (2026)
Guest Profile Summary for Potter Township
- The typical guest profile for Airbnb in Potter Township consists of primarily domestic travelers (98%), often arriving from nearby Philadelphia, typically belonging to the Post-2000s (Gen Z/Alpha) group (50%), primarily speaking English or Spanish.
- Domestic travelers account for 98.2% of guests.
- Key international markets include United States (98.2%) and DC (0.5%).
- Top languages spoken are English (81.7%) followed by Spanish (5.8%).
- A significant demographic segment is the Post-2000s (Gen Z/Alpha) group, representing 50% of guests.
Recommendations for Hosts
- Target domestic marketing efforts towards travelers from Philadelphia and Pittsburgh.
- Tailor amenities and listing descriptions to appeal to the dominant Post-2000s (Gen Z/Alpha) demographic (e.g., highlight fast WiFi, smart home features, local guides).
- Highlight unique local experiences or amenities relevant to the primary guest profile.
- Consider seasonal promotions aligned with peak travel times for key origin markets.
Nearby Short-Term Rental Market Comparison
How does the Potter Township Airbnb market stack up against its neighbors? Compare key performance metrics like average monthly revenue, ADR, and occupancy rates in surrounding areas to understand the broader regional STR landscape.
| Market | Active Properties | Monthly Revenue | Daily Rate | Avg. Occupancy |
|---|---|---|---|---|
| Polk Township | 15 | $6,974 | $520.26 | 38% |
| Lemont | 21 | $6,940 | $873.93 | 37% |
| College Township | 83 | $6,551 | $848.63 | 36% |
| Centreville | 17 | $6,298 | $565.66 | 45% |
| State College | 192 | $6,081 | $712.29 | 40% |
| Shannondale | 45 | $5,808 | $337.30 | 54% |
| Hellam Township | 24 | $5,496 | $386.69 | 45% |
| Ferguson Township | 126 | $5,115 | $800.25 | 36% |
| Lower Windsor Township | 14 | $5,062 | $428.71 | 45% |
| Bethel Township | 25 | $4,863 | $320.23 | 52% |