Philadelphia Airbnb Market Analysis 2026: Short Term Rental Data & Vacation Rental Statistics in Pennsylvania, United States
Is Airbnb profitable in Philadelphia in 2026? Explore comprehensive Airbnb analytics for Philadelphia, Pennsylvania, United States to uncover income potential. This 2026 STR market report for Philadelphia, based on AirROI data from February 2025 to January 2026, reveals key trends in the bustling market of 4,449 active listings.
Whether you're considering an Airbnb investment in Philadelphia, optimizing your existing vacation rental, or exploring rental arbitrage opportunities, understanding the Philadelphia Airbnb data is crucial. Navigating the high regulation landscape is key to maximizing your short term rental income potential. Let's dive into the specifics.
Key Philadelphia Airbnb Performance Metrics Overview
Monthly Airbnb Revenue Variations & Income Potential in Philadelphia (2026)
Understanding the monthly revenue variations for Airbnb listings in Philadelphia is key to maximizing your short term rental income potential. Seasonality significantly impacts earnings. Our analysis, based on data from the past 12 months, shows that the peak revenue month for STRs in Philadelphia is typically October, while February often presents the lowest earnings, highlighting opportunities for strategic pricing adjustments during shoulder and low seasons. Explore the typical Airbnb income in Philadelphia across different performance tiers:
- Best-in-class properties (Top 10%) achieve $5,257+ monthly, often utilizing dynamic pricing and superior guest experiences.
- Strong performing properties (Top 25%) earn $3,351 or more, indicating effective management and desirable locations/amenities.
- Typical properties (Median) generate around $1,807 per month, representing the average market performance.
- Entry-level properties (Bottom 25%) see earnings around $809, often with potential for optimization.
Average Monthly Airbnb Earnings Trend in Philadelphia
Philadelphia Airbnb Occupancy Rate Trends (2026)
Maximize your bookings by understanding the Philadelphia STR occupancy trends. Seasonal demand shifts significantly influence how often properties are booked. Typically, Junesees the highest demand (peak season occupancy), while January experiences the lowest (low season). Effective strategies, like adjusting minimum stays or offering promotions, can boost occupancy during slower periods. Here's how different property tiers perform in Philadelphia:
- Best-in-class properties (Top 10%) achieve 82%+ occupancy, indicating high desirability and potentially optimized availability.
- Strong performing properties (Top 25%) maintain 66% or higher occupancy, suggesting good market fit and guest satisfaction.
- Typical properties (Median) have an occupancy rate around 43%.
- Entry-level properties (Bottom 25%) average 21% occupancy, potentially facing higher vacancy.
Average Monthly Occupancy Rate Trend in Philadelphia
Average Daily Rate (ADR) Airbnb Trends in Philadelphia (2026)
Effective short term rental pricing strategy in Philadelphia involves understanding monthly ADR fluctuations. The Average Daily Rate (ADR) for Airbnb in Philadelphia typically peaks in November and dips lowest during February. Leveraging Airbnb dynamic pricing tools or strategies based on this seasonality can significantly boost revenue. Here's a look at the typical nightly rates achieved:
- Best-in-class properties (Top 10%) command rates of $293+ per night, often due to premium features or locations.
- Strong performing properties (Top 25%) achieve nightly rates of $199 or more.
- Typical properties (Median) charge around $123 per night.
- Entry-level properties (Bottom 25%) earn around $74 per night.
Average Daily Rate (ADR) Trend by Month in Philadelphia
Get Live Philadelphia Market Intelligence 👇

Explore Real-time Analytics
Airbnb Seasonality Analysis & Trends in Philadelphia (2026)
Peak Season (October, November, June)
- Revenue averages $2,880 per month
- Occupancy rates average 47.3%
- Daily rates average $171
Shoulder Season
- Revenue averages $2,536 per month
- Occupancy maintains around 44.6%
- Daily rates hold near $160
Low Season (January, February, March)
- Revenue drops to average $1,908 per month
- Occupancy decreases to average 41.7%
- Daily rates adjust to average $145
Seasonality Insights for Philadelphia
- The Airbnb seasonality in Philadelphia shows moderate seasonality with distinct peak and low periods. While the sections above show seasonal averages, it's also insightful to look at the extremes:
- During the high season, the absolute peak month showcases Philadelphia's highest earning potential, with monthly revenues capable of climbing to $2,942, occupancy reaching a high of 49.2%, and ADRs peaking at $175.
- Conversely, the slowest single month of the year, typically falling within the low season, marks the market's lowest point. In this month, revenue might dip to $1,740, occupancy could drop to 33.9%, and ADRs may adjust down to $138.
- Understanding both the seasonal averages and these monthly peaks and troughs in revenue, occupancy, and ADR is crucial for maximizing your Airbnb profit potential in Philadelphia.
Seasonal Strategies for Maximizing Profit
- Peak Season: Maximize revenue through premium pricing and potentially longer minimum stays. Ensure high availability.
- Low Season: Offer competitive pricing, special promotions (e.g., extended stay discounts), and flexible cancellation policies. Target off-season travelers like remote workers or budget-conscious guests.
- Shoulder Seasons: Implement dynamic pricing that balances peak and low rates. Target weekend travelers or specific events. Offer slightly more flexible terms than peak season.
- Regularly analyze your own performance against these Philadelphia seasonality benchmarks and adjust your pricing and availability strategy accordingly.
Best Areas for Airbnb Investment in Philadelphia (2026)
Exploring the top neighborhoods for short-term rentals in Philadelphia? This section highlights key areas, outlining why they are attractive for hosts and guests, along with notable local attractions. Consider these locations based on your target guest profile and investment strategy.
| Neighborhood / Area | Why Host Here? (Target Guests & Appeal) | Key Attractions & Landmarks |
|---|---|---|
| Center City | The heart of Philadelphia, known for its cultural attractions, dining, and shopping. Ideal for tourists wanting to explore the city's historical sites, museums, and nightlife. | Liberty Bell, Philadelphia Museum of Art, Reading Terminal Market, Independence Hall, City Hall, Rittenhouse Square |
| Old City | Historic district with cobblestone streets and a vibrant arts scene. Popular with visitors interested in Philadelphia's rich history and close to numerous restaurants and bars. | Independence National Historical Park, Elfreth's Alley, National Museum of American Jewish History, Betsy Ross House, Franklin Square, Philadelphia Chocolate Tours |
| University City | Home to major universities and hospitals, this area attracts students, faculty, and healthcare professionals. A dynamic neighborhood with a youthful vibe and plenty of eateries. | University of Pennsylvania, Drexel University, Penn Museum, Institute of Contemporary Art, Parks on the Parkway, Spruce Street Harbor Park |
| Fishtown | An up-and-coming neighborhood with a trendy atmosphere, Fishtown is known for its music scene and artsy vibe. Attractive to young professionals and hipsters. | Frankford Avenue Art Corridor, Kensington Market, Loco Pez, The Fillmore Philadelphia, Riverwards Produce, Graffiti Pier |
| Manayunk | Charming neighborhood along the Schuylkill River, known for its steep hills and vibrant main street filled with shops and restaurants. Appeals to families and young professionals. | Manayunk Canal Towpath, Main Street shopping and dining, Schuylkill River Trail, Galileo's Restaurant, The Manayunk Brewery, Manayunk Art Center |
| South Philadelphia | Known for its rich Italian heritage, vibrant culture, and proximity to sports venues. Great for visitors coming to explore local cuisine and catch a game. | Italian Market, South Philadelphia Sports Complex, Mummers Museum, Pat's and Geno's Steaks, The Magic Gardens, FDR Park |
| Northern Liberties | Trendy neighborhood with a mix of modern and historic vibes. Popular with tourists looking for a lively bar and restaurant scene. | Liberty Lands Park, Northern Liberties Arts and Crafts Festival, Urban Outfitters Headquarters, The Schmidt's Commons, Johnny Brenda's, The Piazza |
| West Philadelphia | Diverse and historic area, known for its cultural institutions and beautiful parks. Close to universities and offers a local feel with various food options. | Clark Park, Walnut Hill College, The Woodlands, Penn's Landing, Philadelphia Zoo, Kingsessing Recreation Center |
Understanding Airbnb License Requirements & STR Laws in Philadelphia (2026)
Yes, Philadelphia, Pennsylvania, United States enforces high STR regulations. Obtaining a license and ensuring compliance is almost certainly required according to current 2026 STR laws. Always verify the latest short term rental regulations and Airbnb license requirements directly with local government authorities for Philadelphia to ensure full compliance before hosting.
(Source: AirROI data, 2026, based on 80% licensed listings)
Top Performing Airbnb Properties in Philadelphia (2026)
Benchmark your potential! Explore examples of top-performing Airbnb properties in Philadelphiabased on Trailing Twelve Month (TTM) revenue. Analyze their characteristics, revenue, occupancy rate, and ADR to understand what drives success in this market.

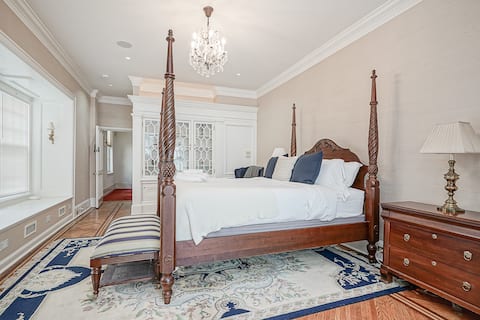
The Deacon - Grad Hospital 8 bdr, 13 bds, 5 baths
Entire Place • 8 bedrooms
The Rittenhouse Residence | Holidays & Retreats
Entire Place • 8 bedrooms
Thena Hotel - Entire Hotel
Entire Place • 9 bedrooms
5 BDRM City Oasis - Indoor Pool
Entire Place • 5 bedrooms

Old City Charm| In Law Suite |A+ Location
Entire Place • 3 bedrooms

Historic District Loft! Garage Parking! Sleeps 13
Entire Place • 4 bedrooms
Note: Performance varies based on location, size, amenities, seasonality, and management quality. Data reflects the past 12 months.
Top Performing Airbnb Hosts in Philadelphia (2026)
Learn from the best! This table showcases top-performing Airbnb hosts in Philadelphia based on the number of properties managed and estimated total revenue over the past year. Analyze their scale and performance metrics.
| Host Name | Properties | Grossing Revenue | Stay Reviews | Avg Rating |
|---|---|---|---|---|
| Seckou | 79 | $2,657,700 | 3923 | 4.66/5.0 |
| Shirmin Ken | 68 | $2,488,112 | 3517 | 4.54/5.0 |
| Yandel | 50 | $2,307,255 | 2542 | 4.83/5.0 |
| Simon At Sosuite | 67 | $2,274,721 | 8745 | 4.68/5.0 |
| Raphael | 43 | $2,168,748 | 3300 | 4.87/5.0 |
| Brittani | 42 | $1,601,223 | 3409 | 4.62/5.0 |
| Deluxe | 48 | $1,488,519 | 2401 | 4.84/5.0 |
| Joseph | 35 | $1,351,924 | 4571 | 4.73/5.0 |
| Sonder (Philly) | 42 | $1,057,655 | 8860 | 4.46/5.0 |
| Michael | 13 | $977,584 | 1129 | 4.79/5.0 |
Analyzing the strategies of top hosts, such as their property selection, pricing, and guest communication, can offer valuable lessons for optimizing your own Airbnb operations in Philadelphia.
Dive Deeper: Advanced Philadelphia STR Market Data (2026)
Ready to unlock more insights? AirROI provides access to advanced metrics and comprehensive Airbnb data for Philadelphia. Explore detailed analytics beyond this report to refine your investment strategy, optimize pricing, and maximize your vacation rental profits.
Explore Advanced MetricsPhiladelphia Short-Term Rental Market Composition (2026): Property & Room Types
Room Type Distribution
Property Type Distribution
Market Composition Insights for Philadelphia
- The Philadelphia Airbnb market composition is heavily skewed towards Entire Home/Apt listings, which make up 73.5% of the 4,449 active rentals. This indicates strong guest preference for privacy and space.
- Looking at the property type distribution in Philadelphia, Apartment/Condo properties are the most common (59.4%), reflecting the local real estate landscape.
- Houses represent a significant 37% portion, catering likely to families or larger groups.
- Smaller segments like others, hotel/boutique (combined 3.5%) offer potential for unique stay experiences.
Philadelphia Airbnb Room Capacity Analysis (2026): Bedroom Distribution
Distribution of Listings by Number of Bedrooms
Room Capacity Insights for Philadelphia
- The dominant room capacity in Philadelphia is 1 bedroom listings, making up 29.8% of the market. This suggests a strong demand for properties suitable for couples or solo travelers.
- Together, 1 bedroom and 2 bedrooms properties represent 50.4% of the active Airbnb listings in Philadelphia, indicating a high concentration in these sizes.
Philadelphia Vacation Rental Guest Capacity Trends (2026)
Distribution of Listings by Guest Capacity
Guest Capacity Insights for Philadelphia
- The most common guest capacity trend in Philadelphia vacation rentals is listings accommodating 2 guests (23.4%). This suggests the primary traveler segment is likely couples or solo travelers.
- Properties designed for 2 guests and 4 guests dominate the Philadelphia STR market, accounting for 40.3% of listings.
- 25.2% of properties accommodate 6+ guests, serving the market segment for larger families or group travel in Philadelphia.
- On average, properties in Philadelphia are equipped to host 3.4 guests.
Philadelphia Airbnb Booking Patterns (2026): Available vs. Booked Days
Available Days Distribution
Booked Days Distribution
Booking Pattern Insights for Philadelphia
- The most common availability pattern in Philadelphia falls within the 271-366 days range, representing 47.1% of listings. This suggests many properties have significant open periods on their calendars.
- Approximately 77.4% of listings show high availability (181+ days open annually), indicating potential for increased bookings or specific owner usage patterns.
- For booked days, the 91-180 days range is most frequent in Philadelphia (30.6%), reflecting common guest stay durations or potential owner blocking patterns.
- A notable 23.6% of properties secure long booking periods (181+ days booked per year), highlighting successful long-term rental strategies or significant owner usage.
Philadelphia Airbnb Minimum Stay Requirements Analysis
Distribution of Listings by Minimum Night Requirement
1 Night
1063 listings
23.9% of total
2 Nights
456 listings
10.2% of total
3 Nights
59 listings
1.3% of total
4-6 Nights
128 listings
2.9% of total
7-29 Nights
642 listings
14.4% of total
30+ Nights
2101 listings
47.2% of total
Key Insights
- The most prevalent minimum stay requirement in Philadelphia is 30+ Nights, adopted by 47.2% of listings. This highlights the market's preference for longer commitments.
- A significant segment (47.2%) caters to monthly stays (30+ nights) in Philadelphia, pointing to opportunities in the extended-stay market.
Recommendations
- Align with the market by considering a 30+ Nights minimum stay, as 47.2% of Philadelphia hosts use this setting.
- If feasible, allowing 1-night stays, especially midweek or during low season, could capture last-minute bookings, as only 23.9% currently do.
- Explore offering discounts for stays of 30+ nights to attract the 47.2% of the market seeking extended stays.
- Adjust minimum nights based on seasonality – potentially shorter during low season and longer during peak demand periods in Philadelphia.
Philadelphia Airbnb Cancellation Policy Trends Analysis (2026)
Limited
26 listings
0.6% of total
Super Strict 60 Days
72 listings
1.6% of total
Super Strict 30 Days
31 listings
0.7% of total
Flexible
726 listings
16.4% of total
Moderate
1309 listings
29.5% of total
Firm
1349 listings
30.5% of total
Strict
917 listings
20.7% of total
Cancellation Policy Insights for Philadelphia
- The prevailing Airbnb cancellation policy trend in Philadelphia is Firm, used by 30.5% of listings.
- A majority (51.2%) of hosts in Philadelphia utilize Firm or Strict policies, indicating a market where hosts prioritize booking security.
Recommendations for Hosts
- Consider adopting a Firm policy to align with the 30.5% market standard in Philadelphia.
- Regularly review your cancellation policy against competitors and market demand shifts in Philadelphia.
Philadelphia STR Booking Lead Time Analysis (2026)
Average Booking Lead Time by Month
Booking Lead Time Insights for Philadelphia
- The overall average booking lead time for vacation rentals in Philadelphia is 32 days.
- Guests book furthest in advance for stays during November (average 57 days), likely coinciding with peak travel demand or local events.
- The shortest booking windows occur for stays in February (average 17 days), indicating more last-minute travel plans during this time.
- Seasonally, Fall (41 days avg.) sees the longest lead times, while Winter (22 days avg.) has the shortest, reflecting typical travel planning cycles.
Recommendations for Hosts
- Use the overall average lead time (32 days) as a baseline for your pricing and availability strategy in Philadelphia.
- For November stays, consider implementing length-of-stay discounts or slightly higher rates for bookings made less than 57 days out to capitalize on advance planning.
- Target marketing efforts for the Fall season well in advance (at least 41 days) to capture early planners.
- Monitor your own booking lead times against these Philadelphia averages to identify opportunities for dynamic pricing adjustments.
Popular & Essential Airbnb Amenities in Philadelphia (2026)
Amenity Prevalence
Amenity Insights for Philadelphia
- Essential amenities in Philadelphia that guests expect include: Wifi, Air conditioning, Smoke alarm. Lacking these (any) could significantly impact bookings.
- Popular amenities like Heating, TV, Hot water are common but not universal. Offering these can provide a competitive edge.
Recommendations for Hosts
- Ensure your listing includes all essential amenities for Philadelphia: Wifi, Air conditioning, Smoke alarm.
- Prioritize adding missing essentials: Wifi, Air conditioning, Smoke alarm.
- Consider adding popular differentiators like Heating or TV to increase appeal.
- Highlight unique or less common amenities you offer (e.g., hot tub, dedicated workspace, EV charger) in your listing description and photos.
- Regularly check competitor amenities in Philadelphia to stay competitive.
Philadelphia Airbnb Guest Demographics & Profile Analysis (2026)
Guest Profile Summary for Philadelphia
- The typical guest profile for Airbnb in Philadelphia consists of primarily domestic travelers (90%), often arriving from nearby Philadelphia, typically belonging to the Post-2000s (Gen Z/Alpha) group (50%), primarily speaking English or Spanish.
- Domestic travelers account for 89.6% of guests.
- Key international markets include United States (89.6%) and DC (2.4%).
- Top languages spoken are English (64.4%) followed by Spanish (14.3%).
- A significant demographic segment is the Post-2000s (Gen Z/Alpha) group, representing 50% of guests.
Recommendations for Hosts
- Target domestic marketing efforts towards travelers from Philadelphia and New York.
- Tailor amenities and listing descriptions to appeal to the dominant Post-2000s (Gen Z/Alpha) demographic (e.g., highlight fast WiFi, smart home features, local guides).
- Highlight unique local experiences or amenities relevant to the primary guest profile.
- Consider seasonal promotions aligned with peak travel times for key origin markets.
Nearby Short-Term Rental Market Comparison
How does the Philadelphia Airbnb market stack up against its neighbors? Compare key performance metrics like average monthly revenue, ADR, and occupancy rates in surrounding areas to understand the broader regional STR landscape.
| Market | Active Properties | Monthly Revenue | Daily Rate | Avg. Occupancy |
|---|---|---|---|---|
| Polk Township | 15 | $6,974 | $520.26 | 38% |
| Centreville | 17 | $6,298 | $565.66 | 45% |
| Mayo | 13 | $5,915 | $447.58 | 51% |
| Spring Lake Heights | 16 | $5,785 | $725.20 | 40% |
| Hilltown Township | 11 | $5,557 | $578.96 | 40% |
| Hellam Township | 24 | $5,496 | $386.69 | 45% |
| Cape May Point | 23 | $5,479 | $542.19 | 46% |
| Stone Harbor | 42 | $5,467 | $785.22 | 39% |
| Stevensville | 80 | $5,412 | $556.79 | 41% |
| Neptune City | 12 | $5,299 | $531.14 | 45% |