Montgomery Township Airbnb Market Analysis 2026: Short Term Rental Data & Vacation Rental Statistics in Pennsylvania, United States
Is Airbnb profitable in Montgomery Township in 2026? Explore comprehensive Airbnb analytics for Montgomery Township, Pennsylvania, United States to uncover income potential. This 2026 STR market report for Montgomery Township, based on AirROI data from February 2025 to January 2026, reveals key trends in the niche market of 45 active listings.
Whether you're considering an Airbnb investment in Montgomery Township, optimizing your existing vacation rental, or exploring rental arbitrage opportunities, understanding the Montgomery Township Airbnb data is crucial. Leveraging the low regulation environment is key to maximizing your short term rental income potential. Let's dive into the specifics.
Key Montgomery Township Airbnb Performance Metrics Overview
Monthly Airbnb Revenue Variations & Income Potential in Montgomery Township (2026)
Understanding the monthly revenue variations for Airbnb listings in Montgomery Township is key to maximizing your short term rental income potential. Seasonality significantly impacts earnings. Our analysis, based on data from the past 12 months, shows that the peak revenue month for STRs in Montgomery Township is typically November, while June often presents the lowest earnings, highlighting opportunities for strategic pricing adjustments during shoulder and low seasons. Explore the typical Airbnb income in Montgomery Township across different performance tiers:
- Best-in-class properties (Top 10%) achieve $5,302+ monthly, often utilizing dynamic pricing and superior guest experiences.
- Strong performing properties (Top 25%) earn $3,468 or more, indicating effective management and desirable locations/amenities.
- Typical properties (Median) generate around $1,791 per month, representing the average market performance.
- Entry-level properties (Bottom 25%) see earnings around $638, often with potential for optimization.
Average Monthly Airbnb Earnings Trend in Montgomery Township
Montgomery Township Airbnb Occupancy Rate Trends (2026)
Maximize your bookings by understanding the Montgomery Township STR occupancy trends. Seasonal demand shifts significantly influence how often properties are booked. Typically, Novembersees the highest demand (peak season occupancy), while March experiences the lowest (low season). Effective strategies, like adjusting minimum stays or offering promotions, can boost occupancy during slower periods. Here's how different property tiers perform in Montgomery Township:
- Best-in-class properties (Top 10%) achieve 67%+ occupancy, indicating high desirability and potentially optimized availability.
- Strong performing properties (Top 25%) maintain 45% or higher occupancy, suggesting good market fit and guest satisfaction.
- Typical properties (Median) have an occupancy rate around 23%.
- Entry-level properties (Bottom 25%) average 12% occupancy, potentially facing higher vacancy.
Average Monthly Occupancy Rate Trend in Montgomery Township
Average Daily Rate (ADR) Airbnb Trends in Montgomery Township (2026)
Effective short term rental pricing strategy in Montgomery Township involves understanding monthly ADR fluctuations. The Average Daily Rate (ADR) for Airbnb in Montgomery Township typically peaks in January and dips lowest during April. Leveraging Airbnb dynamic pricing tools or strategies based on this seasonality can significantly boost revenue. Here's a look at the typical nightly rates achieved:
- Best-in-class properties (Top 10%) command rates of $478+ per night, often due to premium features or locations.
- Strong performing properties (Top 25%) achieve nightly rates of $325 or more.
- Typical properties (Median) charge around $206 per night.
- Entry-level properties (Bottom 25%) earn around $123 per night.
Average Daily Rate (ADR) Trend by Month in Montgomery Township
Get Live Montgomery Township Market Intelligence 👇

Explore Real-time Analytics
Airbnb Seasonality Analysis & Trends in Montgomery Township (2026)
Peak Season (November, January, December)
- Revenue averages $2,884 per month
- Occupancy rates average 31.6%
- Daily rates average $275
Shoulder Season
- Revenue averages $2,387 per month
- Occupancy maintains around 32.1%
- Daily rates hold near $240
Low Season (March, April, June)
- Revenue drops to average $1,900 per month
- Occupancy decreases to average 29.7%
- Daily rates adjust to average $237
Seasonality Insights for Montgomery Township
- The Airbnb seasonality in Montgomery Township shows moderate seasonality with distinct peak and low periods. While the sections above show seasonal averages, it's also insightful to look at the extremes:
- During the high season, the absolute peak month showcases Montgomery Township's highest earning potential, with monthly revenues capable of climbing to $3,003, occupancy reaching a high of 37.9%, and ADRs peaking at $295.
- Conversely, the slowest single month of the year, typically falling within the low season, marks the market's lowest point. In this month, revenue might dip to $1,737, occupancy could drop to 26.4%, and ADRs may adjust down to $227.
- Understanding both the seasonal averages and these monthly peaks and troughs in revenue, occupancy, and ADR is crucial for maximizing your Airbnb profit potential in Montgomery Township.
Seasonal Strategies for Maximizing Profit
- Peak Season: Maximize revenue through premium pricing and potentially longer minimum stays. Ensure high availability.
- Low Season: Offer competitive pricing, special promotions (e.g., extended stay discounts), and flexible cancellation policies. Target off-season travelers like remote workers or budget-conscious guests.
- Shoulder Seasons: Implement dynamic pricing that balances peak and low rates. Target weekend travelers or specific events. Offer slightly more flexible terms than peak season.
- Regularly analyze your own performance against these Montgomery Township seasonality benchmarks and adjust your pricing and availability strategy accordingly.
Best Areas for Airbnb Investment in Montgomery Township (2026)
Exploring the top neighborhoods for short-term rentals in Montgomery Township? This section highlights key areas, outlining why they are attractive for hosts and guests, along with notable local attractions. Consider these locations based on your target guest profile and investment strategy.
| Neighborhood / Area | Why Host Here? (Target Guests & Appeal) | Key Attractions & Landmarks |
|---|---|---|
| Blue Bell | A charming suburban area known for its picturesque landscapes and family-friendly environment. Blue Bell attracts families and tourists looking for a peaceful getaway with top-notch amenities. | Elmwood Park Zoo, Blue Bell Country Club, The Skippack Creek, Knoebels Amusement Resort, Historic Montgomery County, Pennypacker Mills |
| West Norriton | Featuring a close-knit community feel while being near major urban centers. It's ideal for travelers looking for a suburban escape with convenient access to Philadelphia. | Norriton Park, West Norriton Community Center, Plymouth Meeting Mall, Valley Forge National Historical Park, Schuylkill River Trail |
| King of Prussia | A bustling destination renowned for its expansive shopping mall and entertainment options, making it perfect for both leisure and business travelers. | King of Prussia Mall, Valley Forge Convention Center, Dorney Park, Bridgeport Speedway, Plymouth Meeting Mall |
| Ambler | A quaint town with a vibrant cultural scene and easy access to outdoor activities, Ambler is becoming increasingly popular among travelers seeking a quaint, local experience. | Ambler Theater, The Trolley Car Diner, Arcadia University, Fort Washington State Park, The Wissahickon Creek |
| Conshohocken | Known for its trendy restaurants and picturesque riverside views, Conshohocken appeals to both business and leisure travelers looking to enjoy an urban setting with a suburban feel. | Conshohocken Brewing Company, Sweeney Gaffney Park, The Schuylkill River Trail, Fitler Square, South of the Tracks |
| Lansdale | A suburban community that provides a mix of local charm and accessibility to urban conveniences. Ideal for families and travelers looking for affordable options near main attractions. | Knoebels Amusement Resort, Lansdale Historical Society, Souderton Park, Mason Park, Railroad Plaza |
| Oreland | A small suburban haven known for its parks and community feel, Oreland is good for families wanting a quiet and spacious environment, yet close to the city amenities. | Oreland Park, Cedarbrook Country Club, Fort Washington State Park, Bala Cynwyd Park, Whitemarsh Valley Country Club |
| Norristown | As the county seat of Montgomery County, Norristown offers a mix of urban and suburban experiences with rich history and cultural attractions. A great place for exploring local history. | Norristown State Hospital, Elmwood Park Zoo, Historic Norristown, Theatre Horizon, Montgomery County Courthouse |
Understanding Airbnb License Requirements & STR Laws in Montgomery Township (2026)
While Montgomery Township, Pennsylvania, United States currently shows low STR regulations, specific Airbnb license requirements might still exist or change. Always verify the latest short term rental regulations and Airbnb license requirements directly with local government authorities for Montgomery Township to ensure full compliance before hosting.
(Source: AirROI data, 2026, finding no licensed listings among those analyzed)
Top Performing Airbnb Properties in Montgomery Township (2026)
Benchmark your potential! Explore examples of top-performing Airbnb properties in Montgomery Townshipbased on Trailing Twelve Month (TTM) revenue. Analyze their characteristics, revenue, occupancy rate, and ADR to understand what drives success in this market.
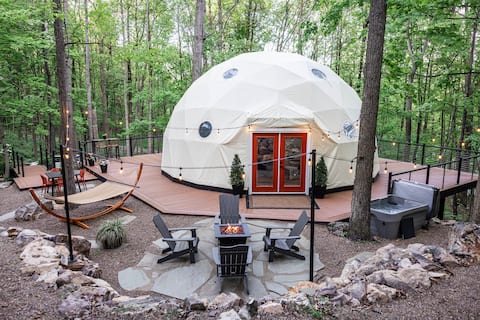
StayAround Dome ~ Unique & Tranquil Gem ~ Sauna
Entire Place • 1 bedroom

Gorgeous Mountain Home at Whitetail Resort
Entire Place • 4 bedrooms
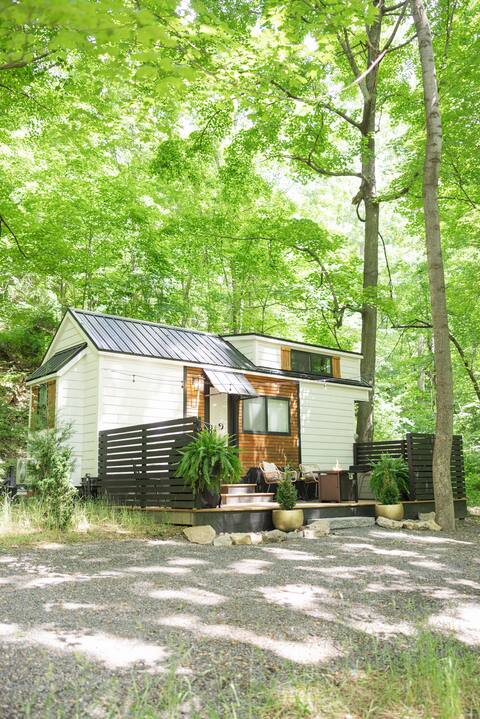
Boxed Inn ~ Hot Tub ~ Fire Pit
Entire Place • 1 bedroom

Charming Cabin w/ Hot Tub, Pool Table, and Fishing
Entire Place • 3 bedrooms

Cheerful 4 bedroom ranch experience.
Entire Place • 4 bedrooms

Cabin w\ Hot Tub, 10 mins from Roost Event Center
Entire Place • 4 bedrooms
Note: Performance varies based on location, size, amenities, seasonality, and management quality. Data reflects the past 12 months.
Top Performing Airbnb Hosts in Montgomery Township (2026)
Learn from the best! This table showcases top-performing Airbnb hosts in Montgomery Township based on the number of properties managed and estimated total revenue over the past year. Analyze their scale and performance metrics.
| Host Name | Properties | Grossing Revenue | Stay Reviews | Avg Rating |
|---|---|---|---|---|
| Rosalyn | 2 | $134,473 | 387 | 4.99/5.0 |
| Valentina | 2 | $102,466 | 184 | 4.92/5.0 |
| Whitetail Mountain | 4 | $51,605 | 27 | 4.67/5.0 |
| Joshua | 1 | $47,752 | 60 | 4.93/5.0 |
| Jeremy David | 1 | $46,374 | 4 | 5.00/5.0 |
| Merv | 1 | $45,807 | 183 | 4.86/5.0 |
| M.J. | 1 | $40,929 | 81 | 4.83/5.0 |
| Rochelle | 5 | $37,384 | 102 | 5.00/5.0 |
| Renee | 1 | $34,227 | 51 | 4.92/5.0 |
| Devin | 1 | $33,506 | 33 | 5.00/5.0 |
Analyzing the strategies of top hosts, such as their property selection, pricing, and guest communication, can offer valuable lessons for optimizing your own Airbnb operations in Montgomery Township.
Dive Deeper: Advanced Montgomery Township STR Market Data (2026)
Ready to unlock more insights? AirROI provides access to advanced metrics and comprehensive Airbnb data for Montgomery Township. Explore detailed analytics beyond this report to refine your investment strategy, optimize pricing, and maximize your vacation rental profits.
Explore Advanced MetricsMontgomery Township Short-Term Rental Market Composition (2026): Property & Room Types
Room Type Distribution
Property Type Distribution
Market Composition Insights for Montgomery Township
- The Montgomery Township Airbnb market composition is heavily skewed towards Entire Home/Apt listings, which make up 86.7% of the 45 active rentals. This indicates strong guest preference for privacy and space.
- Looking at the property type distribution in Montgomery Township, House properties are the most common (48.9%), reflecting the local real estate landscape.
- Houses represent a significant 48.9% portion, catering likely to families or larger groups.
- Smaller segments like hotel/boutique, unique stays (combined 6.6%) offer potential for unique stay experiences.
Montgomery Township Airbnb Room Capacity Analysis (2026): Bedroom Distribution
Distribution of Listings by Number of Bedrooms
Room Capacity Insights for Montgomery Township
- The dominant room capacity in Montgomery Township is 3 bedrooms listings, making up 24.4% of the market. This suggests a strong demand for properties suitable for families or small groups.
- Together, 3 bedrooms and 4 bedrooms properties represent 44.4% of the active Airbnb listings in Montgomery Township, indicating a high concentration in these sizes.
- A significant 48.8% of listings offer 3+ bedrooms, catering to larger groups and families seeking more space in Montgomery Township.
Montgomery Township Vacation Rental Guest Capacity Trends (2026)
Distribution of Listings by Guest Capacity
Guest Capacity Insights for Montgomery Township
- The most common guest capacity trend in Montgomery Township vacation rentals is listings accommodating 8+ guests (35.6%). This suggests the primary traveler segment is likely larger groups.
- Properties designed for 8+ guests and 4 guests dominate the Montgomery Township STR market, accounting for 51.2% of listings.
- 57.8% of properties accommodate 6+ guests, serving the market segment for larger families or group travel in Montgomery Township.
- On average, properties in Montgomery Township are equipped to host 5.2 guests.
Montgomery Township Airbnb Booking Patterns (2026): Available vs. Booked Days
Available Days Distribution
Booked Days Distribution
Booking Pattern Insights for Montgomery Township
- The most common availability pattern in Montgomery Township falls within the 271-366 days range, representing 71.1% of listings. This suggests many properties have significant open periods on their calendars.
- Approximately 88.9% of listings show high availability (181+ days open annually), indicating potential for increased bookings or specific owner usage patterns.
- For booked days, the 31-90 days range is most frequent in Montgomery Township (42.2%), reflecting common guest stay durations or potential owner blocking patterns.
- A notable 11.1% of properties secure long booking periods (181+ days booked per year), highlighting successful long-term rental strategies or significant owner usage.
Montgomery Township Airbnb Minimum Stay Requirements Analysis
Distribution of Listings by Minimum Night Requirement
1 Night
11 listings
24.4% of total
2 Nights
26 listings
57.8% of total
3 Nights
2 listings
4.4% of total
7-29 Nights
1 listings
2.2% of total
30+ Nights
5 listings
11.1% of total
Key Insights
- The most prevalent minimum stay requirement in Montgomery Township is 2 Nights, adopted by 57.8% of listings. This highlights the market's preference for shorter, flexible bookings.
- A strong majority (82.2%) of the Montgomery Township Airbnb data shows acceptance of very short stays (1-2 nights), indicating a dynamic, high-turnover market.
- A significant segment (11.1%) caters to monthly stays (30+ nights) in Montgomery Township, pointing to opportunities in the extended-stay market.
Recommendations
- Align with the market by considering a 2 Nights minimum stay, as 57.8% of Montgomery Township hosts use this setting.
- If feasible, allowing 1-night stays, especially midweek or during low season, could capture last-minute bookings, as only 24.4% currently do.
- Explore offering discounts for stays of 30+ nights to attract the 11.1% of the market seeking extended stays.
- Adjust minimum nights based on seasonality – potentially shorter during low season and longer during peak demand periods in Montgomery Township.
Montgomery Township Airbnb Cancellation Policy Trends Analysis (2026)
Limited
3 listings
6.7% of total
Flexible
4 listings
8.9% of total
Moderate
20 listings
44.4% of total
Firm
13 listings
28.9% of total
Strict
5 listings
11.1% of total
Cancellation Policy Insights for Montgomery Township
- The prevailing Airbnb cancellation policy trend in Montgomery Township is Moderate, used by 44.4% of listings.
- There's a relatively balanced mix between guest-friendly (53.3%) and stricter (40.0%) policies, offering choices for different guest needs.
Recommendations for Hosts
- Consider adopting a Moderate policy to align with the 44.4% market standard in Montgomery Township.
- Using a Strict policy might deter some guests, as only 11.1% of listings use it. Evaluate if potential revenue protection outweighs possible lower booking rates.
- Regularly review your cancellation policy against competitors and market demand shifts in Montgomery Township.
Montgomery Township STR Booking Lead Time Analysis (2026)
Average Booking Lead Time by Month
Booking Lead Time Insights for Montgomery Township
- The overall average booking lead time for vacation rentals in Montgomery Township is 53 days.
- Guests book furthest in advance for stays during January (average 100 days), likely coinciding with peak travel demand or local events.
- The shortest booking windows occur for stays in November (average 36 days), indicating more last-minute travel plans during this time.
- Seasonally, Winter (69 days avg.) sees the longest lead times, while Summer (46 days avg.) has the shortest, reflecting typical travel planning cycles.
Recommendations for Hosts
- Use the overall average lead time (53 days) as a baseline for your pricing and availability strategy in Montgomery Township.
- For January stays, consider implementing length-of-stay discounts or slightly higher rates for bookings made less than 100 days out to capitalize on advance planning.
- Target marketing efforts for the Winter season well in advance (at least 69 days) to capture early planners.
- Monitor your own booking lead times against these Montgomery Township averages to identify opportunities for dynamic pricing adjustments.
Popular & Essential Airbnb Amenities in Montgomery Township (2026)
Amenity Prevalence
Amenity Insights for Montgomery Township
- Essential amenities in Montgomery Township that guests expect include: Heating, Smoke alarm, Free parking on premises, Hot water, Washer. Lacking these (any) could significantly impact bookings.
- Popular amenities like Dryer, Kitchen, Essentials are common but not universal. Offering these can provide a competitive edge.
Recommendations for Hosts
- Ensure your listing includes all essential amenities for Montgomery Township: Heating, Smoke alarm, Free parking on premises, Hot water, Washer.
- Prioritize adding missing essentials: Free parking on premises, Hot water, Washer.
- Consider adding popular differentiators like Dryer or Kitchen to increase appeal.
- Highlight unique or less common amenities you offer (e.g., hot tub, dedicated workspace, EV charger) in your listing description and photos.
- Regularly check competitor amenities in Montgomery Township to stay competitive.
Montgomery Township Airbnb Guest Demographics & Profile Analysis (2026)
Guest Profile Summary for Montgomery Township
- The typical guest profile for Airbnb in Montgomery Township consists of primarily domestic travelers (91%), often arriving from nearby Washington, typically belonging to the Post-2000s (Gen Z/Alpha) group (50%), primarily speaking English or Spanish.
- Domestic travelers account for 90.5% of guests.
- Key international markets include United States (90.5%) and DC (7.6%).
- Top languages spoken are English (83.5%) followed by Spanish (9.6%).
- A significant demographic segment is the Post-2000s (Gen Z/Alpha) group, representing 50% of guests.
Recommendations for Hosts
- Target domestic marketing efforts towards travelers from Washington and Pittsburgh.
- Tailor amenities and listing descriptions to appeal to the dominant Post-2000s (Gen Z/Alpha) demographic (e.g., highlight fast WiFi, smart home features, local guides).
- Highlight unique local experiences or amenities relevant to the primary guest profile.
- Consider seasonal promotions aligned with peak travel times for key origin markets.
Nearby Short-Term Rental Market Comparison
How does the Montgomery Township Airbnb market stack up against its neighbors? Compare key performance metrics like average monthly revenue, ADR, and occupancy rates in surrounding areas to understand the broader regional STR landscape.
| Market | Active Properties | Monthly Revenue | Daily Rate | Avg. Occupancy |
|---|---|---|---|---|
| Lemont | 21 | $6,940 | $873.93 | 37% |
| College Township | 83 | $6,551 | $848.63 | 36% |
| McGaheysville | 83 | $6,156 | $431.72 | 45% |
| State College | 192 | $6,081 | $712.29 | 40% |
| Shannondale | 45 | $5,808 | $337.30 | 54% |
| Bentonville | 23 | $5,372 | $420.82 | 51% |
| Ferguson Township | 126 | $5,115 | $800.25 | 36% |
| Bumpass | 120 | $4,851 | $553.01 | 33% |
| Mineral | 231 | $4,800 | $474.55 | 36% |
| Shenandoah | 104 | $4,778 | $354.44 | 47% |