Millcreek Township Airbnb Market Analysis 2026: Short Term Rental Data & Vacation Rental Statistics in Pennsylvania, United States
Is Airbnb profitable in Millcreek Township in 2026? Explore comprehensive Airbnb analytics for Millcreek Township, Pennsylvania, United States to uncover income potential. This 2026 STR market report for Millcreek Township, based on AirROI data from February 2025 to January 2026, reveals key trends in the niche market of 101 active listings.
Whether you're considering an Airbnb investment in Millcreek Township, optimizing your existing vacation rental, or exploring rental arbitrage opportunities, understanding the Millcreek Township Airbnb data is crucial. Leveraging the low regulation environment is key to maximizing your short term rental income potential. Let's dive into the specifics.
Key Millcreek Township Airbnb Performance Metrics Overview
Monthly Airbnb Revenue Variations & Income Potential in Millcreek Township (2026)
Understanding the monthly revenue variations for Airbnb listings in Millcreek Township is key to maximizing your short term rental income potential. Seasonality significantly impacts earnings. Our analysis, based on data from the past 12 months, shows that the peak revenue month for STRs in Millcreek Township is typically July, while February often presents the lowest earnings, highlighting opportunities for strategic pricing adjustments during shoulder and low seasons. Explore the typical Airbnb income in Millcreek Township across different performance tiers:
- Best-in-class properties (Top 10%) achieve $6,523+ monthly, often utilizing dynamic pricing and superior guest experiences.
- Strong performing properties (Top 25%) earn $4,153 or more, indicating effective management and desirable locations/amenities.
- Typical properties (Median) generate around $2,581 per month, representing the average market performance.
- Entry-level properties (Bottom 25%) see earnings around $1,266, often with potential for optimization.
Average Monthly Airbnb Earnings Trend in Millcreek Township
Millcreek Township Airbnb Occupancy Rate Trends (2026)
Maximize your bookings by understanding the Millcreek Township STR occupancy trends. Seasonal demand shifts significantly influence how often properties are booked. Typically, Julysees the highest demand (peak season occupancy), while January experiences the lowest (low season). Effective strategies, like adjusting minimum stays or offering promotions, can boost occupancy during slower periods. Here's how different property tiers perform in Millcreek Township:
- Best-in-class properties (Top 10%) achieve 77%+ occupancy, indicating high desirability and potentially optimized availability.
- Strong performing properties (Top 25%) maintain 61% or higher occupancy, suggesting good market fit and guest satisfaction.
- Typical properties (Median) have an occupancy rate around 43%.
- Entry-level properties (Bottom 25%) average 24% occupancy, potentially facing higher vacancy.
Average Monthly Occupancy Rate Trend in Millcreek Township
Average Daily Rate (ADR) Airbnb Trends in Millcreek Township (2026)
Effective short term rental pricing strategy in Millcreek Township involves understanding monthly ADR fluctuations. The Average Daily Rate (ADR) for Airbnb in Millcreek Township typically peaks in July and dips lowest during March. Leveraging Airbnb dynamic pricing tools or strategies based on this seasonality can significantly boost revenue. Here's a look at the typical nightly rates achieved:
- Best-in-class properties (Top 10%) command rates of $407+ per night, often due to premium features or locations.
- Strong performing properties (Top 25%) achieve nightly rates of $262 or more.
- Typical properties (Median) charge around $170 per night.
- Entry-level properties (Bottom 25%) earn around $123 per night.
Average Daily Rate (ADR) Trend by Month in Millcreek Township
Get Live Millcreek Township Market Intelligence 👇

Explore Real-time Analytics
Airbnb Seasonality Analysis & Trends in Millcreek Township (2026)
Peak Season (July, August, June)
- Revenue averages $5,232 per month
- Occupancy rates average 62.7%
- Daily rates average $248
Shoulder Season
- Revenue averages $2,764 per month
- Occupancy maintains around 39.3%
- Daily rates hold near $216
Low Season (January, February, March)
- Revenue drops to average $1,858 per month
- Occupancy decreases to average 32.8%
- Daily rates adjust to average $198
Seasonality Insights for Millcreek Township
- The Airbnb seasonality in Millcreek Township shows highly seasonal trends requiring careful strategy. While the sections above show seasonal averages, it's also insightful to look at the extremes:
- During the high season, the absolute peak month showcases Millcreek Township's highest earning potential, with monthly revenues capable of climbing to $5,942, occupancy reaching a high of 67.4%, and ADRs peaking at $250.
- Conversely, the slowest single month of the year, typically falling within the low season, marks the market's lowest point. In this month, revenue might dip to $1,690, occupancy could drop to 29.2%, and ADRs may adjust down to $190.
- Understanding both the seasonal averages and these monthly peaks and troughs in revenue, occupancy, and ADR is crucial for maximizing your Airbnb profit potential in Millcreek Township.
Seasonal Strategies for Maximizing Profit
- Peak Season: Maximize revenue through premium pricing and potentially longer minimum stays. Ensure high availability.
- Low Season: Offer competitive pricing, special promotions (e.g., extended stay discounts), and flexible cancellation policies. Target off-season travelers like remote workers or budget-conscious guests.
- Shoulder Seasons: Implement dynamic pricing that balances peak and low rates. Target weekend travelers or specific events. Offer slightly more flexible terms than peak season.
- Regularly analyze your own performance against these Millcreek Township seasonality benchmarks and adjust your pricing and availability strategy accordingly.
Best Areas for Airbnb Investment in Millcreek Township (2026)
Exploring the top neighborhoods for short-term rentals in Millcreek Township? This section highlights key areas, outlining why they are attractive for hosts and guests, along with notable local attractions. Consider these locations based on your target guest profile and investment strategy.
| Neighborhood / Area | Why Host Here? (Target Guests & Appeal) | Key Attractions & Landmarks |
|---|---|---|
| Millcreek Park | Beautiful green space offering recreational activities like hiking and picnicking. Ideal for families and nature lovers looking for a peaceful retreat. | Millcreek Park, Pine Hill Park, Lakeside Park, Bike Trails, Vilano Park |
| Erie Zoo | A family-friendly destination with a variety of animals and exhibits. Perfect for those travelling with children and seeking an educational experience. | Erie Zoo, Zoological Society, Animal Encounters, Conservation Programs, Interactive Exhibits |
| Presque Isle State Park | A stunning peninsula with beaches and trails along Lake Erie. Perfect for beachgoers and outdoor enthusiasts seeking sun and fun. | Presque Isle beaches, Birdwatching, Bike Rentals, Water sports, Nature Walks |
| Downtown Erie | The cultural and economic hub of Erie offering dining, shopping, and entertainment. Attractive to city explorers and business travelers. | Erie Maritime Museum, Warner Theatre, Glass Block Building, Dining and Cafes, City Hall |
| Lake Erie Wine Country | Known for its wineries and scenic views, popular among wine lovers and those wanting to explore local vineyards. | Wineries, Wine Tasting Tours, Scenic Drives, Culinary Experiences, Chautauqua Lake |
| Asbury Woods | Natural area known for its wooded trails and nature center. Ideal for those interested in outdoor activities and wildlife. | Nature Center, Hiking Trails, Environmental Education, Wildlife Observation, Picnic Areas |
| North East Wine Country | Offers a combination of beautiful landscapes and wine tasting for a romantic getaway or a fun group outing. | North East wineries, Lake Erie viewpoints, Historical Sites, Vineyards, Food Festivals |
| Conneaut Lake | A popular summer destination with a large lake and amusement park. Great for families looking for fun and relaxation. | Conneaut Lake Park, Boating Activities, Fishing, Beach Areas, Picnic Spots |
Understanding Airbnb License Requirements & STR Laws in Millcreek Township (2026)
While Millcreek Township, Pennsylvania, United States currently shows low STR regulations, specific Airbnb license requirements might still exist or change. Always verify the latest short term rental regulations and Airbnb license requirements directly with local government authorities for Millcreek Township to ensure full compliance before hosting.
(Source: AirROI data, 2026, finding no licensed listings among those analyzed)
Top Performing Airbnb Properties in Millcreek Township (2026)
Benchmark your potential! Explore examples of top-performing Airbnb properties in Millcreek Townshipbased on Trailing Twelve Month (TTM) revenue. Analyze their characteristics, revenue, occupancy rate, and ADR to understand what drives success in this market.
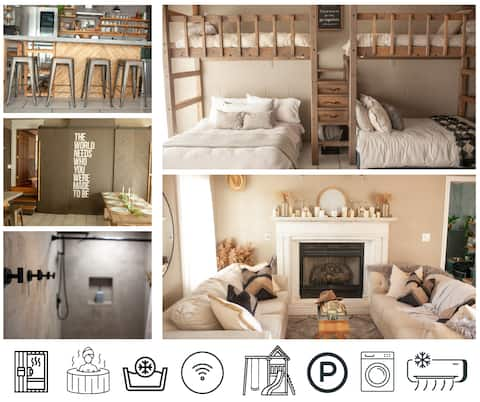
LARGE Family Home | Sauna | HotTub | Cold-Plunge
Entire Place • 7 bedrooms
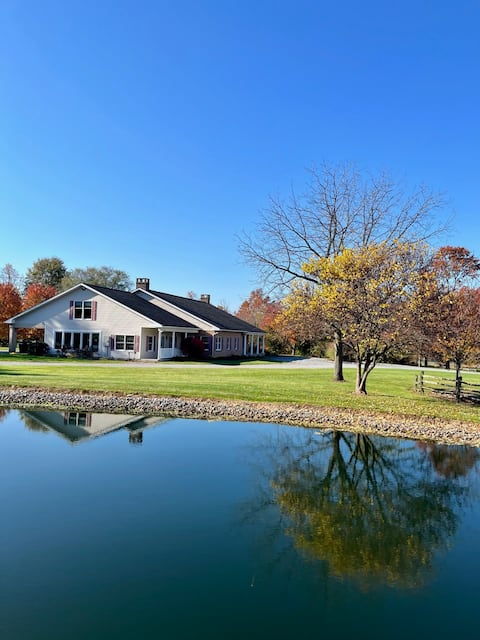
Lazy Meadows Horse Ranch
Entire Place • 5 bedrooms
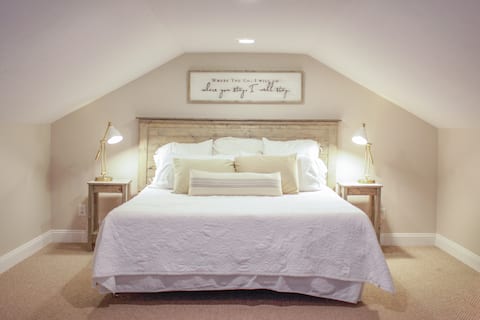
Large Family 5BR + King + Hot Tub + Cold Plunge
Entire Place • 5 bedrooms

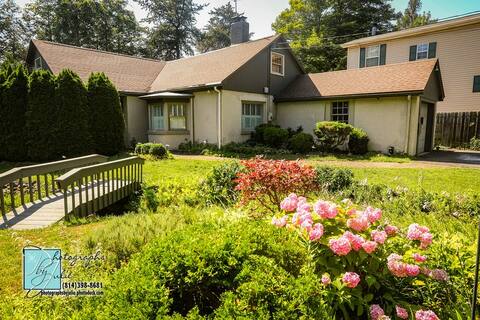
The Mansion In The Pines
Entire Place • 8 bedrooms

3-Bedroom Lake House with hot tub on Lake Erie.
Entire Place • 3 bedrooms
Carols Creekside 1 mile to beach
Entire Place • 3 bedrooms
Note: Performance varies based on location, size, amenities, seasonality, and management quality. Data reflects the past 12 months.
Top Performing Airbnb Hosts in Millcreek Township (2026)
Learn from the best! This table showcases top-performing Airbnb hosts in Millcreek Township based on the number of properties managed and estimated total revenue over the past year. Analyze their scale and performance metrics.
| Host Name | Properties | Grossing Revenue | Stay Reviews | Avg Rating |
|---|---|---|---|---|
| Jenny | 10 | $480,114 | 1916 | 4.92/5.0 |
| Jennifer | 2 | $201,437 | 197 | 4.96/5.0 |
| Brian | 5 | $179,230 | 538 | 4.91/5.0 |
| Mark | 8 | $173,630 | 688 | 4.89/5.0 |
| Nadia | 8 | $156,553 | 334 | 4.84/5.0 |
| Evolve | 3 | $144,894 | 109 | 4.80/5.0 |
| Annalynn | 2 | $120,368 | 123 | 4.96/5.0 |
| Lester | 1 | $108,962 | 38 | 4.95/5.0 |
| Jim Winschel | 2 | $100,171 | 139 | 4.67/5.0 |
| Robert | 2 | $84,393 | 33 | 4.85/5.0 |
Analyzing the strategies of top hosts, such as their property selection, pricing, and guest communication, can offer valuable lessons for optimizing your own Airbnb operations in Millcreek Township.
Dive Deeper: Advanced Millcreek Township STR Market Data (2026)
Ready to unlock more insights? AirROI provides access to advanced metrics and comprehensive Airbnb data for Millcreek Township. Explore detailed analytics beyond this report to refine your investment strategy, optimize pricing, and maximize your vacation rental profits.
Explore Advanced MetricsMillcreek Township Short-Term Rental Market Composition (2026): Property & Room Types
Room Type Distribution
Property Type Distribution
Market Composition Insights for Millcreek Township
- The Millcreek Township Airbnb market composition is heavily skewed towards Entire Home/Apt listings, which make up 91.1% of the 101 active rentals. This indicates strong guest preference for privacy and space.
- Looking at the property type distribution in Millcreek Township, House properties are the most common (60.4%), reflecting the local real estate landscape.
- Houses represent a significant 60.4% portion, catering likely to families or larger groups.
- The presence of 7.9% Hotel/Boutique listings indicates integration with traditional hospitality.
- Smaller segments like outdoor/unique, unique stays, others (combined 4.0%) offer potential for unique stay experiences.
Millcreek Township Airbnb Room Capacity Analysis (2026): Bedroom Distribution
Distribution of Listings by Number of Bedrooms
Room Capacity Insights for Millcreek Township
- The dominant room capacity in Millcreek Township is 2 bedrooms listings, making up 31.7% of the market. This suggests a strong demand for properties suitable for couples or solo travelers.
- Together, 2 bedrooms and 3 bedrooms properties represent 58.4% of the active Airbnb listings in Millcreek Township, indicating a high concentration in these sizes.
- A significant 41.5% of listings offer 3+ bedrooms, catering to larger groups and families seeking more space in Millcreek Township.
Millcreek Township Vacation Rental Guest Capacity Trends (2026)
Distribution of Listings by Guest Capacity
Guest Capacity Insights for Millcreek Township
- The most common guest capacity trend in Millcreek Township vacation rentals is listings accommodating 4 guests (28.7%). This suggests the primary traveler segment is likely small families or groups.
- Properties designed for 4 guests and 8+ guests dominate the Millcreek Township STR market, accounting for 56.4% of listings.
- 47.5% of properties accommodate 6+ guests, serving the market segment for larger families or group travel in Millcreek Township.
- On average, properties in Millcreek Township are equipped to host 5.3 guests.
Millcreek Township Airbnb Booking Patterns (2026): Available vs. Booked Days
Available Days Distribution
Booked Days Distribution
Booking Pattern Insights for Millcreek Township
- The most common availability pattern in Millcreek Township falls within the 181-270 days range, representing 43.6% of listings. This suggests many properties have significant open periods on their calendars.
- Approximately 81.2% of listings show high availability (181+ days open annually), indicating potential for increased bookings or specific owner usage patterns.
- For booked days, the 91-180 days range is most frequent in Millcreek Township (41.6%), reflecting common guest stay durations or potential owner blocking patterns.
- A notable 20.8% of properties secure long booking periods (181+ days booked per year), highlighting successful long-term rental strategies or significant owner usage.
Millcreek Township Airbnb Minimum Stay Requirements Analysis
Distribution of Listings by Minimum Night Requirement
1 Night
35 listings
34.7% of total
2 Nights
14 listings
13.9% of total
3 Nights
2 listings
2% of total
4-6 Nights
3 listings
3% of total
7-29 Nights
11 listings
10.9% of total
30+ Nights
36 listings
35.6% of total
Key Insights
- The most prevalent minimum stay requirement in Millcreek Township is 30+ Nights, adopted by 35.6% of listings. This highlights the market's preference for longer commitments.
- A significant segment (35.6%) caters to monthly stays (30+ nights) in Millcreek Township, pointing to opportunities in the extended-stay market.
Recommendations
- Align with the market by considering a 30+ Nights minimum stay, as 35.6% of Millcreek Township hosts use this setting.
- Explore offering discounts for stays of 30+ nights to attract the 35.6% of the market seeking extended stays.
- Adjust minimum nights based on seasonality – potentially shorter during low season and longer during peak demand periods in Millcreek Township.
Millcreek Township Airbnb Cancellation Policy Trends Analysis (2026)
Flexible
28 listings
27.7% of total
Moderate
19 listings
18.8% of total
Firm
42 listings
41.6% of total
Strict
12 listings
11.9% of total
Cancellation Policy Insights for Millcreek Township
- The prevailing Airbnb cancellation policy trend in Millcreek Township is Firm, used by 41.6% of listings.
- A majority (53.5%) of hosts in Millcreek Township utilize Firm or Strict policies, indicating a market where hosts prioritize booking security.
Recommendations for Hosts
- Consider adopting a Firm policy to align with the 41.6% market standard in Millcreek Township.
- Using a Strict policy might deter some guests, as only 11.9% of listings use it. Evaluate if potential revenue protection outweighs possible lower booking rates.
- Regularly review your cancellation policy against competitors and market demand shifts in Millcreek Township.
Millcreek Township STR Booking Lead Time Analysis (2026)
Average Booking Lead Time by Month
Booking Lead Time Insights for Millcreek Township
- The overall average booking lead time for vacation rentals in Millcreek Township is 57 days.
- Guests book furthest in advance for stays during July (average 106 days), likely coinciding with peak travel demand or local events.
- The shortest booking windows occur for stays in February (average 18 days), indicating more last-minute travel plans during this time.
- Seasonally, Summer (90 days avg.) sees the longest lead times, while Winter (30 days avg.) has the shortest, reflecting typical travel planning cycles.
Recommendations for Hosts
- Use the overall average lead time (57 days) as a baseline for your pricing and availability strategy in Millcreek Township.
- For July stays, consider implementing length-of-stay discounts or slightly higher rates for bookings made less than 106 days out to capitalize on advance planning.
- Target marketing efforts for the Summer season well in advance (at least 90 days) to capture early planners.
- Monitor your own booking lead times against these Millcreek Township averages to identify opportunities for dynamic pricing adjustments.
Popular & Essential Airbnb Amenities in Millcreek Township (2026)
Amenity Prevalence
Amenity Insights for Millcreek Township
- Essential amenities in Millcreek Township that guests expect include: Wifi, Air conditioning. Lacking these (any) could significantly impact bookings.
- Popular amenities like Heating, Smoke alarm, Kitchen are common but not universal. Offering these can provide a competitive edge.
Recommendations for Hosts
- Ensure your listing includes all essential amenities for Millcreek Township: Wifi, Air conditioning.
- Prioritize adding missing essentials: Wifi, Air conditioning.
- Consider adding popular differentiators like Heating or Smoke alarm to increase appeal.
- Highlight unique or less common amenities you offer (e.g., hot tub, dedicated workspace, EV charger) in your listing description and photos.
- Regularly check competitor amenities in Millcreek Township to stay competitive.
Millcreek Township Airbnb Guest Demographics & Profile Analysis (2026)
Guest Profile Summary for Millcreek Township
- The typical guest profile for Airbnb in Millcreek Township consists of primarily domestic travelers (98%), often arriving from nearby Pittsburgh, typically belonging to the Post-2000s (Gen Z/Alpha) group (50%), primarily speaking English or Spanish.
- Domestic travelers account for 97.5% of guests.
- Key international markets include United States (97.5%) and Canada (0.7%).
- Top languages spoken are English (84.9%) followed by Spanish (6.8%).
- A significant demographic segment is the Post-2000s (Gen Z/Alpha) group, representing 50% of guests.
Recommendations for Hosts
- Target domestic marketing efforts towards travelers from Pittsburgh and Erie.
- Tailor amenities and listing descriptions to appeal to the dominant Post-2000s (Gen Z/Alpha) demographic (e.g., highlight fast WiFi, smart home features, local guides).
- Highlight unique local experiences or amenities relevant to the primary guest profile.
- Consider seasonal promotions aligned with peak travel times for key origin markets.
Nearby Short-Term Rental Market Comparison
How does the Millcreek Township Airbnb market stack up against its neighbors? Compare key performance metrics like average monthly revenue, ADR, and occupancy rates in surrounding areas to understand the broader regional STR landscape.
| Market | Active Properties | Monthly Revenue | Daily Rate | Avg. Occupancy |
|---|---|---|---|---|
| Town of Mansfield | 61 | $4,782 | $517.31 | 32% |
| Town of Elma | 11 | $3,973 | $445.95 | 44% |
| Pine Creek Township | 10 | $3,889 | $230.94 | 57% |
| Sewickley | 14 | $3,774 | $230.59 | 59% |
| Buffalo Township | 11 | $3,682 | $257.23 | 44% |
| Town of West Seneca | 19 | $3,674 | $277.29 | 47% |
| Halfmoon Township | 25 | $3,654 | $668.26 | 31% |
| Oakmont | 11 | $3,622 | $265.08 | 49% |
| Clinton Township | 13 | $3,493 | $330.11 | 33% |
| North East Township | 41 | $3,444 | $313.39 | 42% |