Milford Township Airbnb Market Analysis 2026: Short Term Rental Data & Vacation Rental Statistics in Pennsylvania, United States
Is Airbnb profitable in Milford Township in 2026? Explore comprehensive Airbnb analytics for Milford Township, Pennsylvania, United States to uncover income potential. This 2026 STR market report for Milford Township, based on AirROI data from February 2025 to January 2026, reveals key trends in the niche market of 29 active listings.
Whether you're considering an Airbnb investment in Milford Township, optimizing your existing vacation rental, or exploring rental arbitrage opportunities, understanding the Milford Township Airbnb data is crucial. Leveraging the low regulation environment is key to maximizing your short term rental income potential. Let's dive into the specifics.
Key Milford Township Airbnb Performance Metrics Overview
Monthly Airbnb Revenue Variations & Income Potential in Milford Township (2026)
Understanding the monthly revenue variations for Airbnb listings in Milford Township is key to maximizing your short term rental income potential. Seasonality significantly impacts earnings. Our analysis, based on data from the past 12 months, shows that the peak revenue month for STRs in Milford Township is typically January, while April often presents the lowest earnings, highlighting opportunities for strategic pricing adjustments during shoulder and low seasons. Explore the typical Airbnb income in Milford Township across different performance tiers:
- Best-in-class properties (Top 10%) achieve $6,141+ monthly, often utilizing dynamic pricing and superior guest experiences.
- Strong performing properties (Top 25%) earn $3,367 or more, indicating effective management and desirable locations/amenities.
- Typical properties (Median) generate around $2,098 per month, representing the average market performance.
- Entry-level properties (Bottom 25%) see earnings around $1,208, often with potential for optimization.
Average Monthly Airbnb Earnings Trend in Milford Township
Milford Township Airbnb Occupancy Rate Trends (2026)
Maximize your bookings by understanding the Milford Township STR occupancy trends. Seasonal demand shifts significantly influence how often properties are booked. Typically, Augustsees the highest demand (peak season occupancy), while March experiences the lowest (low season). Effective strategies, like adjusting minimum stays or offering promotions, can boost occupancy during slower periods. Here's how different property tiers perform in Milford Township:
- Best-in-class properties (Top 10%) achieve 77%+ occupancy, indicating high desirability and potentially optimized availability.
- Strong performing properties (Top 25%) maintain 57% or higher occupancy, suggesting good market fit and guest satisfaction.
- Typical properties (Median) have an occupancy rate around 37%.
- Entry-level properties (Bottom 25%) average 22% occupancy, potentially facing higher vacancy.
Average Monthly Occupancy Rate Trend in Milford Township
Average Daily Rate (ADR) Airbnb Trends in Milford Township (2026)
Effective short term rental pricing strategy in Milford Township involves understanding monthly ADR fluctuations. The Average Daily Rate (ADR) for Airbnb in Milford Township typically peaks in June and dips lowest during March. Leveraging Airbnb dynamic pricing tools or strategies based on this seasonality can significantly boost revenue. Here's a look at the typical nightly rates achieved:
- Best-in-class properties (Top 10%) command rates of $517+ per night, often due to premium features or locations.
- Strong performing properties (Top 25%) achieve nightly rates of $282 or more.
- Typical properties (Median) charge around $200 per night.
- Entry-level properties (Bottom 25%) earn around $127 per night.
Average Daily Rate (ADR) Trend by Month in Milford Township
Get Live Milford Township Market Intelligence 👇

Explore Real-time Analytics
Airbnb Seasonality Analysis & Trends in Milford Township (2026)
Peak Season (January, December, August)
- Revenue averages $3,463 per month
- Occupancy rates average 44.4%
- Daily rates average $261
Shoulder Season
- Revenue averages $2,723 per month
- Occupancy maintains around 41.8%
- Daily rates hold near $260
Low Season (March, April, September)
- Revenue drops to average $2,392 per month
- Occupancy decreases to average 37.6%
- Daily rates adjust to average $252
Seasonality Insights for Milford Township
- The Airbnb seasonality in Milford Township shows moderate seasonality with distinct peak and low periods. While the sections above show seasonal averages, it's also insightful to look at the extremes:
- During the high season, the absolute peak month showcases Milford Township's highest earning potential, with monthly revenues capable of climbing to $3,702, occupancy reaching a high of 48.6%, and ADRs peaking at $266.
- Conversely, the slowest single month of the year, typically falling within the low season, marks the market's lowest point. In this month, revenue might dip to $2,211, occupancy could drop to 36.4%, and ADRs may adjust down to $250.
- Understanding both the seasonal averages and these monthly peaks and troughs in revenue, occupancy, and ADR is crucial for maximizing your Airbnb profit potential in Milford Township.
Seasonal Strategies for Maximizing Profit
- Peak Season: Maximize revenue through premium pricing and potentially longer minimum stays. Ensure high availability.
- Low Season: Offer competitive pricing, special promotions (e.g., extended stay discounts), and flexible cancellation policies. Target off-season travelers like remote workers or budget-conscious guests.
- Shoulder Seasons: Implement dynamic pricing that balances peak and low rates. Target weekend travelers or specific events. Offer slightly more flexible terms than peak season.
- Regularly analyze your own performance against these Milford Township seasonality benchmarks and adjust your pricing and availability strategy accordingly.
Best Areas for Airbnb Investment in Milford Township (2026)
Exploring the top neighborhoods for short-term rentals in Milford Township? This section highlights key areas, outlining why they are attractive for hosts and guests, along with notable local attractions. Consider these locations based on your target guest profile and investment strategy.
| Neighborhood / Area | Why Host Here? (Target Guests & Appeal) | Key Attractions & Landmarks |
|---|---|---|
| Milford | Charming historic town located along the Delaware River. Known for its scenic beauty, outdoor activities, and proximity to the Delaware Water Gap National Recreation Area, making it appealing for nature lovers and tourists seeking a retreat. | Delaware Water Gap National Recreation Area, Grey Towers National Historic Site, Milford Beach, The Columns Museum, Lovers Leap Park |
| Shawnee on Delaware | Quaint village known for its outdoor recreation opportunities, especially for water sports and hiking, and is a popular spot for families and nature lovers looking for a peaceful getaway. | Shawnee Mountain Ski Area, Delaware River Tubing, Camelbeach Mountain Waterpark, Pocono Environmental Education Center, Bushkill Falls |
| Eagle Valley | A picturesque area with scenic views and outdoor activities. It's family-friendly and offers a range of activities from hiking to fishing, which attracts nature enthusiasts. | Eagle Lake, Hiking trails, Fishing spots, Scenic drives |
| Dingmans Ferry | Known for its stunning waterfalls and natural beauty, Dingmans Ferry is a great spot for eco-tourists and adventure seekers looking to explore the outdoors. | Dingmans Falls, Delaware Water Gap, George W. Perkins Memorial Park, Twin Falls |
| Pike County | The entire Pike County region, including Milford Township, offers a blend of outdoor activities and small-town charm, making it an attractive investment area for Airbnb hosts. | Promised Land State Park, Shohola Falls, Lake Wallenpaupack, Wallenpaupack Environmental Learning Center |
| Westfall Township | A nearby township with various recreational opportunities and beautiful landscapes. It's an inviting area for visitors looking for peaceful accommodations. | Westfall Park, Near-Shady River, Outdoor activities and campgrounds |
| Lackawaxen | This area is excellent for vacationers interested in history and nature, combining beautiful landscapes with historical sites related to the Delaware River and the area's industrial past. | Zane Grey Museum, Lackawaxen River, Historic site tours |
| Luzerne County | A bit further but offers a blend of suburban and rural charm with multiple attractions, making it suitable for travelers who wish to explore the Pocono region. | Hugh Moore Park, Canoeing and kayaking opportunities, Cultural and historical sites, Natural beauty |
Understanding Airbnb License Requirements & STR Laws in Milford Township (2026)
While Milford Township, Pennsylvania, United States currently shows low STR regulations, specific Airbnb license requirements might still exist or change. Always verify the latest short term rental regulations and Airbnb license requirements directly with local government authorities for Milford Township to ensure full compliance before hosting.
(Source: AirROI data, 2026, finding no licensed listings among those analyzed)
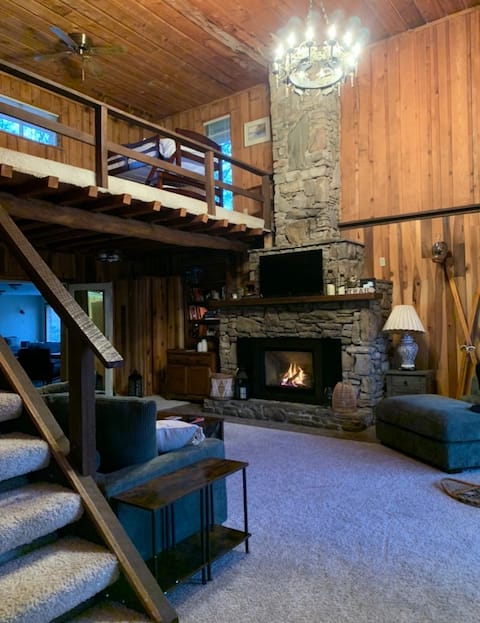
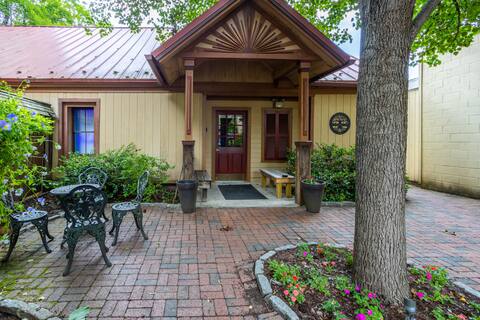
Top Performing Airbnb Properties in Milford Township (2026)
Benchmark your potential! Explore examples of top-performing Airbnb properties in Milford Townshipbased on Trailing Twelve Month (TTM) revenue. Analyze their characteristics, revenue, occupancy rate, and ADR to understand what drives success in this market.
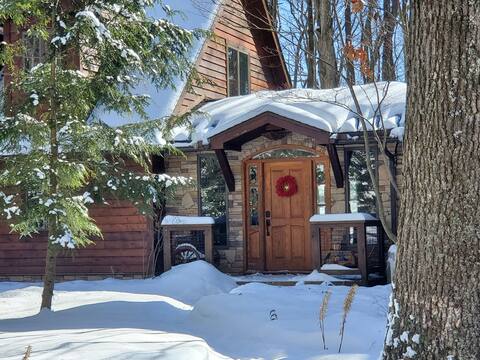
Fernwood Lodge
Entire Place • 5 bedrooms

The Still Life Studio- Centrally located Oasis
Entire Place • 1 bedroom

Beautiful Renovated Farmhouse at Maple Sugar Camp!
Entire Place • 3 bedrooms

forest cottage 1880s
Entire Place • 3 bedrooms
Serenity Now! Secluded, spacious with pond
Entire Place • 4 bedrooms
The Station Guesthouse at Broad St. Alley
Entire Place • 1 bedroom
Note: Performance varies based on location, size, amenities, seasonality, and management quality. Data reflects the past 12 months.
Top Performing Airbnb Hosts in Milford Township (2026)
Learn from the best! This table showcases top-performing Airbnb hosts in Milford Township based on the number of properties managed and estimated total revenue over the past year. Analyze their scale and performance metrics.
| Host Name | Properties | Grossing Revenue | Stay Reviews | Avg Rating |
|---|---|---|---|---|
| Christina | 1 | $121,930 | 97 | 4.99/5.0 |
| Eve Marie | 2 | $109,869 | 372 | 4.96/5.0 |
| Aimee | 1 | $63,273 | 153 | 4.96/5.0 |
| Elizabeth | 2 | $51,310 | 153 | 4.85/5.0 |
| Fengqing | 1 | $47,426 | 405 | 4.86/5.0 |
| Evolve | 2 | $42,622 | 22 | 4.21/5.0 |
| Lee | 1 | $36,375 | 24 | 4.88/5.0 |
| Dan | 1 | $30,178 | 99 | 4.85/5.0 |
| Stefan | 1 | $26,712 | 192 | 4.77/5.0 |
| Kristen | 1 | $23,889 | 399 | 4.97/5.0 |
Analyzing the strategies of top hosts, such as their property selection, pricing, and guest communication, can offer valuable lessons for optimizing your own Airbnb operations in Milford Township.
Dive Deeper: Advanced Milford Township STR Market Data (2026)
Ready to unlock more insights? AirROI provides access to advanced metrics and comprehensive Airbnb data for Milford Township. Explore detailed analytics beyond this report to refine your investment strategy, optimize pricing, and maximize your vacation rental profits.
Explore Advanced MetricsMilford Township Short-Term Rental Market Composition (2026): Property & Room Types
Room Type Distribution
Property Type Distribution
Market Composition Insights for Milford Township
- The Milford Township Airbnb market composition is heavily skewed towards Entire Home/Apt listings, which make up 100% of the 29 active rentals. This indicates strong guest preference for privacy and space.
- Looking at the property type distribution in Milford Township, House properties are the most common (51.7%), reflecting the local real estate landscape.
- Houses represent a significant 51.7% portion, catering likely to families or larger groups.
- Smaller segments like hotel/boutique, unique stays (combined 6.8%) offer potential for unique stay experiences.
Milford Township Airbnb Room Capacity Analysis (2026): Bedroom Distribution
Distribution of Listings by Number of Bedrooms
Room Capacity Insights for Milford Township
- The dominant room capacity in Milford Township is 3 bedrooms listings, making up 31% of the market. This suggests a strong demand for properties suitable for families or small groups.
- Together, 3 bedrooms and 1 bedroom properties represent 58.6% of the active Airbnb listings in Milford Township, indicating a high concentration in these sizes.
- A significant 51.6% of listings offer 3+ bedrooms, catering to larger groups and families seeking more space in Milford Township.
Milford Township Vacation Rental Guest Capacity Trends (2026)
Distribution of Listings by Guest Capacity
Guest Capacity Insights for Milford Township
- The most common guest capacity trend in Milford Township vacation rentals is listings accommodating 8+ guests (31%). This suggests the primary traveler segment is likely larger groups.
- Properties designed for 8+ guests and 6 guests dominate the Milford Township STR market, accounting for 51.7% of listings.
- 58.6% of properties accommodate 6+ guests, serving the market segment for larger families or group travel in Milford Township.
- On average, properties in Milford Township are equipped to host 5.5 guests.
Milford Township Airbnb Booking Patterns (2026): Available vs. Booked Days
Available Days Distribution
Booked Days Distribution
Booking Pattern Insights for Milford Township
- The most common availability pattern in Milford Township falls within the 271-366 days range, representing 44.8% of listings. This suggests many properties have significant open periods on their calendars.
- Approximately 86.2% of listings show high availability (181+ days open annually), indicating potential for increased bookings or specific owner usage patterns.
- For booked days, the 91-180 days range is most frequent in Milford Township (41.4%), reflecting common guest stay durations or potential owner blocking patterns.
- A notable 17.2% of properties secure long booking periods (181+ days booked per year), highlighting successful long-term rental strategies or significant owner usage.
Milford Township Airbnb Minimum Stay Requirements Analysis
Distribution of Listings by Minimum Night Requirement
1 Night
14 listings
48.3% of total
2 Nights
12 listings
41.4% of total
30+ Nights
3 listings
10.3% of total
Key Insights
- The most prevalent minimum stay requirement in Milford Township is 1 Night, adopted by 48.3% of listings. This highlights the market's preference for shorter, flexible bookings.
- A strong majority (89.7%) of the Milford Township Airbnb data shows acceptance of very short stays (1-2 nights), indicating a dynamic, high-turnover market.
- A significant segment (10.3%) caters to monthly stays (30+ nights) in Milford Township, pointing to opportunities in the extended-stay market.
Recommendations
- Align with the market by considering a 1 Night minimum stay, as 48.3% of Milford Township hosts use this setting.
- Explore offering discounts for stays of 30+ nights to attract the 10.3% of the market seeking extended stays.
- Adjust minimum nights based on seasonality – potentially shorter during low season and longer during peak demand periods in Milford Township.
Milford Township Airbnb Cancellation Policy Trends Analysis (2026)
Super Strict 30 Days
1 listings
3.4% of total
Flexible
5 listings
17.2% of total
Moderate
14 listings
48.3% of total
Firm
7 listings
24.1% of total
Strict
2 listings
6.9% of total
Cancellation Policy Insights for Milford Township
- The prevailing Airbnb cancellation policy trend in Milford Township is Moderate, used by 48.3% of listings.
- There's a relatively balanced mix between guest-friendly (65.5%) and stricter (31.0%) policies, offering choices for different guest needs.
- Strict cancellation policies are quite rare (6.9%), potentially making listings with this policy less competitive unless justified by high demand or property type.
Recommendations for Hosts
- Consider adopting a Moderate policy to align with the 48.3% market standard in Milford Township.
- Using a Strict policy might deter some guests, as only 6.9% of listings use it. Evaluate if potential revenue protection outweighs possible lower booking rates.
- Regularly review your cancellation policy against competitors and market demand shifts in Milford Township.
Milford Township STR Booking Lead Time Analysis (2026)
Average Booking Lead Time by Month
Booking Lead Time Insights for Milford Township
- The overall average booking lead time for vacation rentals in Milford Township is 55 days.
- Guests book furthest in advance for stays during September (average 78 days), likely coinciding with peak travel demand or local events.
- The shortest booking windows occur for stays in March (average 22 days), indicating more last-minute travel plans during this time.
- Seasonally, Fall (63 days avg.) sees the longest lead times, while Winter (44 days avg.) has the shortest, reflecting typical travel planning cycles.
Recommendations for Hosts
- Use the overall average lead time (55 days) as a baseline for your pricing and availability strategy in Milford Township.
- For September stays, consider implementing length-of-stay discounts or slightly higher rates for bookings made less than 78 days out to capitalize on advance planning.
- Target marketing efforts for the Fall season well in advance (at least 63 days) to capture early planners.
- Monitor your own booking lead times against these Milford Township averages to identify opportunities for dynamic pricing adjustments.
Popular & Essential Airbnb Amenities in Milford Township (2026)
Amenity Prevalence
Amenity Insights for Milford Township
- Essential amenities in Milford Township that guests expect include: Kitchen, Free parking on premises, Dishes and silverware, Heating, Smoke alarm, Wifi, TV, Hot water, Refrigerator. Lacking these (any) could significantly impact bookings.
- Popular amenities like Coffee maker are common but not universal. Offering these can provide a competitive edge.
Recommendations for Hosts
- Ensure your listing includes all essential amenities for Milford Township: Kitchen, Free parking on premises, Dishes and silverware, Heating, Smoke alarm, Wifi, TV, Hot water, Refrigerator.
- Prioritize adding missing essentials: Wifi, TV, Hot water, Refrigerator.
- Consider adding popular differentiators like Coffee maker to increase appeal.
- Highlight unique or less common amenities you offer (e.g., hot tub, dedicated workspace, EV charger) in your listing description and photos.
- Regularly check competitor amenities in Milford Township to stay competitive.
Milford Township Airbnb Guest Demographics & Profile Analysis (2026)
Guest Profile Summary for Milford Township
- The typical guest profile for Airbnb in Milford Township consists of primarily domestic travelers (95%), often arriving from nearby New York, typically belonging to the Post-2000s (Gen Z/Alpha) group (50%), primarily speaking English or Spanish.
- Domestic travelers account for 94.6% of guests.
- Key international markets include United States (94.6%) and DC (1.8%).
- Top languages spoken are English (70.1%) followed by Spanish (19%).
- A significant demographic segment is the Post-2000s (Gen Z/Alpha) group, representing 50% of guests.
Recommendations for Hosts
- Target domestic marketing efforts towards travelers from New York and Philadelphia.
- Tailor amenities and listing descriptions to appeal to the dominant Post-2000s (Gen Z/Alpha) demographic (e.g., highlight fast WiFi, smart home features, local guides).
- Highlight unique local experiences or amenities relevant to the primary guest profile.
- Consider seasonal promotions aligned with peak travel times for key origin markets.
Nearby Short-Term Rental Market Comparison
How does the Milford Township Airbnb market stack up against its neighbors? Compare key performance metrics like average monthly revenue, ADR, and occupancy rates in surrounding areas to understand the broader regional STR landscape.
| Market | Active Properties | Monthly Revenue | Daily Rate | Avg. Occupancy |
|---|---|---|---|---|
| Polk Township | 15 | $6,974 | $520.26 | 38% |
| Lemont | 21 | $6,940 | $873.93 | 37% |
| College Township | 83 | $6,551 | $848.63 | 36% |
| Centreville | 17 | $6,298 | $565.66 | 45% |
| State College | 192 | $6,081 | $712.29 | 40% |
| Shannondale | 45 | $5,808 | $337.30 | 54% |
| Hellam Township | 24 | $5,496 | $386.69 | 45% |
| Ferguson Township | 126 | $5,115 | $800.25 | 36% |
| Lower Windsor Township | 14 | $5,062 | $428.71 | 45% |
| Bethel Township | 25 | $4,863 | $320.23 | 52% |