Lower Macungie Township Airbnb Market Analysis 2026: Short Term Rental Data & Vacation Rental Statistics in Pennsylvania, United States
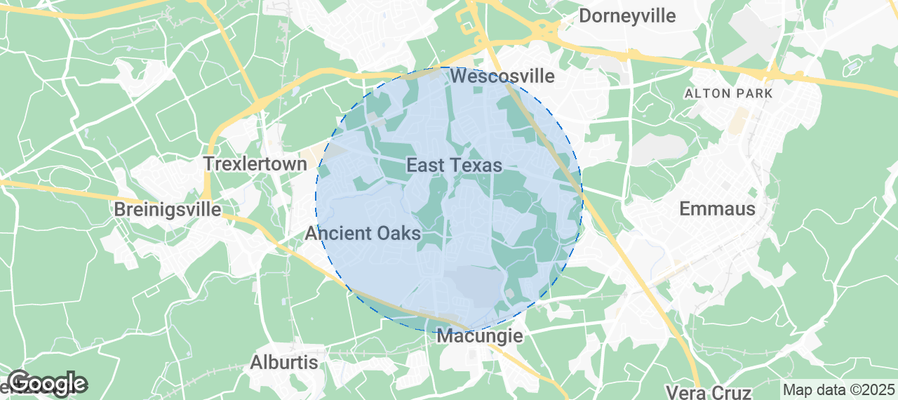
Is Airbnb profitable in Lower Macungie Township in 2026? Explore comprehensive Airbnb analytics for Lower Macungie Township, Pennsylvania, United States to uncover income potential. This 2026 STR market report for Lower Macungie Township, based on AirROI data from February 2025 to January 2026, reveals key trends in the niche market of 22 active listings.
Whether you're considering an Airbnb investment in Lower Macungie Township, optimizing your existing vacation rental, or exploring rental arbitrage opportunities, understanding the Lower Macungie Township Airbnb data is crucial. Leveraging the low regulation environment is key to maximizing your short term rental income potential. Let's dive into the specifics.
Key Lower Macungie Township Airbnb Performance Metrics Overview
Monthly Airbnb Revenue Variations & Income Potential in Lower Macungie Township (2026)
Understanding the monthly revenue variations for Airbnb listings in Lower Macungie Township is key to maximizing your short term rental income potential. Seasonality significantly impacts earnings. Our analysis, based on data from the past 12 months, shows that the peak revenue month for STRs in Lower Macungie Township is typically October, while February often presents the lowest earnings, highlighting opportunities for strategic pricing adjustments during shoulder and low seasons. Explore the typical Airbnb income in Lower Macungie Township across different performance tiers:
- Best-in-class properties (Top 10%) achieve $4,392+ monthly, often utilizing dynamic pricing and superior guest experiences.
- Strong performing properties (Top 25%) earn $2,915 or more, indicating effective management and desirable locations/amenities.
- Typical properties (Median) generate around $1,364 per month, representing the average market performance.
- Entry-level properties (Bottom 25%) see earnings around $821, often with potential for optimization.
Average Monthly Airbnb Earnings Trend in Lower Macungie Township
Lower Macungie Township Airbnb Occupancy Rate Trends (2026)
Maximize your bookings by understanding the Lower Macungie Township STR occupancy trends. Seasonal demand shifts significantly influence how often properties are booked. Typically, Maysees the highest demand (peak season occupancy), while February experiences the lowest (low season). Effective strategies, like adjusting minimum stays or offering promotions, can boost occupancy during slower periods. Here's how different property tiers perform in Lower Macungie Township:
- Best-in-class properties (Top 10%) achieve 85%+ occupancy, indicating high desirability and potentially optimized availability.
- Strong performing properties (Top 25%) maintain 73% or higher occupancy, suggesting good market fit and guest satisfaction.
- Typical properties (Median) have an occupancy rate around 51%.
- Entry-level properties (Bottom 25%) average 33% occupancy, potentially facing higher vacancy.
Average Monthly Occupancy Rate Trend in Lower Macungie Township
Average Daily Rate (ADR) Airbnb Trends in Lower Macungie Township (2026)
Effective short term rental pricing strategy in Lower Macungie Township involves understanding monthly ADR fluctuations. The Average Daily Rate (ADR) for Airbnb in Lower Macungie Township typically peaks in December and dips lowest during March. Leveraging Airbnb dynamic pricing tools or strategies based on this seasonality can significantly boost revenue. Here's a look at the typical nightly rates achieved:
- Best-in-class properties (Top 10%) command rates of $214+ per night, often due to premium features or locations.
- Strong performing properties (Top 25%) achieve nightly rates of $128 or more.
- Typical properties (Median) charge around $72 per night.
- Entry-level properties (Bottom 25%) earn around $50 per night.
Average Daily Rate (ADR) Trend by Month in Lower Macungie Township
Get Live Lower Macungie Township Market Intelligence 👇
Explore Real-time Analytics
Airbnb Seasonality Analysis & Trends in Lower Macungie Township (2026)
Peak Season (October, May, July)
- Revenue averages $2,488 per month
- Occupancy rates average 60.7%
- Daily rates average $102
Shoulder Season
- Revenue averages $2,111 per month
- Occupancy maintains around 55.5%
- Daily rates hold near $99
Low Season (February, November, December)
- Revenue drops to average $1,582 per month
- Occupancy decreases to average 42.5%
- Daily rates adjust to average $105
Seasonality Insights for Lower Macungie Township
- The Airbnb seasonality in Lower Macungie Township shows moderate seasonality with distinct peak and low periods. While the sections above show seasonal averages, it's also insightful to look at the extremes:
- During the high season, the absolute peak month showcases Lower Macungie Township's highest earning potential, with monthly revenues capable of climbing to $2,588, occupancy reaching a high of 68.3%, and ADRs peaking at $114.
- Conversely, the slowest single month of the year, typically falling within the low season, marks the market's lowest point. In this month, revenue might dip to $1,470, occupancy could drop to 39.6%, and ADRs may adjust down to $88.
- Understanding both the seasonal averages and these monthly peaks and troughs in revenue, occupancy, and ADR is crucial for maximizing your Airbnb profit potential in Lower Macungie Township.
Seasonal Strategies for Maximizing Profit
- Peak Season: Maximize revenue through premium pricing and potentially longer minimum stays. Ensure high availability.
- Low Season: Offer competitive pricing, special promotions (e.g., extended stay discounts), and flexible cancellation policies. Target off-season travelers like remote workers or budget-conscious guests.
- Shoulder Seasons: Implement dynamic pricing that balances peak and low rates. Target weekend travelers or specific events. Offer slightly more flexible terms than peak season.
- Regularly analyze your own performance against these Lower Macungie Township seasonality benchmarks and adjust your pricing and availability strategy accordingly.
Best Areas for Airbnb Investment in Lower Macungie Township (2026)
Exploring the top neighborhoods for short-term rentals in Lower Macungie Township? This section highlights key areas, outlining why they are attractive for hosts and guests, along with notable local attractions. Consider these locations based on your target guest profile and investment strategy.
| Neighborhood / Area | Why Host Here? (Target Guests & Appeal) | Key Attractions & Landmarks |
|---|---|---|
| Lower Macungie Township Park | A scenic park with trails and playgrounds, ideal for families and outdoor enthusiasts. It's a popular spot for local events and activities. | Lower Macungie Township Park, Walking Trails, Sports Fields, Picnic Areas |
| Emmaus Village Center | Historic and charming village center that offers a variety of shops, restaurants, and cultural experiences. A great spot for visitors exploring local art and dining. | Emmaus Theatre, Emmaus Community Park, Farmers Market, Local Shops and Cafes |
| Wildlands Conservancy | A conservation area with beautiful landscapes and outdoor activities like hiking and nature walks. A perfect getaway for nature lovers looking for tranquility. | Hiking Trails, Educational Programs, Natural Landscapes |
| Cedar Crest College | A private liberal arts college known for its beautiful campus. Attracts visitors for events, conferences, and weekend getaways. | Cedar Crest College Campus, Arts & Culture Events, Historic Buildings |
| Trexler Nature Preserve | A large nature preserve with diverse wildlife and trails, offering a serene environment for outdoor activities. Popular with eco-tourists and nature lovers. | Hiking Trails, Wildlife Viewing, Nature Tours |
| Allentown Art Museum | Close proximity to a renowned art museum, attracting art lovers and tourists. Ideal for culture-focused stays. | Allentown Art Museum, Exhibits and Collections, Art Classes and Workshops |
| Dorney Park & Wildwater Kingdom | A popular amusement park that attracts families and thrill-seekers. Ideal for short-term rentals during the summer season. | Amusement Rides, Water Park, Special Events |
| Lehigh Valley Zoo | A family-friendly attraction that provides entertainment and education about wildlife. Great for families visiting the area. | Animal Exhibits, Educational Programs, Children's Activities |
Understanding Airbnb License Requirements & STR Laws in Lower Macungie Township (2026)
While Lower Macungie Township, Pennsylvania, United States currently shows low STR regulations, specific Airbnb license requirements might still exist or change. Always verify the latest short term rental regulations and Airbnb license requirements directly with local government authorities for Lower Macungie Township to ensure full compliance before hosting.
(Source: AirROI data, 2026, finding no licensed listings among those analyzed)
Top Performing Airbnb Properties in Lower Macungie Township (2026)
Benchmark your potential! Explore examples of top-performing Airbnb properties in Lower Macungie Townshipbased on Trailing Twelve Month (TTM) revenue. Analyze their characteristics, revenue, occupancy rate, and ADR to understand what drives success in this market.
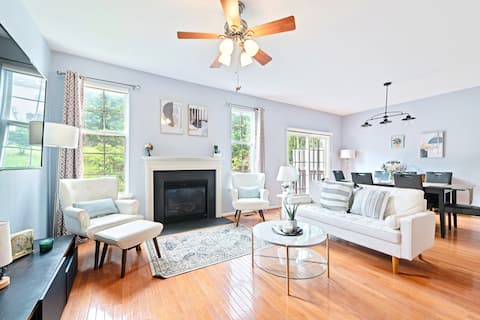
Perfect Private Getaway Just Minutes to Allentown!
Entire Place • 3 bedrooms

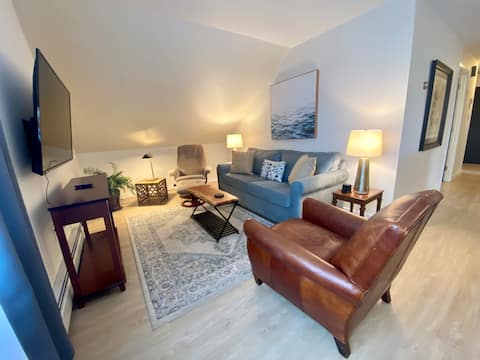
Quiet 2BR Lwr Level, Full Kit, Wifi, Private Ent
Entire Place • 2 bedrooms

Allentown home PefectGetaway Near Dorney/ resort
Entire Place • 3 bedrooms

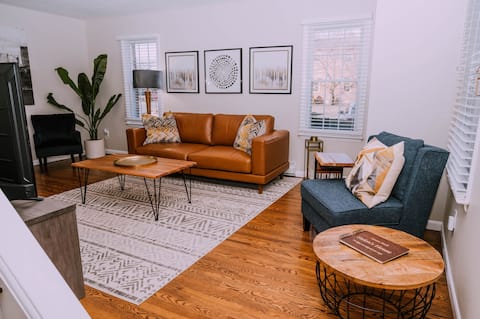
Entire semidetached home in Macungie
Entire Place • 3 bedrooms
Private, 2BR, Full Kit, Wifi, Desk, Prkg, Near Hwy
Entire Place • 2 bedrooms
Helen's Home Away From Home in Wescosville
Entire Place • 2 bedrooms
Note: Performance varies based on location, size, amenities, seasonality, and management quality. Data reflects the past 12 months.
Top Performing Airbnb Hosts in Lower Macungie Township (2026)
Learn from the best! This table showcases top-performing Airbnb hosts in Lower Macungie Township based on the number of properties managed and estimated total revenue over the past year. Analyze their scale and performance metrics.
| Host Name | Properties | Grossing Revenue | Stay Reviews | Avg Rating |
|---|---|---|---|---|
| Jill | 2 | $87,566 | 385 | 4.97/5.0 |
| Maribel | 4 | $61,416 | 935 | 4.82/5.0 |
| Plushy | 1 | $53,545 | 60 | 4.68/5.0 |
| Victoria | 1 | $42,476 | 95 | 4.88/5.0 |
| Nazarena | 1 | $40,765 | 179 | 4.72/5.0 |
| Lauryn | 1 | $32,273 | 188 | 4.99/5.0 |
| Linda | 1 | $25,947 | 604 | 4.91/5.0 |
| Kate | 2 | $12,900 | 130 | 4.92/5.0 |
| Jean | 5 | $8,401 | 18 | 4.36/5.0 |
| Antonella | 1 | $6,262 | 17 | 4.82/5.0 |
Analyzing the strategies of top hosts, such as their property selection, pricing, and guest communication, can offer valuable lessons for optimizing your own Airbnb operations in Lower Macungie Township.
Dive Deeper: Advanced Lower Macungie Township STR Market Data (2026)
Ready to unlock more insights? AirROI provides access to advanced metrics and comprehensive Airbnb data for Lower Macungie Township. Explore detailed analytics beyond this report to refine your investment strategy, optimize pricing, and maximize your vacation rental profits.
Explore Advanced MetricsLower Macungie Township Short-Term Rental Market Composition (2026): Property & Room Types
Room Type Distribution
Property Type Distribution
Market Composition Insights for Lower Macungie Township
- The Lower Macungie Township Airbnb market composition is heavily skewed towards Private Room listings, which make up 54.5% of the 22 active rentals. This indicates strong guest preference for privacy and space.
- Looking at the property type distribution in Lower Macungie Township, House properties are the most common (72.7%), reflecting the local real estate landscape.
- Houses represent a significant 72.7% portion, catering likely to families or larger groups.
- Smaller segments like others (combined 4.5%) offer potential for unique stay experiences.
Lower Macungie Township Airbnb Room Capacity Analysis (2026): Bedroom Distribution
Distribution of Listings by Number of Bedrooms
Room Capacity Insights for Lower Macungie Township
- The dominant room capacity in Lower Macungie Township is 1 bedroom listings, making up 31.8% of the market. This suggests a strong demand for properties suitable for couples or solo travelers.
- Together, 1 bedroom and 2 bedrooms properties represent 54.5% of the active Airbnb listings in Lower Macungie Township, indicating a high concentration in these sizes.
Lower Macungie Township Vacation Rental Guest Capacity Trends (2026)
Distribution of Listings by Guest Capacity
Guest Capacity Insights for Lower Macungie Township
- The most common guest capacity trend in Lower Macungie Township vacation rentals is listings accommodating 4 guests (18.2%). This suggests the primary traveler segment is likely small families or groups.
- Properties designed for 4 guests and 6 guests dominate the Lower Macungie Township STR market, accounting for 27.3% of listings.
- 13.6% of properties accommodate 6+ guests, serving the market segment for larger families or group travel in Lower Macungie Township.
- On average, properties in Lower Macungie Township are equipped to host 2.2 guests.
Lower Macungie Township Airbnb Booking Patterns (2026): Available vs. Booked Days
Available Days Distribution
Booked Days Distribution
Booking Pattern Insights for Lower Macungie Township
- The most common availability pattern in Lower Macungie Township falls within the 271-366 days range, representing 40.9% of listings. This suggests many properties have significant open periods on their calendars.
- Approximately 59.1% of listings show high availability (181+ days open annually), indicating potential for increased bookings or specific owner usage patterns.
- For booked days, the 31-90 days range is most frequent in Lower Macungie Township (31.8%), reflecting common guest stay durations or potential owner blocking patterns.
- A notable 40.9% of properties secure long booking periods (181+ days booked per year), highlighting successful long-term rental strategies or significant owner usage.
Lower Macungie Township Airbnb Minimum Stay Requirements Analysis
Distribution of Listings by Minimum Night Requirement
1 Night
8 listings
36.4% of total
2 Nights
4 listings
18.2% of total
3 Nights
1 listings
4.5% of total
4-6 Nights
5 listings
22.7% of total
7-29 Nights
2 listings
9.1% of total
30+ Nights
2 listings
9.1% of total
Key Insights
- The most prevalent minimum stay requirement in Lower Macungie Township is 1 Night, adopted by 36.4% of listings. This highlights the market's preference for shorter, flexible bookings.
Recommendations
- Align with the market by considering a 1 Night minimum stay, as 36.4% of Lower Macungie Township hosts use this setting.
- Explore offering discounts for stays of 30+ nights to attract the 9.1% of the market seeking extended stays.
- Adjust minimum nights based on seasonality – potentially shorter during low season and longer during peak demand periods in Lower Macungie Township.
Lower Macungie Township Airbnb Cancellation Policy Trends Analysis (2026)
Limited
1 listings
4.5% of total
Flexible
7 listings
31.8% of total
Moderate
2 listings
9.1% of total
Firm
9 listings
40.9% of total
Strict
3 listings
13.6% of total
Cancellation Policy Insights for Lower Macungie Township
- The prevailing Airbnb cancellation policy trend in Lower Macungie Township is Firm, used by 40.9% of listings.
- A majority (54.5%) of hosts in Lower Macungie Township utilize Firm or Strict policies, indicating a market where hosts prioritize booking security.
Recommendations for Hosts
- Consider adopting a Firm policy to align with the 40.9% market standard in Lower Macungie Township.
- Using a Strict policy might deter some guests, as only 13.6% of listings use it. Evaluate if potential revenue protection outweighs possible lower booking rates.
- Regularly review your cancellation policy against competitors and market demand shifts in Lower Macungie Township.
Lower Macungie Township STR Booking Lead Time Analysis (2026)
Average Booking Lead Time by Month
Booking Lead Time Insights for Lower Macungie Township
- The overall average booking lead time for vacation rentals in Lower Macungie Township is 34 days.
- Guests book furthest in advance for stays during July (average 84 days), likely coinciding with peak travel demand or local events.
- The shortest booking windows occur for stays in February (average 13 days), indicating more last-minute travel plans during this time.
- Seasonally, Summer (53 days avg.) sees the longest lead times, while Winter (23 days avg.) has the shortest, reflecting typical travel planning cycles.
Recommendations for Hosts
- Use the overall average lead time (34 days) as a baseline for your pricing and availability strategy in Lower Macungie Township.
- For July stays, consider implementing length-of-stay discounts or slightly higher rates for bookings made less than 84 days out to capitalize on advance planning.
- During February, focus on last-minute booking availability and promotions, as guests book with very short notice (13 days avg.).
- Target marketing efforts for the Summer season well in advance (at least 53 days) to capture early planners.
- Monitor your own booking lead times against these Lower Macungie Township averages to identify opportunities for dynamic pricing adjustments.
Popular & Essential Airbnb Amenities in Lower Macungie Township (2026)
Amenity Prevalence
Amenity Insights for Lower Macungie Township
- Essential amenities in Lower Macungie Township that guests expect include: Carbon monoxide alarm, Wifi, Hot water, Air conditioning, Smoke alarm, Heating, Iron. Lacking these (any) could significantly impact bookings.
- Popular amenities like Hangers, Washer, Dryer are common but not universal. Offering these can provide a competitive edge.
Recommendations for Hosts
- Ensure your listing includes all essential amenities for Lower Macungie Township: Carbon monoxide alarm, Wifi, Hot water, Air conditioning, Smoke alarm, Heating, Iron.
- Prioritize adding missing essentials: Iron.
- Consider adding popular differentiators like Hangers or Washer to increase appeal.
- Highlight unique or less common amenities you offer (e.g., hot tub, dedicated workspace, EV charger) in your listing description and photos.
- Regularly check competitor amenities in Lower Macungie Township to stay competitive.
Lower Macungie Township Airbnb Guest Demographics & Profile Analysis (2026)
Guest Profile Summary for Lower Macungie Township
- The typical guest profile for Airbnb in Lower Macungie Township consists of primarily domestic travelers (95%), often arriving from nearby New York, typically belonging to the Post-2000s (Gen Z/Alpha) group (50%), primarily speaking English or Spanish.
- Domestic travelers account for 94.6% of guests.
- Key international markets include United States (94.6%) and France (1.5%).
- Top languages spoken are English (71.7%) followed by Spanish (13.3%).
- A significant demographic segment is the Post-2000s (Gen Z/Alpha) group, representing 50% of guests.
Recommendations for Hosts
- Target domestic marketing efforts towards travelers from New York and Doylestown.
- Tailor amenities and listing descriptions to appeal to the dominant Post-2000s (Gen Z/Alpha) demographic (e.g., highlight fast WiFi, smart home features, local guides).
- Highlight unique local experiences or amenities relevant to the primary guest profile.
- Consider seasonal promotions aligned with peak travel times for key origin markets.
Nearby Short-Term Rental Market Comparison
How does the Lower Macungie Township Airbnb market stack up against its neighbors? Compare key performance metrics like average monthly revenue, ADR, and occupancy rates in surrounding areas to understand the broader regional STR landscape.
| Market | Active Properties | Monthly Revenue | Daily Rate | Avg. Occupancy |
|---|---|---|---|---|
| Freeland | 11 | $8,436 | $684.29 | 42% |
| Berlin Township | 15 | $7,208 | $729.10 | 35% |
| Polk Township | 15 | $6,974 | $520.26 | 38% |
| Town of Kingston | 10 | $6,470 | $473.76 | 49% |
| Frankford Township | 11 | $6,329 | $505.19 | 41% |
| Centreville | 17 | $6,298 | $565.66 | 45% |
| Spring Lake Heights | 16 | $5,785 | $725.20 | 40% |
| Stroud Township | 137 | $5,728 | $478.40 | 40% |
| Town of Monroe | 22 | $5,690 | $720.52 | 37% |
| Hilltown Township | 11 | $5,557 | $578.96 | 40% |