Ligonier Airbnb Market Analysis 2026: Short Term Rental Data & Vacation Rental Statistics in Pennsylvania, United States
Is Airbnb profitable in Ligonier in 2026? Explore comprehensive Airbnb analytics for Ligonier, Pennsylvania, United States to uncover income potential. This 2026 STR market report for Ligonier, based on AirROI data from February 2025 to January 2026, reveals key trends in the niche market of 20 active listings.
Whether you're considering an Airbnb investment in Ligonier, optimizing your existing vacation rental, or exploring rental arbitrage opportunities, understanding the Ligonier Airbnb data is crucial. Leveraging the low regulation environment is key to maximizing your short term rental income potential. Let's dive into the specifics.
Key Ligonier Airbnb Performance Metrics Overview
Monthly Airbnb Revenue Variations & Income Potential in Ligonier (2026)
Understanding the monthly revenue variations for Airbnb listings in Ligonier is key to maximizing your short term rental income potential. Seasonality significantly impacts earnings. Our analysis, based on data from the past 12 months, shows that the peak revenue month for STRs in Ligonier is typically July, while February often presents the lowest earnings, highlighting opportunities for strategic pricing adjustments during shoulder and low seasons. Explore the typical Airbnb income in Ligonier across different performance tiers:
- Best-in-class properties (Top 10%) achieve $4,995+ monthly, often utilizing dynamic pricing and superior guest experiences.
- Strong performing properties (Top 25%) earn $3,242 or more, indicating effective management and desirable locations/amenities.
- Typical properties (Median) generate around $1,865 per month, representing the average market performance.
- Entry-level properties (Bottom 25%) see earnings around $846, often with potential for optimization.
Average Monthly Airbnb Earnings Trend in Ligonier
Ligonier Airbnb Occupancy Rate Trends (2026)
Maximize your bookings by understanding the Ligonier STR occupancy trends. Seasonal demand shifts significantly influence how often properties are booked. Typically, Julysees the highest demand (peak season occupancy), while March experiences the lowest (low season). Effective strategies, like adjusting minimum stays or offering promotions, can boost occupancy during slower periods. Here's how different property tiers perform in Ligonier:
- Best-in-class properties (Top 10%) achieve 71%+ occupancy, indicating high desirability and potentially optimized availability.
- Strong performing properties (Top 25%) maintain 50% or higher occupancy, suggesting good market fit and guest satisfaction.
- Typical properties (Median) have an occupancy rate around 33%.
- Entry-level properties (Bottom 25%) average 18% occupancy, potentially facing higher vacancy.
Average Monthly Occupancy Rate Trend in Ligonier
Average Daily Rate (ADR) Airbnb Trends in Ligonier (2026)
Effective short term rental pricing strategy in Ligonier involves understanding monthly ADR fluctuations. The Average Daily Rate (ADR) for Airbnb in Ligonier typically peaks in October and dips lowest during April. Leveraging Airbnb dynamic pricing tools or strategies based on this seasonality can significantly boost revenue. Here's a look at the typical nightly rates achieved:
- Best-in-class properties (Top 10%) command rates of $289+ per night, often due to premium features or locations.
- Strong performing properties (Top 25%) achieve nightly rates of $214 or more.
- Typical properties (Median) charge around $148 per night.
- Entry-level properties (Bottom 25%) earn around $126 per night.
Average Daily Rate (ADR) Trend by Month in Ligonier
Get Live Ligonier Market Intelligence 👇

Explore Real-time Analytics
Airbnb Seasonality Analysis & Trends in Ligonier (2026)
Peak Season (July, October, December)
- Revenue averages $3,472 per month
- Occupancy rates average 48.7%
- Daily rates average $205
Shoulder Season
- Revenue averages $2,334 per month
- Occupancy maintains around 37.4%
- Daily rates hold near $197
Low Season (February, March, April)
- Revenue drops to average $1,096 per month
- Occupancy decreases to average 22.4%
- Daily rates adjust to average $178
Seasonality Insights for Ligonier
- The Airbnb seasonality in Ligonier shows highly seasonal trends requiring careful strategy. While the sections above show seasonal averages, it's also insightful to look at the extremes:
- During the high season, the absolute peak month showcases Ligonier's highest earning potential, with monthly revenues capable of climbing to $3,747, occupancy reaching a high of 53.8%, and ADRs peaking at $213.
- Conversely, the slowest single month of the year, typically falling within the low season, marks the market's lowest point. In this month, revenue might dip to $947, occupancy could drop to 20.9%, and ADRs may adjust down to $176.
- Understanding both the seasonal averages and these monthly peaks and troughs in revenue, occupancy, and ADR is crucial for maximizing your Airbnb profit potential in Ligonier.
Seasonal Strategies for Maximizing Profit
- Peak Season: Maximize revenue through premium pricing and potentially longer minimum stays. Ensure high availability.
- Low Season: Offer competitive pricing, special promotions (e.g., extended stay discounts), and flexible cancellation policies. Target off-season travelers like remote workers or budget-conscious guests.
- Shoulder Seasons: Implement dynamic pricing that balances peak and low rates. Target weekend travelers or specific events. Offer slightly more flexible terms than peak season.
- Regularly analyze your own performance against these Ligonier seasonality benchmarks and adjust your pricing and availability strategy accordingly.
Best Areas for Airbnb Investment in Ligonier (2026)
Exploring the top neighborhoods for short-term rentals in Ligonier? This section highlights key areas, outlining why they are attractive for hosts and guests, along with notable local attractions. Consider these locations based on your target guest profile and investment strategy.
| Neighborhood / Area | Why Host Here? (Target Guests & Appeal) | Key Attractions & Landmarks |
|---|---|---|
| Ligonier Historic District | Charming downtown area with preserved architecture and local boutiques. Attracts visitors looking for a quaint and picturesque small-town experience close to attractions like the fort and the covered bridge. | Fort Ligonier, Ligonier Valley Railway Museum, Ligonier Town Park, Local shops and restaurants, The Compass Inn Museum |
| Idlewild Park | Family-friendly amusement park and water park with a rich history. Popular with families looking to enjoy a fun day out, especially during the summer months. | Idlewild Park, SoakZone, Story Book Forest, Ligonier Valley Railroad |
| Laurel Highlands | A beautiful region known for its natural beauty, outdoor recreation, and scenic drives. Attracts nature lovers and outdoor enthusiasts year-round. | Ohiopyle State Park, Laurel Mountain Ski Resort, Cataract Falls, Hiking and biking trails |
| Seven Springs Mountain Resort | A four-season resort offering skiing, hiking, and family activities. A go-to destination for tourists seeking outdoor adventures and skiing in winter. | Seven Springs Ski Resort, Alpine Slide, Zipline courses, Mountain biking trails |
| Ligonier Valley | Picturesque valley with rolling hills and scenic views, perfect for retreat getaways. Appeals to those looking to relax and enjoy nature. | Scenic overlooks, Peaceful hiking trails, Local farms and wineries |
| St. Vincent College | A small college town that brings in visitors for events, sports, and education. Good for hosting short-term guests attending college functions or campus events. | St. Vincent College events, Sports facilities, Nearby Latrobe |
| Westmoreland County | The surrounding county includes many attractions and quick access to the city, making it attractive for longer stays and access to larger amenities while enjoying the quaintness of Ligonier. | Westmoreland Museum of American Art, Historic Hanna's Town, Local wineries and breweries |
| Ligonier's Covered Bridge | A great spot for photography and local history, attracting visitors interested in the scenic beauty and cultural significance of covered bridges. | Ligonier's Covered Bridge, Scenic walks, Fishing spots nearby |
Understanding Airbnb License Requirements & STR Laws in Ligonier (2026)
While Ligonier, Pennsylvania, United States currently shows low STR regulations, specific Airbnb license requirements might still exist or change. Always verify the latest short term rental regulations and Airbnb license requirements directly with local government authorities for Ligonier to ensure full compliance before hosting.
(Source: AirROI data, 2026, finding no licensed listings among those analyzed)
Top Performing Airbnb Properties in Ligonier (2026)
Benchmark your potential! Explore examples of top-performing Airbnb properties in Ligonierbased on Trailing Twelve Month (TTM) revenue. Analyze their characteristics, revenue, occupancy rate, and ADR to understand what drives success in this market.
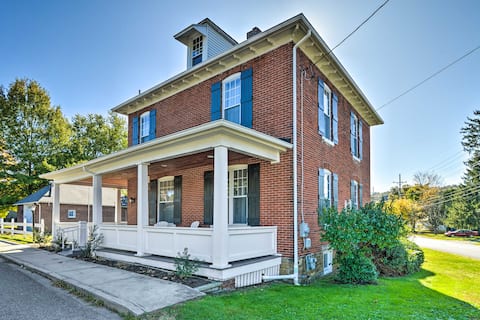
Quaint Ligonier Family Home - 3 Miles to Idlewild!
Entire Place • 4 bedrooms

Ligonier Guest House
Entire Place • 3 bedrooms
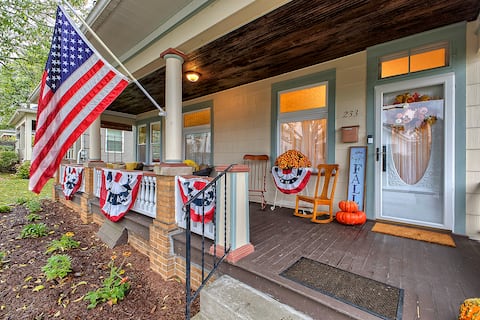
Carmic Suites-Historic District EV Level 2 charger
Entire Place • 3 bedrooms
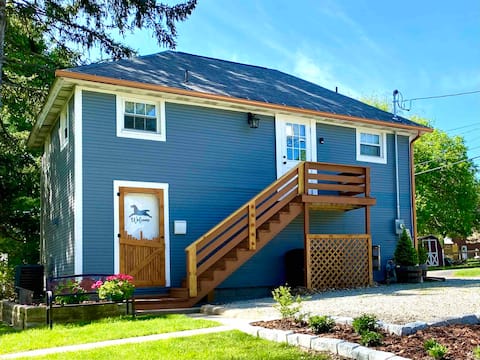
Garage Apartment in Ligonier
Entire Place • 1 bedroom

The Gem a cozy stay in winter wonderland Ligonier
Entire Place • 3 bedrooms
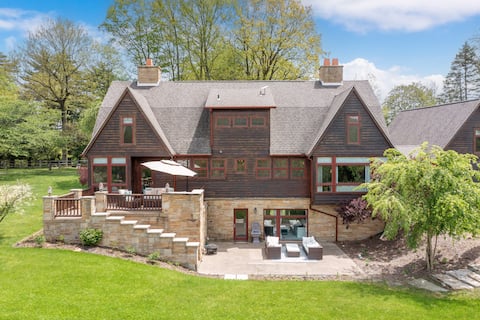
Lavender Mist Farms Estate
Entire Place • 6 bedrooms
Note: Performance varies based on location, size, amenities, seasonality, and management quality. Data reflects the past 12 months.
Top Performing Airbnb Hosts in Ligonier (2026)
Learn from the best! This table showcases top-performing Airbnb hosts in Ligonier based on the number of properties managed and estimated total revenue over the past year. Analyze their scale and performance metrics.
| Host Name | Properties | Grossing Revenue | Stay Reviews | Avg Rating |
|---|---|---|---|---|
| Evolve | 1 | $48,982 | 49 | 4.96/5.0 |
| Erica | 1 | $48,068 | 90 | 4.99/5.0 |
| Michelle | 1 | $45,060 | 21 | 5.00/5.0 |
| Dawn | 1 | $41,544 | 79 | 4.99/5.0 |
| Teresa | 1 | $39,086 | 66 | 5.00/5.0 |
| Mark | 1 | $35,551 | 2 | Not Rated |
| Pamela | 2 | $32,634 | 466 | 4.96/5.0 |
| Stephany | 1 | $31,617 | 66 | 4.98/5.0 |
| Brian And Heather | 1 | $30,928 | 34 | 4.91/5.0 |
| Melinda | 1 | $22,840 | 144 | 4.99/5.0 |
Analyzing the strategies of top hosts, such as their property selection, pricing, and guest communication, can offer valuable lessons for optimizing your own Airbnb operations in Ligonier.
Dive Deeper: Advanced Ligonier STR Market Data (2026)
Ready to unlock more insights? AirROI provides access to advanced metrics and comprehensive Airbnb data for Ligonier. Explore detailed analytics beyond this report to refine your investment strategy, optimize pricing, and maximize your vacation rental profits.
Explore Advanced MetricsLigonier Short-Term Rental Market Composition (2026): Property & Room Types
Room Type Distribution
Property Type Distribution
Market Composition Insights for Ligonier
- The Ligonier Airbnb market composition is heavily skewed towards Entire Home/Apt listings, which make up 95% of the 20 active rentals. This indicates strong guest preference for privacy and space.
- Looking at the property type distribution in Ligonier, Apartment/Condo properties are the most common (55%), reflecting the local real estate landscape.
- Houses represent a significant 35% portion, catering likely to families or larger groups.
Ligonier Airbnb Room Capacity Analysis (2026): Bedroom Distribution
Distribution of Listings by Number of Bedrooms
Room Capacity Insights for Ligonier
- The dominant room capacity in Ligonier is 1 bedroom listings, making up 40% of the market. This suggests a strong demand for properties suitable for couples or solo travelers.
- Together, 1 bedroom and 3 bedrooms properties represent 65.0% of the active Airbnb listings in Ligonier, indicating a high concentration in these sizes.
- A significant 35.0% of listings offer 3+ bedrooms, catering to larger groups and families seeking more space in Ligonier.
Ligonier Vacation Rental Guest Capacity Trends (2026)
Distribution of Listings by Guest Capacity
Guest Capacity Insights for Ligonier
- The most common guest capacity trend in Ligonier vacation rentals is listings accommodating 2 guests (30%). This suggests the primary traveler segment is likely couples or solo travelers.
- Properties designed for 2 guests and 4 guests dominate the Ligonier STR market, accounting for 55.0% of listings.
- 30.0% of properties accommodate 6+ guests, serving the market segment for larger families or group travel in Ligonier.
- On average, properties in Ligonier are equipped to host 4.1 guests.
Ligonier Airbnb Booking Patterns (2026): Available vs. Booked Days
Available Days Distribution
Booked Days Distribution
Booking Pattern Insights for Ligonier
- The most common availability pattern in Ligonier falls within the 181-270 days range, representing 45% of listings. This suggests many properties have significant open periods on their calendars.
- Approximately 85.0% of listings show high availability (181+ days open annually), indicating potential for increased bookings or specific owner usage patterns.
- For booked days, the 91-180 days range is most frequent in Ligonier (50%), reflecting common guest stay durations or potential owner blocking patterns.
- A notable 15.0% of properties secure long booking periods (181+ days booked per year), highlighting successful long-term rental strategies or significant owner usage.
Ligonier Airbnb Minimum Stay Requirements Analysis
Distribution of Listings by Minimum Night Requirement
1 Night
3 listings
15% of total
2 Nights
6 listings
30% of total
3 Nights
1 listings
5% of total
30+ Nights
10 listings
50% of total
Key Insights
- The most prevalent minimum stay requirement in Ligonier is 30+ Nights, adopted by 50% of listings. This highlights the market's preference for longer commitments.
- A significant segment (50%) caters to monthly stays (30+ nights) in Ligonier, pointing to opportunities in the extended-stay market.
Recommendations
- Align with the market by considering a 30+ Nights minimum stay, as 50% of Ligonier hosts use this setting.
- If feasible, allowing 1-night stays, especially midweek or during low season, could capture last-minute bookings, as only 15% currently do.
- Explore offering discounts for stays of 30+ nights to attract the 50% of the market seeking extended stays.
- Adjust minimum nights based on seasonality – potentially shorter during low season and longer during peak demand periods in Ligonier.
Ligonier Airbnb Cancellation Policy Trends Analysis (2026)
Limited
2 listings
10% of total
Flexible
5 listings
25% of total
Moderate
6 listings
30% of total
Firm
4 listings
20% of total
Strict
3 listings
15% of total
Cancellation Policy Insights for Ligonier
- The prevailing Airbnb cancellation policy trend in Ligonier is Moderate, used by 30% of listings.
- There's a relatively balanced mix between guest-friendly (55.0%) and stricter (35.0%) policies, offering choices for different guest needs.
Recommendations for Hosts
- Consider adopting a Moderate policy to align with the 30% market standard in Ligonier.
- Regularly review your cancellation policy against competitors and market demand shifts in Ligonier.
Ligonier STR Booking Lead Time Analysis (2026)
Average Booking Lead Time by Month
Booking Lead Time Insights for Ligonier
- The overall average booking lead time for vacation rentals in Ligonier is 49 days.
- Guests book furthest in advance for stays during October (average 84 days), likely coinciding with peak travel demand or local events.
- The shortest booking windows occur for stays in January (average 28 days), indicating more last-minute travel plans during this time.
- Seasonally, Fall (62 days avg.) sees the longest lead times, while Winter (32 days avg.) has the shortest, reflecting typical travel planning cycles.
Recommendations for Hosts
- Use the overall average lead time (49 days) as a baseline for your pricing and availability strategy in Ligonier.
- For October stays, consider implementing length-of-stay discounts or slightly higher rates for bookings made less than 84 days out to capitalize on advance planning.
- Target marketing efforts for the Fall season well in advance (at least 62 days) to capture early planners.
- Monitor your own booking lead times against these Ligonier averages to identify opportunities for dynamic pricing adjustments.
Popular & Essential Airbnb Amenities in Ligonier (2026)
Amenity Prevalence
Amenity Insights for Ligonier
- Essential amenities in Ligonier that guests expect include: Wifi, Air conditioning, Hot water, Smoke alarm, Heating, Coffee maker, TV. Lacking these (any) could significantly impact bookings.
- Popular amenities like Free parking on premises, Carbon monoxide alarm, Microwave are common but not universal. Offering these can provide a competitive edge.
Recommendations for Hosts
- Ensure your listing includes all essential amenities for Ligonier: Wifi, Air conditioning, Hot water, Smoke alarm, Heating, Coffee maker, TV.
- Prioritize adding missing essentials: Smoke alarm, Heating, Coffee maker, TV.
- Consider adding popular differentiators like Free parking on premises or Carbon monoxide alarm to increase appeal.
- Highlight unique or less common amenities you offer (e.g., hot tub, dedicated workspace, EV charger) in your listing description and photos.
- Regularly check competitor amenities in Ligonier to stay competitive.
Ligonier Airbnb Guest Demographics & Profile Analysis (2026)
Guest Profile Summary for Ligonier
- The typical guest profile for Airbnb in Ligonier consists of primarily domestic travelers (98%), often arriving from nearby Pittsburgh, typically belonging to the Post-2000s (Gen Z/Alpha) group (50%), primarily speaking English or Spanish.
- Domestic travelers account for 97.5% of guests.
- Key international markets include United States (97.5%) and DC (1.2%).
- Top languages spoken are English (76.7%) followed by Spanish (8.3%).
- A significant demographic segment is the Post-2000s (Gen Z/Alpha) group, representing 50% of guests.
Recommendations for Hosts
- Target domestic marketing efforts towards travelers from Pittsburgh and Bridgeport.
- Tailor amenities and listing descriptions to appeal to the dominant Post-2000s (Gen Z/Alpha) demographic (e.g., highlight fast WiFi, smart home features, local guides).
- Highlight unique local experiences or amenities relevant to the primary guest profile.
- Consider seasonal promotions aligned with peak travel times for key origin markets.
Nearby Short-Term Rental Market Comparison
How does the Ligonier Airbnb market stack up against its neighbors? Compare key performance metrics like average monthly revenue, ADR, and occupancy rates in surrounding areas to understand the broader regional STR landscape.
| Market | Active Properties | Monthly Revenue | Daily Rate | Avg. Occupancy |
|---|---|---|---|---|
| Wardensville | 33 | $4,485 | $267.00 | 54% |
| McHenry | 605 | $3,928 | $598.59 | 28% |
| Pine Creek Township | 10 | $3,889 | $230.94 | 57% |
| Swanton | 250 | $3,870 | $639.77 | 30% |
| Garrett County | 11 | $3,848 | $705.84 | 24% |
| Sewickley | 14 | $3,774 | $230.59 | 59% |
| Buffalo Township | 11 | $3,682 | $257.23 | 44% |
| Friendsville | 15 | $3,676 | $500.61 | 36% |
| Halfmoon Township | 25 | $3,654 | $668.26 | 31% |
| Oakmont | 11 | $3,622 | $265.08 | 49% |