Kennett Square Airbnb Market Analysis 2026: Short Term Rental Data & Vacation Rental Statistics in Pennsylvania, United States
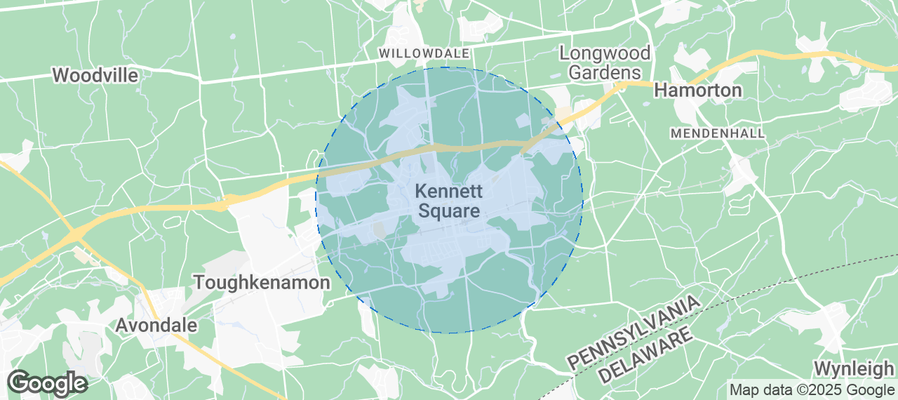
Is Airbnb profitable in Kennett Square in 2026? Explore comprehensive Airbnb analytics for Kennett Square, Pennsylvania, United States to uncover income potential. This 2026 STR market report for Kennett Square, based on AirROI data from February 2025 to January 2026, reveals key trends in the niche market of 28 active listings.
Whether you're considering an Airbnb investment in Kennett Square, optimizing your existing vacation rental, or exploring rental arbitrage opportunities, understanding the Kennett Square Airbnb data is crucial. Leveraging the low regulation environment is key to maximizing your short term rental income potential. Let's dive into the specifics.
Key Kennett Square Airbnb Performance Metrics Overview
Monthly Airbnb Revenue Variations & Income Potential in Kennett Square (2026)
Understanding the monthly revenue variations for Airbnb listings in Kennett Square is key to maximizing your short term rental income potential. Seasonality significantly impacts earnings. Our analysis, based on data from the past 12 months, shows that the peak revenue month for STRs in Kennett Square is typically December, while January often presents the lowest earnings, highlighting opportunities for strategic pricing adjustments during shoulder and low seasons. Explore the typical Airbnb income in Kennett Square across different performance tiers:
- Best-in-class properties (Top 10%) achieve $6,198+ monthly, often utilizing dynamic pricing and superior guest experiences.
- Strong performing properties (Top 25%) earn $4,477 or more, indicating effective management and desirable locations/amenities.
- Typical properties (Median) generate around $3,114 per month, representing the average market performance.
- Entry-level properties (Bottom 25%) see earnings around $1,700, often with potential for optimization.
Average Monthly Airbnb Earnings Trend in Kennett Square
Kennett Square Airbnb Occupancy Rate Trends (2026)
Maximize your bookings by understanding the Kennett Square STR occupancy trends. Seasonal demand shifts significantly influence how often properties are booked. Typically, Julysees the highest demand (peak season occupancy), while January experiences the lowest (low season). Effective strategies, like adjusting minimum stays or offering promotions, can boost occupancy during slower periods. Here's how different property tiers perform in Kennett Square:
- Best-in-class properties (Top 10%) achieve 79%+ occupancy, indicating high desirability and potentially optimized availability.
- Strong performing properties (Top 25%) maintain 65% or higher occupancy, suggesting good market fit and guest satisfaction.
- Typical properties (Median) have an occupancy rate around 51%.
- Entry-level properties (Bottom 25%) average 30% occupancy, potentially facing higher vacancy.
Average Monthly Occupancy Rate Trend in Kennett Square
Average Daily Rate (ADR) Airbnb Trends in Kennett Square (2026)
Effective short term rental pricing strategy in Kennett Square involves understanding monthly ADR fluctuations. The Average Daily Rate (ADR) for Airbnb in Kennett Square typically peaks in December and dips lowest during February. Leveraging Airbnb dynamic pricing tools or strategies based on this seasonality can significantly boost revenue. Here's a look at the typical nightly rates achieved:
- Best-in-class properties (Top 10%) command rates of $293+ per night, often due to premium features or locations.
- Strong performing properties (Top 25%) achieve nightly rates of $252 or more.
- Typical properties (Median) charge around $204 per night.
- Entry-level properties (Bottom 25%) earn around $156 per night.
Average Daily Rate (ADR) Trend by Month in Kennett Square
Get Live Kennett Square Market Intelligence 👇
Explore Real-time Analytics
Airbnb Seasonality Analysis & Trends in Kennett Square (2026)
Peak Season (December, July, November)
- Revenue averages $4,137 per month
- Occupancy rates average 55.1%
- Daily rates average $224
Shoulder Season
- Revenue averages $3,480 per month
- Occupancy maintains around 50.9%
- Daily rates hold near $211
Low Season (January, February, March)
- Revenue drops to average $2,208 per month
- Occupancy decreases to average 36.7%
- Daily rates adjust to average $197
Seasonality Insights for Kennett Square
- The Airbnb seasonality in Kennett Square shows moderate seasonality with distinct peak and low periods. While the sections above show seasonal averages, it's also insightful to look at the extremes:
- During the high season, the absolute peak month showcases Kennett Square's highest earning potential, with monthly revenues capable of climbing to $4,221, occupancy reaching a high of 59.1%, and ADRs peaking at $227.
- Conversely, the slowest single month of the year, typically falling within the low season, marks the market's lowest point. In this month, revenue might dip to $2,057, occupancy could drop to 28.2%, and ADRs may adjust down to $189.
- Understanding both the seasonal averages and these monthly peaks and troughs in revenue, occupancy, and ADR is crucial for maximizing your Airbnb profit potential in Kennett Square.
Seasonal Strategies for Maximizing Profit
- Peak Season: Maximize revenue through premium pricing and potentially longer minimum stays. Ensure high availability.
- Low Season: Offer competitive pricing, special promotions (e.g., extended stay discounts), and flexible cancellation policies. Target off-season travelers like remote workers or budget-conscious guests.
- Shoulder Seasons: Implement dynamic pricing that balances peak and low rates. Target weekend travelers or specific events. Offer slightly more flexible terms than peak season.
- Regularly analyze your own performance against these Kennett Square seasonality benchmarks and adjust your pricing and availability strategy accordingly.
Best Areas for Airbnb Investment in Kennett Square (2026)
Exploring the top neighborhoods for short-term rentals in Kennett Square? This section highlights key areas, outlining why they are attractive for hosts and guests, along with notable local attractions. Consider these locations based on your target guest profile and investment strategy.
| Neighborhood / Area | Why Host Here? (Target Guests & Appeal) | Key Attractions & Landmarks |
|---|---|---|
| Longwood Gardens | World-renowned botanical garden featuring stunning landscapes and seasonal exhibits. A major attraction that draws visitors from all over, making nearby accommodations highly sought after. | Longwood Gardens, Merrion Square Park, Conservatory at Longwood Gardens, Peirce-du Pont House, Fountain Garden |
| Kennett Square Mushroom Farms | Home to the famous mushroom farms, this area attracts food enthusiasts and those interested in local agriculture. Unique culinary experiences available nearby. | Mushroom Capital of the World, Mushroom Tours, Local farms and markets, Kennett Square Farmers Market, Food festivals |
| White Clay Creek State Park | A beautiful natural space ideal for outdoor activities like hiking and biking. Appeals to nature lovers and those looking for a peaceful retreat close to Kennett Square. | Hiking trails, Biking paths, Picnic areas, Nature walks, Wildlife viewing |
| Downtown Kennett Square | Charming small-town center with shops, restaurants, and local events. Perfect for tourists looking for a quaint and authentic experience. | Kennett Square Historic District, Local dining, Shopping boutiques, Kennett Flash, The Mushroom Festival |
| Chester County | A picturesque area known for its stunning countryside, wineries, and charming towns. Appeals to travelers looking for a rural escape with various attractions. | Wineries and vineyards, Charming small towns, Historical sites, Outdoor activities, Art galleries |
| Brandywine Valley | Famous for its scenic beauty and rich history, it's a perfect location for travelers interested in arts, history, and nature. | Brandywine River Museum of Art, Winterthur Museum, Hagley Museum and Library, Biking along the Brandywine, Scenic drives |
| Avondale | A close-knit community with a vibrant local scene, known for its art and culture. Ideal for visitors looking for a quiet stay with access to local happenings. | Local art galleries, Farmers markets, Avondale Music Festival, Historic sites, Nature walks nearby |
| New Garden Township | Offering a mix of rural charm and access to suburban amenities, it’s ideal for families and travelers looking for a home-like atmosphere near Kennett Square. | Parks and recreation areas, Local dining options, Farm stands, Community events, Historic sites |
Understanding Airbnb License Requirements & STR Laws in Kennett Square (2026)
While Kennett Square, Pennsylvania, United States currently shows low STR regulations, specific Airbnb license requirements might still exist or change. Always verify the latest short term rental regulations and Airbnb license requirements directly with local government authorities for Kennett Square to ensure full compliance before hosting.
(Source: AirROI data, 2026, finding no licensed listings among those analyzed)
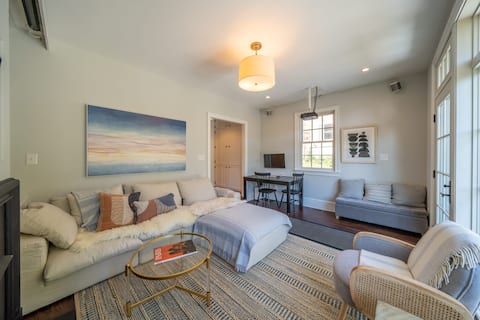
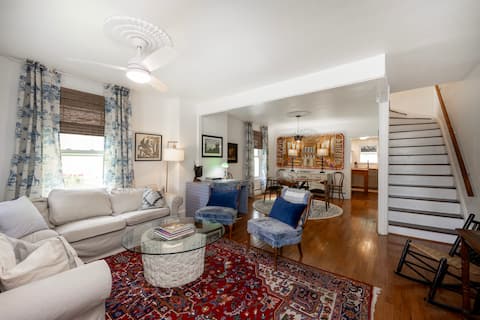
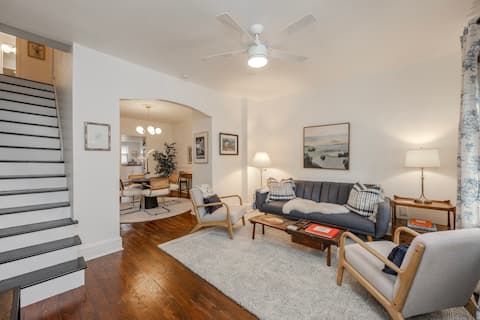
Top Performing Airbnb Properties in Kennett Square (2026)
Benchmark your potential! Explore examples of top-performing Airbnb properties in Kennett Squarebased on Trailing Twelve Month (TTM) revenue. Analyze their characteristics, revenue, occupancy rate, and ADR to understand what drives success in this market.
The Historic Walton House by RPG
Entire Place • 3 bedrooms
Historic Downtown D. Clark House Dog Friendly!
Entire Place • 3 bedrooms
Historic J. Pyle House Main St Location Pets OK!
Entire Place • 3 bedrooms
Longwood | Shops & Restaurants | Private Backyard
Entire Place • 3 bedrooms

Kennett Square | Near Longwood Gardens & Downtown
Entire Place • 4 bedrooms

Blue Lotus - a luxe cottage in Kennett Square
Entire Place • 1 bedroom
Note: Performance varies based on location, size, amenities, seasonality, and management quality. Data reflects the past 12 months.
Top Performing Airbnb Hosts in Kennett Square (2026)
Learn from the best! This table showcases top-performing Airbnb hosts in Kennett Square based on the number of properties managed and estimated total revenue over the past year. Analyze their scale and performance metrics.
| Host Name | Properties | Grossing Revenue | Stay Reviews | Avg Rating |
|---|---|---|---|---|
| Matt | 4 | $161,360 | 638 | 4.90/5.0 |
| Allie | 2 | $141,082 | 279 | 4.97/5.0 |
| Glenn And Kelly | 1 | $93,815 | 134 | 4.99/5.0 |
| Nathalie | 2 | $79,514 | 208 | 4.95/5.0 |
| Jessica | 1 | $58,060 | 235 | 4.97/5.0 |
| Linda | 1 | $57,372 | 72 | 4.75/5.0 |
| Joelle | 1 | $56,665 | 301 | 4.98/5.0 |
| Ivana | 1 | $53,168 | 194 | 4.97/5.0 |
| Silvia | 1 | $53,109 | 89 | 4.96/5.0 |
| John | 1 | $41,985 | 112 | 4.92/5.0 |
Analyzing the strategies of top hosts, such as their property selection, pricing, and guest communication, can offer valuable lessons for optimizing your own Airbnb operations in Kennett Square.
Dive Deeper: Advanced Kennett Square STR Market Data (2026)
Ready to unlock more insights? AirROI provides access to advanced metrics and comprehensive Airbnb data for Kennett Square. Explore detailed analytics beyond this report to refine your investment strategy, optimize pricing, and maximize your vacation rental profits.
Explore Advanced MetricsKennett Square Short-Term Rental Market Composition (2026): Property & Room Types
Room Type Distribution
Property Type Distribution
Market Composition Insights for Kennett Square
- The Kennett Square Airbnb market composition is heavily skewed towards Entire Home/Apt listings, which make up 78.6% of the 28 active rentals. This indicates strong guest preference for privacy and space.
- Looking at the property type distribution in Kennett Square, House properties are the most common (57.1%), reflecting the local real estate landscape.
- Houses represent a significant 57.1% portion, catering likely to families or larger groups.
- The presence of 10.7% Hotel/Boutique listings indicates integration with traditional hospitality.
Kennett Square Airbnb Room Capacity Analysis (2026): Bedroom Distribution
Distribution of Listings by Number of Bedrooms
Room Capacity Insights for Kennett Square
- The dominant room capacity in Kennett Square is 3 bedrooms listings, making up 25% of the market. This suggests a strong demand for properties suitable for families or small groups.
- Together, 3 bedrooms and 1 bedroom properties represent 50.0% of the active Airbnb listings in Kennett Square, indicating a high concentration in these sizes.
- A significant 28.6% of listings offer 3+ bedrooms, catering to larger groups and families seeking more space in Kennett Square.
Kennett Square Vacation Rental Guest Capacity Trends (2026)
Distribution of Listings by Guest Capacity
Guest Capacity Insights for Kennett Square
- The most common guest capacity trend in Kennett Square vacation rentals is listings accommodating 6 guests (28.6%). This suggests the primary traveler segment is likely larger groups.
- Properties designed for 6 guests and 2 guests dominate the Kennett Square STR market, accounting for 50.0% of listings.
- 46.5% of properties accommodate 6+ guests, serving the market segment for larger families or group travel in Kennett Square.
- On average, properties in Kennett Square are equipped to host 4.0 guests.
Kennett Square Airbnb Booking Patterns (2026): Available vs. Booked Days
Available Days Distribution
Booked Days Distribution
Booking Pattern Insights for Kennett Square
- The most common availability pattern in Kennett Square falls within the 91-180 days range, representing 57.1% of listings. This suggests many properties have significant open periods on their calendars.
- Approximately 42.8% of listings show high availability (181+ days open annually), indicating potential for increased bookings or specific owner usage patterns.
- For booked days, the 181-270 days range is most frequent in Kennett Square (57.1%), reflecting common guest stay durations or potential owner blocking patterns.
- A notable 57.1% of properties secure long booking periods (181+ days booked per year), highlighting successful long-term rental strategies or significant owner usage.
Kennett Square Airbnb Minimum Stay Requirements Analysis
Distribution of Listings by Minimum Night Requirement
1 Night
12 listings
42.9% of total
2 Nights
8 listings
28.6% of total
7-29 Nights
1 listings
3.6% of total
30+ Nights
7 listings
25% of total
Key Insights
- The most prevalent minimum stay requirement in Kennett Square is 1 Night, adopted by 42.9% of listings. This highlights the market's preference for shorter, flexible bookings.
- A strong majority (71.5%) of the Kennett Square Airbnb data shows acceptance of very short stays (1-2 nights), indicating a dynamic, high-turnover market.
- A significant segment (25%) caters to monthly stays (30+ nights) in Kennett Square, pointing to opportunities in the extended-stay market.
Recommendations
- Align with the market by considering a 1 Night minimum stay, as 42.9% of Kennett Square hosts use this setting.
- Explore offering discounts for stays of 30+ nights to attract the 25% of the market seeking extended stays.
- Adjust minimum nights based on seasonality – potentially shorter during low season and longer during peak demand periods in Kennett Square.
Kennett Square Airbnb Cancellation Policy Trends Analysis (2026)
Flexible
6 listings
22.2% of total
Moderate
12 listings
44.4% of total
Firm
9 listings
33.3% of total
Cancellation Policy Insights for Kennett Square
- The prevailing Airbnb cancellation policy trend in Kennett Square is Moderate, used by 44.4% of listings.
- There's a relatively balanced mix between guest-friendly (66.6%) and stricter (33.3%) policies, offering choices for different guest needs.
Recommendations for Hosts
- Consider adopting a Moderate policy to align with the 44.4% market standard in Kennett Square.
- Regularly review your cancellation policy against competitors and market demand shifts in Kennett Square.
Kennett Square STR Booking Lead Time Analysis (2026)
Average Booking Lead Time by Month
Booking Lead Time Insights for Kennett Square
- The overall average booking lead time for vacation rentals in Kennett Square is 54 days.
- Guests book furthest in advance for stays during September (average 83 days), likely coinciding with peak travel demand or local events.
- The shortest booking windows occur for stays in January (average 27 days), indicating more last-minute travel plans during this time.
- Seasonally, Fall (71 days avg.) sees the longest lead times, while Winter (33 days avg.) has the shortest, reflecting typical travel planning cycles.
Recommendations for Hosts
- Use the overall average lead time (54 days) as a baseline for your pricing and availability strategy in Kennett Square.
- For September stays, consider implementing length-of-stay discounts or slightly higher rates for bookings made less than 83 days out to capitalize on advance planning.
- Target marketing efforts for the Fall season well in advance (at least 71 days) to capture early planners.
- Monitor your own booking lead times against these Kennett Square averages to identify opportunities for dynamic pricing adjustments.
Popular & Essential Airbnb Amenities in Kennett Square (2026)
Amenity Prevalence
Amenity Insights for Kennett Square
- Essential amenities in Kennett Square that guests expect include: Hot water, Air conditioning, Carbon monoxide alarm, TV, Smoke alarm, Heating, Wifi, Fire extinguisher. Lacking these (any) could significantly impact bookings.
- Popular amenities like Kitchen, Essentials are common but not universal. Offering these can provide a competitive edge.
Recommendations for Hosts
- Ensure your listing includes all essential amenities for Kennett Square: Hot water, Air conditioning, Carbon monoxide alarm, TV, Smoke alarm, Heating, Wifi, Fire extinguisher.
- Prioritize adding missing essentials: Fire extinguisher.
- Consider adding popular differentiators like Kitchen or Essentials to increase appeal.
- Highlight unique or less common amenities you offer (e.g., hot tub, dedicated workspace, EV charger) in your listing description and photos.
- Regularly check competitor amenities in Kennett Square to stay competitive.
Kennett Square Airbnb Guest Demographics & Profile Analysis (2026)
Guest Profile Summary for Kennett Square
- The typical guest profile for Airbnb in Kennett Square consists of primarily domestic travelers (97%), often arriving from nearby New York, typically belonging to the Post-2000s (Gen Z/Alpha) group (50%), primarily speaking English or Spanish.
- Domestic travelers account for 96.5% of guests.
- Key international markets include United States (96.5%) and DC (2.1%).
- Top languages spoken are English (79.1%) followed by Spanish (8.1%).
- A significant demographic segment is the Post-2000s (Gen Z/Alpha) group, representing 50% of guests.
Recommendations for Hosts
- Target domestic marketing efforts towards travelers from New York and Kennett Square.
- Tailor amenities and listing descriptions to appeal to the dominant Post-2000s (Gen Z/Alpha) demographic (e.g., highlight fast WiFi, smart home features, local guides).
- Highlight unique local experiences or amenities relevant to the primary guest profile.
- Consider seasonal promotions aligned with peak travel times for key origin markets.
Nearby Short-Term Rental Market Comparison
How does the Kennett Square Airbnb market stack up against its neighbors? Compare key performance metrics like average monthly revenue, ADR, and occupancy rates in surrounding areas to understand the broader regional STR landscape.
| Market | Active Properties | Monthly Revenue | Daily Rate | Avg. Occupancy |
|---|---|---|---|---|
| Polk Township | 15 | $6,974 | $520.26 | 38% |
| Centreville | 17 | $6,298 | $565.66 | 45% |
| Mayo | 13 | $5,915 | $447.58 | 51% |
| Spring Lake Heights | 16 | $5,785 | $725.20 | 40% |
| Hilltown Township | 11 | $5,557 | $578.96 | 40% |
| Hellam Township | 24 | $5,496 | $386.69 | 45% |
| Cape May Point | 23 | $5,479 | $542.19 | 46% |
| Stone Harbor | 42 | $5,467 | $785.22 | 39% |
| Stevensville | 80 | $5,412 | $556.79 | 41% |
| Neptune City | 12 | $5,299 | $531.14 | 45% |