Jim Thorpe Airbnb Market Analysis 2026: Short Term Rental Data & Vacation Rental Statistics in Pennsylvania, United States
Is Airbnb profitable in Jim Thorpe in 2026? Explore comprehensive Airbnb analytics for Jim Thorpe, Pennsylvania, United States to uncover income potential. This 2026 STR market report for Jim Thorpe, based on AirROI data from February 2025 to January 2026, reveals key trends in the niche market of 108 active listings.
Whether you're considering an Airbnb investment in Jim Thorpe, optimizing your existing vacation rental, or exploring rental arbitrage opportunities, understanding the Jim Thorpe Airbnb data is crucial. Leveraging the low regulation environment is key to maximizing your short term rental income potential. Let's dive into the specifics.
Key Jim Thorpe Airbnb Performance Metrics Overview
Monthly Airbnb Revenue Variations & Income Potential in Jim Thorpe (2026)
Understanding the monthly revenue variations for Airbnb listings in Jim Thorpe is key to maximizing your short term rental income potential. Seasonality significantly impacts earnings. Our analysis, based on data from the past 12 months, shows that the peak revenue month for STRs in Jim Thorpe is typically October, while March often presents the lowest earnings, highlighting opportunities for strategic pricing adjustments during shoulder and low seasons. Explore the typical Airbnb income in Jim Thorpe across different performance tiers:
- Best-in-class properties (Top 10%) achieve $6,231+ monthly, often utilizing dynamic pricing and superior guest experiences.
- Strong performing properties (Top 25%) earn $4,142 or more, indicating effective management and desirable locations/amenities.
- Typical properties (Median) generate around $2,796 per month, representing the average market performance.
- Entry-level properties (Bottom 25%) see earnings around $1,698, often with potential for optimization.
Average Monthly Airbnb Earnings Trend in Jim Thorpe
Jim Thorpe Airbnb Occupancy Rate Trends (2026)
Maximize your bookings by understanding the Jim Thorpe STR occupancy trends. Seasonal demand shifts significantly influence how often properties are booked. Typically, Octobersees the highest demand (peak season occupancy), while March experiences the lowest (low season). Effective strategies, like adjusting minimum stays or offering promotions, can boost occupancy during slower periods. Here's how different property tiers perform in Jim Thorpe:
- Best-in-class properties (Top 10%) achieve 77%+ occupancy, indicating high desirability and potentially optimized availability.
- Strong performing properties (Top 25%) maintain 60% or higher occupancy, suggesting good market fit and guest satisfaction.
- Typical properties (Median) have an occupancy rate around 43%.
- Entry-level properties (Bottom 25%) average 26% occupancy, potentially facing higher vacancy.
Average Monthly Occupancy Rate Trend in Jim Thorpe
Average Daily Rate (ADR) Airbnb Trends in Jim Thorpe (2026)
Effective short term rental pricing strategy in Jim Thorpe involves understanding monthly ADR fluctuations. The Average Daily Rate (ADR) for Airbnb in Jim Thorpe typically peaks in December and dips lowest during March. Leveraging Airbnb dynamic pricing tools or strategies based on this seasonality can significantly boost revenue. Here's a look at the typical nightly rates achieved:
- Best-in-class properties (Top 10%) command rates of $473+ per night, often due to premium features or locations.
- Strong performing properties (Top 25%) achieve nightly rates of $302 or more.
- Typical properties (Median) charge around $215 per night.
- Entry-level properties (Bottom 25%) earn around $166 per night.
Average Daily Rate (ADR) Trend by Month in Jim Thorpe
Get Live Jim Thorpe Market Intelligence 👇

Explore Real-time Analytics
Airbnb Seasonality Analysis & Trends in Jim Thorpe (2026)
Peak Season (October, December, August)
- Revenue averages $4,389 per month
- Occupancy rates average 54.0%
- Daily rates average $273
Shoulder Season
- Revenue averages $3,413 per month
- Occupancy maintains around 44.2%
- Daily rates hold near $261
Low Season (February, March, April)
- Revenue drops to average $2,314 per month
- Occupancy decreases to average 34.6%
- Daily rates adjust to average $243
Seasonality Insights for Jim Thorpe
- The Airbnb seasonality in Jim Thorpe shows highly seasonal trends requiring careful strategy. While the sections above show seasonal averages, it's also insightful to look at the extremes:
- During the high season, the absolute peak month showcases Jim Thorpe's highest earning potential, with monthly revenues capable of climbing to $4,770, occupancy reaching a high of 58.8%, and ADRs peaking at $285.
- Conversely, the slowest single month of the year, typically falling within the low season, marks the market's lowest point. In this month, revenue might dip to $2,197, occupancy could drop to 31.4%, and ADRs may adjust down to $242.
- Understanding both the seasonal averages and these monthly peaks and troughs in revenue, occupancy, and ADR is crucial for maximizing your Airbnb profit potential in Jim Thorpe.
Seasonal Strategies for Maximizing Profit
- Peak Season: Maximize revenue through premium pricing and potentially longer minimum stays. Ensure high availability.
- Low Season: Offer competitive pricing, special promotions (e.g., extended stay discounts), and flexible cancellation policies. Target off-season travelers like remote workers or budget-conscious guests.
- Shoulder Seasons: Implement dynamic pricing that balances peak and low rates. Target weekend travelers or specific events. Offer slightly more flexible terms than peak season.
- Regularly analyze your own performance against these Jim Thorpe seasonality benchmarks and adjust your pricing and availability strategy accordingly.
Best Areas for Airbnb Investment in Jim Thorpe (2026)
Exploring the top neighborhoods for short-term rentals in Jim Thorpe? This section highlights key areas, outlining why they are attractive for hosts and guests, along with notable local attractions. Consider these locations based on your target guest profile and investment strategy.
| Neighborhood / Area | Why Host Here? (Target Guests & Appeal) | Key Attractions & Landmarks |
|---|---|---|
| Historic District | Jim Thorpe's charming downtown with 19th-century architecture, rich history, and a vibrant atmosphere. A perfect spot for tourists who want to explore the town's heritage and enjoy local shops and restaurants. | Mauch Chunk Museum, Old Jail Museum, Lehigh Gorge Scenic Railway, Jim Thorpe Memorial, St. Mark's Episcopal Church |
| Luzerne Street | A quiet residential area that offers easy access to the main attractions of Jim Thorpe while providing a peaceful environment for guests. Ideal for families and longer stays. | Bicycle and Walking Trails, Luzerne County Historical Society, Local Parks |
| Carbon County | Surrounding Jim Thorpe, Carbon County offers beautiful nature and outdoor activities, attracting nature lovers. Close proximity to hiking trails and scenic overlooks. | Lehigh Gorge State Park, Nockamixon State Park, Appalachian Trail, Hickory Run State Park |
| Hickory Run State Park | A popular outdoor destination for travelers interested in hiking, camping, and enjoying nature. Perfect for outdoor enthusiasts and adventure seekers. | Sand Springs Lake, Hickory Run Boulder Field, Numerous Hiking Trails, Snowshoeing and Cross-Country Skiing in winter |
| Packer Hill | A scenic and elevated neighborhood offering stunning views of Jim Thorpe. Great for visitors who appreciate landscapes and photo opportunities. | Scenic Overlooks, Quiet Parks, Historic Homes |
| Beltzville Lake | Located nearby, this area offers recreational opportunities such as boating, fishing, and picnicking. Attractive to families and groups looking for outdoor fun. | Beltzville State Park, Fishing and Boating, Swimming Areas |
| Mauch Chunk Lake Park | An excellent destination for those who enjoy being near water and recreational activities. Offers a mix of relaxation and adventure. | Picnicking Facilities, Fishing, Walking Trails |
| Skirmish USA | An adventure park that attracts adrenaline junkies for paintball and other activities. Great for groups looking for unique and active experiences during their stay. | Paintball Fields, Group Activities, Team Building Experiences |
Understanding Airbnb License Requirements & STR Laws in Jim Thorpe (2026)
While Jim Thorpe, Pennsylvania, United States currently shows low STR regulations, specific Airbnb license requirements might still exist or change. Always verify the latest short term rental regulations and Airbnb license requirements directly with local government authorities for Jim Thorpe to ensure full compliance before hosting.
(Source: AirROI data, 2026, finding no licensed listings among those analyzed)
Top Performing Airbnb Properties in Jim Thorpe (2026)
Benchmark your potential! Explore examples of top-performing Airbnb properties in Jim Thorpebased on Trailing Twelve Month (TTM) revenue. Analyze their characteristics, revenue, occupancy rate, and ADR to understand what drives success in this market.
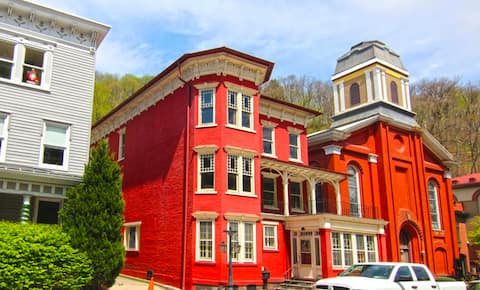
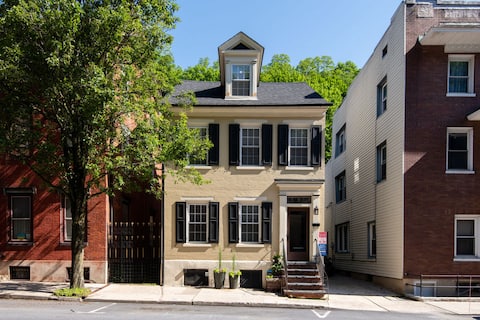
Victorian Mansion in Historic Jim Thorpe
Entire Place • 5 bedrooms
The Owl House – 3 Bedrooms (All Kings!)+3.5 Baths
Entire Place • 3 bedrooms

Victorian Balcony Level in Historic Jim Thorpe
Entire Place • 3 bedrooms

Game Room, Mins To Jim Thorpe & Jack Frost Skiing
Entire Place • 4 bedrooms
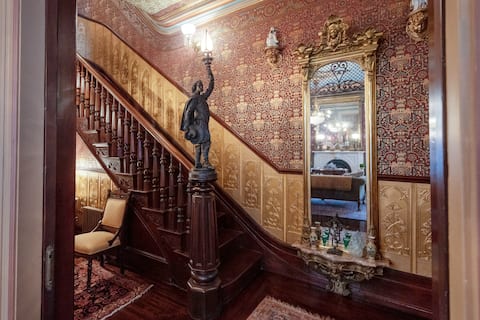
Magnificent Victorian Townhouse with Parking.
Entire Place • 5 bedrooms

Rustic Chalet For Large Groups Near Jim Thorpe
Entire Place • 6 bedrooms
Note: Performance varies based on location, size, amenities, seasonality, and management quality. Data reflects the past 12 months.
Top Performing Airbnb Hosts in Jim Thorpe (2026)
Learn from the best! This table showcases top-performing Airbnb hosts in Jim Thorpe based on the number of properties managed and estimated total revenue over the past year. Analyze their scale and performance metrics.
| Host Name | Properties | Grossing Revenue | Stay Reviews | Avg Rating |
|---|---|---|---|---|
| Jeffrey | 11 | $513,440 | 3884 | 4.98/5.0 |
| Kate | 10 | $306,093 | 297 | 4.96/5.0 |
| Cathleen | 3 | $257,868 | 88 | 4.97/5.0 |
| Liza | 2 | $238,662 | 118 | 4.98/5.0 |
| Patricia | 6 | $222,379 | 761 | 4.85/5.0 |
| Brian And Kylie | 3 | $140,505 | 258 | 4.96/5.0 |
| Brian | 1 | $132,724 | 59 | 5.00/5.0 |
| Michelle | 1 | $89,843 | 181 | 5.00/5.0 |
| Laura | 4 | $89,674 | 356 | 4.97/5.0 |
| Aubrey | 2 | $84,126 | 87 | 4.59/5.0 |
Analyzing the strategies of top hosts, such as their property selection, pricing, and guest communication, can offer valuable lessons for optimizing your own Airbnb operations in Jim Thorpe.
Dive Deeper: Advanced Jim Thorpe STR Market Data (2026)
Ready to unlock more insights? AirROI provides access to advanced metrics and comprehensive Airbnb data for Jim Thorpe. Explore detailed analytics beyond this report to refine your investment strategy, optimize pricing, and maximize your vacation rental profits.
Explore Advanced MetricsJim Thorpe Short-Term Rental Market Composition (2026): Property & Room Types
Room Type Distribution
Property Type Distribution
Market Composition Insights for Jim Thorpe
- The Jim Thorpe Airbnb market composition is heavily skewed towards Entire Home/Apt listings, which make up 78.7% of the 108 active rentals. This indicates strong guest preference for privacy and space.
- Looking at the property type distribution in Jim Thorpe, House properties are the most common (49.1%), reflecting the local real estate landscape.
- Houses represent a significant 49.1% portion, catering likely to families or larger groups.
- The presence of 16.7% Hotel/Boutique listings indicates integration with traditional hospitality.
Jim Thorpe Airbnb Room Capacity Analysis (2026): Bedroom Distribution
Distribution of Listings by Number of Bedrooms
Room Capacity Insights for Jim Thorpe
- The dominant room capacity in Jim Thorpe is 1 bedroom listings, making up 29.6% of the market. This suggests a strong demand for properties suitable for couples or solo travelers.
- Together, 1 bedroom and 2 bedrooms properties represent 50.9% of the active Airbnb listings in Jim Thorpe, indicating a high concentration in these sizes.
- A significant 34.3% of listings offer 3+ bedrooms, catering to larger groups and families seeking more space in Jim Thorpe.
Jim Thorpe Vacation Rental Guest Capacity Trends (2026)
Distribution of Listings by Guest Capacity
Guest Capacity Insights for Jim Thorpe
- The most common guest capacity trend in Jim Thorpe vacation rentals is listings accommodating 8+ guests (25.9%). This suggests the primary traveler segment is likely larger groups.
- Properties designed for 8+ guests and 4 guests dominate the Jim Thorpe STR market, accounting for 48.1% of listings.
- 46.2% of properties accommodate 6+ guests, serving the market segment for larger families or group travel in Jim Thorpe.
- On average, properties in Jim Thorpe are equipped to host 4.7 guests.
Jim Thorpe Airbnb Booking Patterns (2026): Available vs. Booked Days
Available Days Distribution
Booked Days Distribution
Booking Pattern Insights for Jim Thorpe
- The most common availability pattern in Jim Thorpe falls within the 181-270 days range, representing 39.8% of listings. This suggests many properties have significant open periods on their calendars.
- Approximately 70.4% of listings show high availability (181+ days open annually), indicating potential for increased bookings or specific owner usage patterns.
- For booked days, the 91-180 days range is most frequent in Jim Thorpe (40.7%), reflecting common guest stay durations or potential owner blocking patterns.
- A notable 29.6% of properties secure long booking periods (181+ days booked per year), highlighting successful long-term rental strategies or significant owner usage.
Jim Thorpe Airbnb Minimum Stay Requirements Analysis
Distribution of Listings by Minimum Night Requirement
1 Night
36 listings
33.3% of total
2 Nights
41 listings
38% of total
4-6 Nights
1 listings
0.9% of total
30+ Nights
30 listings
27.8% of total
Key Insights
- The most prevalent minimum stay requirement in Jim Thorpe is 2 Nights, adopted by 38% of listings. This highlights the market's preference for shorter, flexible bookings.
- A strong majority (71.3%) of the Jim Thorpe Airbnb data shows acceptance of very short stays (1-2 nights), indicating a dynamic, high-turnover market.
- A significant segment (27.8%) caters to monthly stays (30+ nights) in Jim Thorpe, pointing to opportunities in the extended-stay market.
Recommendations
- Align with the market by considering a 2 Nights minimum stay, as 38% of Jim Thorpe hosts use this setting.
- Explore offering discounts for stays of 30+ nights to attract the 27.8% of the market seeking extended stays.
- Adjust minimum nights based on seasonality – potentially shorter during low season and longer during peak demand periods in Jim Thorpe.
Jim Thorpe Airbnb Cancellation Policy Trends Analysis (2026)
Limited
4 listings
3.7% of total
Flexible
10 listings
9.3% of total
Moderate
32 listings
29.6% of total
Firm
49 listings
45.4% of total
Strict
13 listings
12% of total
Cancellation Policy Insights for Jim Thorpe
- The prevailing Airbnb cancellation policy trend in Jim Thorpe is Firm, used by 45.4% of listings.
- A majority (57.4%) of hosts in Jim Thorpe utilize Firm or Strict policies, indicating a market where hosts prioritize booking security.
Recommendations for Hosts
- Consider adopting a Firm policy to align with the 45.4% market standard in Jim Thorpe.
- Using a Strict policy might deter some guests, as only 12% of listings use it. Evaluate if potential revenue protection outweighs possible lower booking rates.
- Regularly review your cancellation policy against competitors and market demand shifts in Jim Thorpe.
Jim Thorpe STR Booking Lead Time Analysis (2026)
Average Booking Lead Time by Month
Booking Lead Time Insights for Jim Thorpe
- The overall average booking lead time for vacation rentals in Jim Thorpe is 52 days.
- Guests book furthest in advance for stays during October (average 79 days), likely coinciding with peak travel demand or local events.
- The shortest booking windows occur for stays in March (average 36 days), indicating more last-minute travel plans during this time.
- Seasonally, Fall (60 days avg.) sees the longest lead times, while Winter (48 days avg.) has the shortest, reflecting typical travel planning cycles.
Recommendations for Hosts
- Use the overall average lead time (52 days) as a baseline for your pricing and availability strategy in Jim Thorpe.
- For October stays, consider implementing length-of-stay discounts or slightly higher rates for bookings made less than 79 days out to capitalize on advance planning.
- Target marketing efforts for the Fall season well in advance (at least 60 days) to capture early planners.
- Monitor your own booking lead times against these Jim Thorpe averages to identify opportunities for dynamic pricing adjustments.
Popular & Essential Airbnb Amenities in Jim Thorpe (2026)
Amenity Prevalence
Amenity Insights for Jim Thorpe
- Popular amenities like Wifi, Air conditioning, TV are common but not universal. Offering these can provide a competitive edge.
- Warning: Wifi is not universally provided but is considered essential globally. Ensure reliable Wifi is offered.
Recommendations for Hosts
- Consider adding popular differentiators like Wifi or Air conditioning to increase appeal.
- Highlight unique or less common amenities you offer (e.g., hot tub, dedicated workspace, EV charger) in your listing description and photos.
- Regularly check competitor amenities in Jim Thorpe to stay competitive.
Jim Thorpe Airbnb Guest Demographics & Profile Analysis (2026)
Guest Profile Summary for Jim Thorpe
- The typical guest profile for Airbnb in Jim Thorpe consists of primarily domestic travelers (97%), often arriving from nearby Philadelphia, typically belonging to the Post-2000s (Gen Z/Alpha) group (50%), primarily speaking English or Spanish.
- Domestic travelers account for 97.3% of guests.
- Key international markets include United States (97.3%) and DC (1%).
- Top languages spoken are English (74.4%) followed by Spanish (12.5%).
- A significant demographic segment is the Post-2000s (Gen Z/Alpha) group, representing 50% of guests.
Recommendations for Hosts
- Target domestic marketing efforts towards travelers from Philadelphia and New York.
- Tailor amenities and listing descriptions to appeal to the dominant Post-2000s (Gen Z/Alpha) demographic (e.g., highlight fast WiFi, smart home features, local guides).
- Highlight unique local experiences or amenities relevant to the primary guest profile.
- Consider seasonal promotions aligned with peak travel times for key origin markets.
Nearby Short-Term Rental Market Comparison
How does the Jim Thorpe Airbnb market stack up against its neighbors? Compare key performance metrics like average monthly revenue, ADR, and occupancy rates in surrounding areas to understand the broader regional STR landscape.
| Market | Active Properties | Monthly Revenue | Daily Rate | Avg. Occupancy |
|---|---|---|---|---|
| Freeland | 11 | $8,436 | $684.29 | 42% |
| Berlin Township | 15 | $7,208 | $729.10 | 35% |
| Polk Township | 15 | $6,974 | $520.26 | 38% |
| Town of Kingston | 10 | $6,470 | $473.76 | 49% |
| Frankford Township | 11 | $6,329 | $505.19 | 41% |
| Centreville | 17 | $6,298 | $565.66 | 45% |
| Spring Lake Heights | 16 | $5,785 | $725.20 | 40% |
| Stroud Township | 137 | $5,728 | $478.40 | 40% |
| Town of Monroe | 22 | $5,690 | $720.52 | 37% |
| Hilltown Township | 11 | $5,557 | $578.96 | 40% |