Foster Township Airbnb Market Analysis 2026: Short Term Rental Data & Vacation Rental Statistics in Pennsylvania, United States
Is Airbnb profitable in Foster Township in 2026? Explore comprehensive Airbnb analytics for Foster Township, Pennsylvania, United States to uncover income potential. This 2026 STR market report for Foster Township, based on AirROI data from February 2025 to January 2026, reveals key trends in the niche market of 22 active listings.
Whether you're considering an Airbnb investment in Foster Township, optimizing your existing vacation rental, or exploring rental arbitrage opportunities, understanding the Foster Township Airbnb data is crucial. Leveraging the low regulation environment is key to maximizing your short term rental income potential. Let's dive into the specifics.
Key Foster Township Airbnb Performance Metrics Overview
Monthly Airbnb Revenue Variations & Income Potential in Foster Township (2026)
Understanding the monthly revenue variations for Airbnb listings in Foster Township is key to maximizing your short term rental income potential. Seasonality significantly impacts earnings. Our analysis, based on data from the past 12 months, shows that the peak revenue month for STRs in Foster Township is typically July, while April often presents the lowest earnings, highlighting opportunities for strategic pricing adjustments during shoulder and low seasons. Explore the typical Airbnb income in Foster Township across different performance tiers:
- Best-in-class properties (Top 10%) achieve $16,497+ monthly, often utilizing dynamic pricing and superior guest experiences.
- Strong performing properties (Top 25%) earn $9,386 or more, indicating effective management and desirable locations/amenities.
- Typical properties (Median) generate around $4,208 per month, representing the average market performance.
- Entry-level properties (Bottom 25%) see earnings around $1,177, often with potential for optimization.
Average Monthly Airbnb Earnings Trend in Foster Township
Foster Township Airbnb Occupancy Rate Trends (2026)
Maximize your bookings by understanding the Foster Township STR occupancy trends. Seasonal demand shifts significantly influence how often properties are booked. Typically, Augustsees the highest demand (peak season occupancy), while May experiences the lowest (low season). Effective strategies, like adjusting minimum stays or offering promotions, can boost occupancy during slower periods. Here's how different property tiers perform in Foster Township:
- Best-in-class properties (Top 10%) achieve 77%+ occupancy, indicating high desirability and potentially optimized availability.
- Strong performing properties (Top 25%) maintain 51% or higher occupancy, suggesting good market fit and guest satisfaction.
- Typical properties (Median) have an occupancy rate around 32%.
- Entry-level properties (Bottom 25%) average 20% occupancy, potentially facing higher vacancy.
Average Monthly Occupancy Rate Trend in Foster Township
Average Daily Rate (ADR) Airbnb Trends in Foster Township (2026)
Effective short term rental pricing strategy in Foster Township involves understanding monthly ADR fluctuations. The Average Daily Rate (ADR) for Airbnb in Foster Township typically peaks in December and dips lowest during March. Leveraging Airbnb dynamic pricing tools or strategies based on this seasonality can significantly boost revenue. Here's a look at the typical nightly rates achieved:
- Best-in-class properties (Top 10%) command rates of $1,272+ per night, often due to premium features or locations.
- Strong performing properties (Top 25%) achieve nightly rates of $859 or more.
- Typical properties (Median) charge around $259 per night.
- Entry-level properties (Bottom 25%) earn around $140 per night.
Average Daily Rate (ADR) Trend by Month in Foster Township
Get Live Foster Township Market Intelligence 👇
Explore Real-time Analytics
Airbnb Seasonality Analysis & Trends in Foster Township (2026)
Peak Season (July, August, December)
- Revenue averages $8,144 per month
- Occupancy rates average 45.0%
- Daily rates average $518
Shoulder Season
- Revenue averages $5,714 per month
- Occupancy maintains around 35.7%
- Daily rates hold near $490
Low Season (March, April, October)
- Revenue drops to average $4,631 per month
- Occupancy decreases to average 33.3%
- Daily rates adjust to average $460
Seasonality Insights for Foster Township
- The Airbnb seasonality in Foster Township shows highly seasonal trends requiring careful strategy. While the sections above show seasonal averages, it's also insightful to look at the extremes:
- During the high season, the absolute peak month showcases Foster Township's highest earning potential, with monthly revenues capable of climbing to $8,672, occupancy reaching a high of 51.2%, and ADRs peaking at $587.
- Conversely, the slowest single month of the year, typically falling within the low season, marks the market's lowest point. In this month, revenue might dip to $4,141, occupancy could drop to 28.1%, and ADRs may adjust down to $416.
- Understanding both the seasonal averages and these monthly peaks and troughs in revenue, occupancy, and ADR is crucial for maximizing your Airbnb profit potential in Foster Township.
Seasonal Strategies for Maximizing Profit
- Peak Season: Maximize revenue through premium pricing and potentially longer minimum stays. Ensure high availability.
- Low Season: Offer competitive pricing, special promotions (e.g., extended stay discounts), and flexible cancellation policies. Target off-season travelers like remote workers or budget-conscious guests.
- Shoulder Seasons: Implement dynamic pricing that balances peak and low rates. Target weekend travelers or specific events. Offer slightly more flexible terms than peak season.
- Regularly analyze your own performance against these Foster Township seasonality benchmarks and adjust your pricing and availability strategy accordingly.
Best Areas for Airbnb Investment in Foster Township (2026)
Exploring the top neighborhoods for short-term rentals in Foster Township? This section highlights key areas, outlining why they are attractive for hosts and guests, along with notable local attractions. Consider these locations based on your target guest profile and investment strategy.
| Neighborhood / Area | Why Host Here? (Target Guests & Appeal) | Key Attractions & Landmarks |
|---|---|---|
| Foster Township | A serene community surrounded by natural beauty, ideal for visitors seeking relaxation and outdoor activities. Close proximity to recreational areas and local attractions makes it a charming spot for Airbnb guests. | Locust Lake State Park, Tuscarora State Park, Hickory Run State Park, Laurel Lake, Local hiking trails, Beautiful scenic views |
| Nesquehoning | A small town with a rich history and access to beautiful mountain landscapes. Perfect for guests interested in outdoor adventures such as hiking, fishing, and winter sports. | Nesquehoning Creek, Mauch Chunk Lake Park, Historical sites, Outdoor recreation areas, Local dining options |
| Jim Thorpe | Known as the 'Switzerland of America', this town features stunning views, historical architecture, and a vibrant arts scene, attracting many visitors year-round. | Lehighton Park, Old Jail Museum, Mauch Chunk Opera House, Scenic train rides, Hiking and biking trails |
| Palmerton | A quaint town with a strong sense of community and easy access to nearby state parks. Wonderful for guests who enjoy a small-town feel with outdoor activities. | Blue Mountain Ski Resort, Carbon County Environmental Education Center, Local festivals, Hiking trails |
| Weatherly | A peaceful borough that offers a glimpse into Pennsylvania's historic towns. Ideal for visitors looking for tranquility and nature. | Weatherly Historic District, Murderer's Creek, Local parks, Quiet scenic spots |
| Lansford | Rich in coal mining history, this town offers unique historic architecture and an intimate community vibe, attracting history buffs and nature lovers alike. | Lansford Historical Society, Swimming Pool Park, Local heritage events |
| Tamaqua | A town known for its historical significance and community spirit, with access to outdoor activities and local culture, ideal for family-friendly stays. | Tamaqua Historical Society, Local events and fairs, Outdoor parks, Nearby hiking areas |
| Schuylkill Haven | A charming borough situated along the Schuylkill River, perfect for those looking to enjoy both nature and local culture. Offers many recreational opportunities. | Schuylkill River Trail, Local parks, Historical sites, River activities |
Understanding Airbnb License Requirements & STR Laws in Foster Township (2026)
While Foster Township, Pennsylvania, United States currently shows low STR regulations, specific Airbnb license requirements might still exist or change. Always verify the latest short term rental regulations and Airbnb license requirements directly with local government authorities for Foster Township to ensure full compliance before hosting.
(Source: AirROI data, 2026, based on 5% licensed listings)
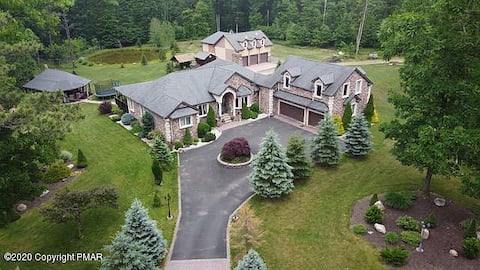
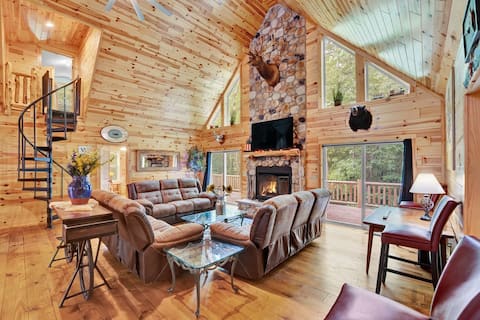
Top Performing Airbnb Properties in Foster Township (2026)
Benchmark your potential! Explore examples of top-performing Airbnb properties in Foster Townshipbased on Trailing Twelve Month (TTM) revenue. Analyze their characteristics, revenue, occupancy rate, and ADR to understand what drives success in this market.
Sleeps 30-(2) houses 11 BR 6.5 BA Pickleball WIFI!
Entire Place • 11 bedrooms
Valhalla River Haven on Lehigh River & bike trail
Entire Place • 9 bedrooms

Lakefront 70" TV Hot Tub Pool Table Fire Pit WIFI
Entire Place • 7 bedrooms

Secluded 8 BR 4 BA Sleeps 30 Hot Tub WIFI Fire Pit
Entire Place • 8 bedrooms

Grand Timber by AvantStay | Pool and Sports Court!
Entire Place • 5 bedrooms

Riverdance! Cabin by the Lehigh River!
Entire Place • 5 bedrooms
Note: Performance varies based on location, size, amenities, seasonality, and management quality. Data reflects the past 12 months.
Top Performing Airbnb Hosts in Foster Township (2026)
Learn from the best! This table showcases top-performing Airbnb hosts in Foster Township based on the number of properties managed and estimated total revenue over the past year. Analyze their scale and performance metrics.
| Host Name | Properties | Grossing Revenue | Stay Reviews | Avg Rating |
|---|---|---|---|---|
| Mike | 3 | $471,046 | 54 | 4.74/5.0 |
| Louise | 1 | $197,894 | 25 | 5.00/5.0 |
| Ray | 2 | $122,201 | 449 | 4.91/5.0 |
| Host #295509545 | 1 | $120,827 | 0 | Not Rated |
| Ara | 2 | $97,513 | 19 | 4.66/5.0 |
| Jacob | 1 | $58,165 | 220 | 4.91/5.0 |
| Linda | 1 | $38,744 | 194 | 4.90/5.0 |
| Justin | 1 | $29,804 | 21 | 4.86/5.0 |
| Mark | 1 | $27,922 | 17 | 4.88/5.0 |
| Steven | 1 | $18,483 | 38 | 4.84/5.0 |
Analyzing the strategies of top hosts, such as their property selection, pricing, and guest communication, can offer valuable lessons for optimizing your own Airbnb operations in Foster Township.
Dive Deeper: Advanced Foster Township STR Market Data (2026)
Ready to unlock more insights? AirROI provides access to advanced metrics and comprehensive Airbnb data for Foster Township. Explore detailed analytics beyond this report to refine your investment strategy, optimize pricing, and maximize your vacation rental profits.
Explore Advanced MetricsFoster Township Short-Term Rental Market Composition (2026): Property & Room Types
Room Type Distribution
Property Type Distribution
Market Composition Insights for Foster Township
- The Foster Township Airbnb market composition is heavily skewed towards Entire Home/Apt listings, which make up 86.4% of the 22 active rentals. This indicates strong guest preference for privacy and space.
- Looking at the property type distribution in Foster Township, Outdoor/Unique properties are the most common (40.9%), reflecting the local real estate landscape.
- Houses represent a significant 40.9% portion, catering likely to families or larger groups.
- The presence of 13.6% Hotel/Boutique listings indicates integration with traditional hospitality.
- Smaller segments like apartment/condo (combined 4.5%) offer potential for unique stay experiences.
Foster Township Airbnb Room Capacity Analysis (2026): Bedroom Distribution
Distribution of Listings by Number of Bedrooms
Room Capacity Insights for Foster Township
- The dominant room capacity in Foster Township is 5+ bedrooms listings, making up 40.9% of the market. This suggests a strong demand for properties suitable for families or small groups.
- Together, 5+ bedrooms and 3 bedrooms properties represent 63.6% of the active Airbnb listings in Foster Township, indicating a high concentration in these sizes.
- A significant 68.1% of listings offer 3+ bedrooms, catering to larger groups and families seeking more space in Foster Township.
Foster Township Vacation Rental Guest Capacity Trends (2026)
Distribution of Listings by Guest Capacity
Guest Capacity Insights for Foster Township
- The most common guest capacity trend in Foster Township vacation rentals is listings accommodating 8+ guests (59.1%). This suggests the primary traveler segment is likely larger groups.
- Properties designed for 8+ guests and 6 guests dominate the Foster Township STR market, accounting for 72.7% of listings.
- 72.7% of properties accommodate 6+ guests, serving the market segment for larger families or group travel in Foster Township.
- On average, properties in Foster Township are equipped to host 6.1 guests.
Foster Township Airbnb Booking Patterns (2026): Available vs. Booked Days
Available Days Distribution
Booked Days Distribution
Booking Pattern Insights for Foster Township
- The most common availability pattern in Foster Township falls within the 181-270 days range, representing 45.5% of listings. This suggests many properties have significant open periods on their calendars.
- Approximately 91.0% of listings show high availability (181+ days open annually), indicating potential for increased bookings or specific owner usage patterns.
- For booked days, the 91-180 days range is most frequent in Foster Township (40.9%), reflecting common guest stay durations or potential owner blocking patterns.
- A notable 13.6% of properties secure long booking periods (181+ days booked per year), highlighting successful long-term rental strategies or significant owner usage.
Foster Township Airbnb Minimum Stay Requirements Analysis
Distribution of Listings by Minimum Night Requirement
1 Night
5 listings
22.7% of total
2 Nights
12 listings
54.5% of total
30+ Nights
5 listings
22.7% of total
Key Insights
- The most prevalent minimum stay requirement in Foster Township is 2 Nights, adopted by 54.5% of listings. This highlights the market's preference for shorter, flexible bookings.
- A strong majority (77.2%) of the Foster Township Airbnb data shows acceptance of very short stays (1-2 nights), indicating a dynamic, high-turnover market.
- A significant segment (22.7%) caters to monthly stays (30+ nights) in Foster Township, pointing to opportunities in the extended-stay market.
Recommendations
- Align with the market by considering a 2 Nights minimum stay, as 54.5% of Foster Township hosts use this setting.
- If feasible, allowing 1-night stays, especially midweek or during low season, could capture last-minute bookings, as only 22.7% currently do.
- Explore offering discounts for stays of 30+ nights to attract the 22.7% of the market seeking extended stays.
- Adjust minimum nights based on seasonality – potentially shorter during low season and longer during peak demand periods in Foster Township.
Foster Township Airbnb Cancellation Policy Trends Analysis (2026)
Super Strict 30 Days
1 listings
4.5% of total
Flexible
3 listings
13.6% of total
Moderate
8 listings
36.4% of total
Firm
9 listings
40.9% of total
Strict
1 listings
4.5% of total
Cancellation Policy Insights for Foster Township
- The prevailing Airbnb cancellation policy trend in Foster Township is Firm, used by 40.9% of listings.
- There's a relatively balanced mix between guest-friendly (50.0%) and stricter (45.4%) policies, offering choices for different guest needs.
- Strict cancellation policies are quite rare (4.5%), potentially making listings with this policy less competitive unless justified by high demand or property type.
Recommendations for Hosts
- Consider adopting a Firm policy to align with the 40.9% market standard in Foster Township.
- Using a Strict policy might deter some guests, as only 4.5% of listings use it. Evaluate if potential revenue protection outweighs possible lower booking rates.
- Regularly review your cancellation policy against competitors and market demand shifts in Foster Township.
Foster Township STR Booking Lead Time Analysis (2026)
Average Booking Lead Time by Month
Booking Lead Time Insights for Foster Township
- The overall average booking lead time for vacation rentals in Foster Township is 74 days.
- Guests book furthest in advance for stays during August (average 94 days), likely coinciding with peak travel demand or local events.
- The shortest booking windows occur for stays in March (average 38 days), indicating more last-minute travel plans during this time.
- Seasonally, Summer (87 days avg.) sees the longest lead times, while Spring (56 days avg.) has the shortest, reflecting typical travel planning cycles.
Recommendations for Hosts
- Use the overall average lead time (74 days) as a baseline for your pricing and availability strategy in Foster Township.
- For August stays, consider implementing length-of-stay discounts or slightly higher rates for bookings made less than 94 days out to capitalize on advance planning.
- Target marketing efforts for the Summer season well in advance (at least 87 days) to capture early planners.
- Monitor your own booking lead times against these Foster Township averages to identify opportunities for dynamic pricing adjustments.
Popular & Essential Airbnb Amenities in Foster Township (2026)
Amenity Prevalence
No amenities with partial availability (less than 100%) were found to display in the chart. All essential amenities might be present in all listings. Check insights below.
Amenity Insights for Foster Township
- Essential amenities in Foster Township that guests expect include: Heating, Coffee maker, TV, Hot water, Smoke alarm, Microwave, Fire extinguisher, Extra pillows and blankets, Dishes and silverware, Wifi. Lacking these (any) could significantly impact bookings.
Recommendations for Hosts
- Ensure your listing includes all essential amenities for Foster Township: Heating, Coffee maker, TV, Hot water, Smoke alarm, Microwave, Fire extinguisher, Extra pillows and blankets, Dishes and silverware, Wifi.
- Highlight unique or less common amenities you offer (e.g., hot tub, dedicated workspace, EV charger) in your listing description and photos.
- Regularly check competitor amenities in Foster Township to stay competitive.
Foster Township Airbnb Guest Demographics & Profile Analysis (2026)
Guest Profile Summary for Foster Township
- The typical guest profile for Airbnb in Foster Township consists of primarily domestic travelers (97%), often arriving from nearby Philadelphia, typically belonging to the Post-2000s (Gen Z/Alpha) group (50%), primarily speaking English or Spanish.
- Domestic travelers account for 97.4% of guests.
- Key international markets include United States (97.4%) and DC (1.3%).
- Top languages spoken are English (70.9%) followed by Spanish (11.4%).
- A significant demographic segment is the Post-2000s (Gen Z/Alpha) group, representing 50% of guests.
Recommendations for Hosts
- Target domestic marketing efforts towards travelers from Philadelphia and New York.
- Tailor amenities and listing descriptions to appeal to the dominant Post-2000s (Gen Z/Alpha) demographic (e.g., highlight fast WiFi, smart home features, local guides).
- Highlight unique local experiences or amenities relevant to the primary guest profile.
- Consider seasonal promotions aligned with peak travel times for key origin markets.
Nearby Short-Term Rental Market Comparison
How does the Foster Township Airbnb market stack up against its neighbors? Compare key performance metrics like average monthly revenue, ADR, and occupancy rates in surrounding areas to understand the broader regional STR landscape.
| Market | Active Properties | Monthly Revenue | Daily Rate | Avg. Occupancy |
|---|---|---|---|---|
| Freeland | 11 | $8,436 | $684.29 | 42% |
| Berlin Township | 15 | $7,208 | $729.10 | 35% |
| Polk Township | 15 | $6,974 | $520.26 | 38% |
| Lemont | 21 | $6,940 | $873.93 | 37% |
| College Township | 83 | $6,551 | $848.63 | 36% |
| State College | 192 | $6,081 | $712.29 | 40% |
| Stroud Township | 137 | $5,728 | $478.40 | 40% |
| Hilltown Township | 11 | $5,557 | $578.96 | 40% |
| Town of Torrey | 34 | $5,535 | $437.35 | 50% |
| Hellam Township | 24 | $5,496 | $386.69 | 45% |