Ephrata Township Airbnb Market Analysis 2026: Short Term Rental Data & Vacation Rental Statistics in Pennsylvania, United States
Is Airbnb profitable in Ephrata Township in 2026? Explore comprehensive Airbnb analytics for Ephrata Township, Pennsylvania, United States to uncover income potential. This 2026 STR market report for Ephrata Township, based on AirROI data from February 2025 to January 2026, reveals key trends in the niche market of 20 active listings.
Whether you're considering an Airbnb investment in Ephrata Township, optimizing your existing vacation rental, or exploring rental arbitrage opportunities, understanding the Ephrata Township Airbnb data is crucial. Leveraging the low regulation environment is key to maximizing your short term rental income potential. Let's dive into the specifics.
Key Ephrata Township Airbnb Performance Metrics Overview
Monthly Airbnb Revenue Variations & Income Potential in Ephrata Township (2026)
Understanding the monthly revenue variations for Airbnb listings in Ephrata Township is key to maximizing your short term rental income potential. Seasonality significantly impacts earnings. Our analysis, based on data from the past 12 months, shows that the peak revenue month for STRs in Ephrata Township is typically October, while March often presents the lowest earnings, highlighting opportunities for strategic pricing adjustments during shoulder and low seasons. Explore the typical Airbnb income in Ephrata Township across different performance tiers:
- Best-in-class properties (Top 10%) achieve $4,159+ monthly, often utilizing dynamic pricing and superior guest experiences.
- Strong performing properties (Top 25%) earn $3,269 or more, indicating effective management and desirable locations/amenities.
- Typical properties (Median) generate around $2,393 per month, representing the average market performance.
- Entry-level properties (Bottom 25%) see earnings around $1,436, often with potential for optimization.
Average Monthly Airbnb Earnings Trend in Ephrata Township
Ephrata Township Airbnb Occupancy Rate Trends (2026)
Maximize your bookings by understanding the Ephrata Township STR occupancy trends. Seasonal demand shifts significantly influence how often properties are booked. Typically, Octobersees the highest demand (peak season occupancy), while March experiences the lowest (low season). Effective strategies, like adjusting minimum stays or offering promotions, can boost occupancy during slower periods. Here's how different property tiers perform in Ephrata Township:
- Best-in-class properties (Top 10%) achieve 85%+ occupancy, indicating high desirability and potentially optimized availability.
- Strong performing properties (Top 25%) maintain 74% or higher occupancy, suggesting good market fit and guest satisfaction.
- Typical properties (Median) have an occupancy rate around 60%.
- Entry-level properties (Bottom 25%) average 33% occupancy, potentially facing higher vacancy.
Average Monthly Occupancy Rate Trend in Ephrata Township
Average Daily Rate (ADR) Airbnb Trends in Ephrata Township (2026)
Effective short term rental pricing strategy in Ephrata Township involves understanding monthly ADR fluctuations. The Average Daily Rate (ADR) for Airbnb in Ephrata Township typically peaks in July and dips lowest during February. Leveraging Airbnb dynamic pricing tools or strategies based on this seasonality can significantly boost revenue. Here's a look at the typical nightly rates achieved:
- Best-in-class properties (Top 10%) command rates of $282+ per night, often due to premium features or locations.
- Strong performing properties (Top 25%) achieve nightly rates of $175 or more.
- Typical properties (Median) charge around $132 per night.
- Entry-level properties (Bottom 25%) earn around $103 per night.
Average Daily Rate (ADR) Trend by Month in Ephrata Township
Get Live Ephrata Township Market Intelligence 👇
Explore Real-time Analytics
Airbnb Seasonality Analysis & Trends in Ephrata Township (2026)
Peak Season (October, December, July)
- Revenue averages $2,900 per month
- Occupancy rates average 62.4%
- Daily rates average $159
Shoulder Season
- Revenue averages $2,535 per month
- Occupancy maintains around 54.6%
- Daily rates hold near $157
Low Season (February, March, April)
- Revenue drops to average $1,818 per month
- Occupancy decreases to average 50.2%
- Daily rates adjust to average $146
Seasonality Insights for Ephrata Township
- The Airbnb seasonality in Ephrata Township shows moderate seasonality with distinct peak and low periods. While the sections above show seasonal averages, it's also insightful to look at the extremes:
- During the high season, the absolute peak month showcases Ephrata Township's highest earning potential, with monthly revenues capable of climbing to $3,139, occupancy reaching a high of 65.2%, and ADRs peaking at $164.
- Conversely, the slowest single month of the year, typically falling within the low season, marks the market's lowest point. In this month, revenue might dip to $1,725, occupancy could drop to 44.6%, and ADRs may adjust down to $143.
- Understanding both the seasonal averages and these monthly peaks and troughs in revenue, occupancy, and ADR is crucial for maximizing your Airbnb profit potential in Ephrata Township.
Seasonal Strategies for Maximizing Profit
- Peak Season: Maximize revenue through premium pricing and potentially longer minimum stays. Ensure high availability.
- Low Season: Offer competitive pricing, special promotions (e.g., extended stay discounts), and flexible cancellation policies. Target off-season travelers like remote workers or budget-conscious guests.
- Shoulder Seasons: Implement dynamic pricing that balances peak and low rates. Target weekend travelers or specific events. Offer slightly more flexible terms than peak season.
- Regularly analyze your own performance against these Ephrata Township seasonality benchmarks and adjust your pricing and availability strategy accordingly.
Best Areas for Airbnb Investment in Ephrata Township (2026)
Exploring the top neighborhoods for short-term rentals in Ephrata Township? This section highlights key areas, outlining why they are attractive for hosts and guests, along with notable local attractions. Consider these locations based on your target guest profile and investment strategy.
| Neighborhood / Area | Why Host Here? (Target Guests & Appeal) | Key Attractions & Landmarks |
|---|---|---|
| Ephrata Borough | Charming small town atmosphere with historic sites and local craftsmanship. Attractive for visitors seeking a quaint getaway with access to local events and shopping. | Ephrata Cloister, Ephrata Performing Arts Center, Shady Maple Smorgasbord, Ephrata Main Theatre, Lancaster County Parks |
| Cocalico Creek | Beautiful natural area offering peaceful retreats and nature activities. Suitable for outdoor enthusiasts who enjoy kayaking, fishing, and hiking. | Cocalico Creek, Local hiking trails, Fishing spots, Scenic picnic areas |
| Ephrata Township Park | Well-maintained park providing recreational facilities and green space. Ideal for families and those looking for outdoor activities. | Walking trails, Playgrounds, Picnic areas, Sports fields |
| Lancaster County Amish Country | Unique cultural experience showcasing the Amish lifestyle. High interest from tourists for authentic experiences, crafts, and traditional food. | Amish farm tours, Local markets, Craft shops, Heritage Center |
| Blue Ridge Mountains | Offers stunning mountain views and outdoor adventures. Popular for those seeking hiking, nature, and scenic retreats. | Hiking trails, Scenic overlooks, Wildlife watching |
| Cocalico Valley | Rich agricultural area with beautiful landscapes. Visitors may enjoy farm stays, fresh produce, and local dining experiences. | Farmers markets, Agritourism activities, Countryside views |
| Daniel Boone Homestead | Historical site offering a glimpse into early colonial life. Engaging for history buffs and families. | Historic buildings, Guided tours, Nature trails |
| Wolf Sanctuary of PA | Unique attraction focused on wolf conservation. Captivates visitors interested in wildlife and education about wolves. | Guided tours, Educational programs, Wolf encounters |
Understanding Airbnb License Requirements & STR Laws in Ephrata Township (2026)
While Ephrata Township, Pennsylvania, United States currently shows low STR regulations, specific Airbnb license requirements might still exist or change. Always verify the latest short term rental regulations and Airbnb license requirements directly with local government authorities for Ephrata Township to ensure full compliance before hosting.
(Source: AirROI data, 2026, finding no licensed listings among those analyzed)
Top Performing Airbnb Properties in Ephrata Township (2026)
Benchmark your potential! Explore examples of top-performing Airbnb properties in Ephrata Townshipbased on Trailing Twelve Month (TTM) revenue. Analyze their characteristics, revenue, occupancy rate, and ADR to understand what drives success in this market.
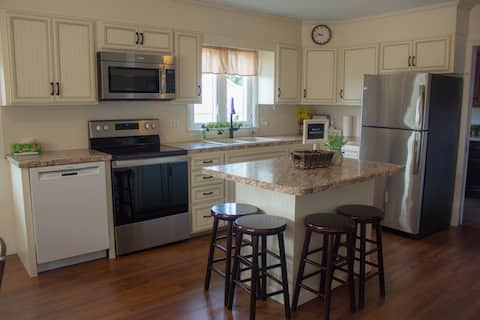
Charming Guesthouse in Ephrata
Entire Place • 4 bedrooms
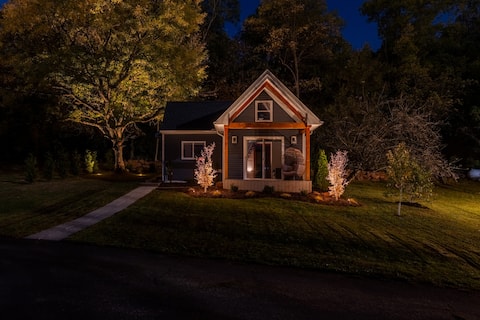
Bluebird Tiny Home W/Hottub!
Entire Place • 2 bedrooms

Cozy and Quiet Country Retreat
Entire Place • 2 bedrooms

First Floor Home in the Woods Near Amish Country
Entire Place • 2 bedrooms

Garden Spot Farm
Entire Place • 2 bedrooms
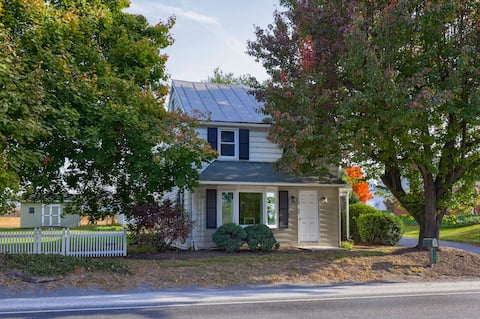
The Hinkletown Farmhouse
Entire Place • 3 bedrooms
Note: Performance varies based on location, size, amenities, seasonality, and management quality. Data reflects the past 12 months.
Top Performing Airbnb Hosts in Ephrata Township (2026)
Learn from the best! This table showcases top-performing Airbnb hosts in Ephrata Township based on the number of properties managed and estimated total revenue over the past year. Analyze their scale and performance metrics.
| Host Name | Properties | Grossing Revenue | Stay Reviews | Avg Rating |
|---|---|---|---|---|
| Brian | 6 | $100,776 | 69 | 4.33/5.0 |
| Mindy | 2 | $75,858 | 479 | 4.94/5.0 |
| Rose | 1 | $48,635 | 132 | 4.99/5.0 |
| Darren | 1 | $43,586 | 125 | 5.00/5.0 |
| Vanessa | 1 | $38,347 | 236 | 4.98/5.0 |
| Tonya | 1 | $37,417 | 39 | 5.00/5.0 |
| Kathryn | 1 | $35,301 | 95 | 4.87/5.0 |
| Anne | 1 | $31,058 | 46 | 5.00/5.0 |
| Lyndell | 1 | $28,028 | 274 | 4.99/5.0 |
| Janice | 1 | $18,669 | 97 | 4.93/5.0 |
Analyzing the strategies of top hosts, such as their property selection, pricing, and guest communication, can offer valuable lessons for optimizing your own Airbnb operations in Ephrata Township.
Dive Deeper: Advanced Ephrata Township STR Market Data (2026)
Ready to unlock more insights? AirROI provides access to advanced metrics and comprehensive Airbnb data for Ephrata Township. Explore detailed analytics beyond this report to refine your investment strategy, optimize pricing, and maximize your vacation rental profits.
Explore Advanced MetricsEphrata Township Short-Term Rental Market Composition (2026): Property & Room Types
Room Type Distribution
Property Type Distribution
Market Composition Insights for Ephrata Township
- The Ephrata Township Airbnb market composition is heavily skewed towards Entire Home/Apt listings, which make up 75% of the 20 active rentals. This indicates strong guest preference for privacy and space.
- Looking at the property type distribution in Ephrata Township, House properties are the most common (50%), reflecting the local real estate landscape.
- Houses represent a significant 50% portion, catering likely to families or larger groups.
- The presence of 20% Hotel/Boutique listings indicates integration with traditional hospitality.
Ephrata Township Airbnb Room Capacity Analysis (2026): Bedroom Distribution
Distribution of Listings by Number of Bedrooms
Room Capacity Insights for Ephrata Township
- The dominant room capacity in Ephrata Township is 1 bedroom listings, making up 45% of the market. This suggests a strong demand for properties suitable for couples or solo travelers.
- Together, 1 bedroom and 2 bedrooms properties represent 80.0% of the active Airbnb listings in Ephrata Township, indicating a high concentration in these sizes.
Ephrata Township Vacation Rental Guest Capacity Trends (2026)
Distribution of Listings by Guest Capacity
Guest Capacity Insights for Ephrata Township
- The most common guest capacity trend in Ephrata Township vacation rentals is listings accommodating 2 guests (30%). This suggests the primary traveler segment is likely couples or solo travelers.
- Properties designed for 2 guests and 4 guests dominate the Ephrata Township STR market, accounting for 60.0% of listings.
- 30.0% of properties accommodate 6+ guests, serving the market segment for larger families or group travel in Ephrata Township.
- On average, properties in Ephrata Township are equipped to host 4.2 guests.
Ephrata Township Airbnb Booking Patterns (2026): Available vs. Booked Days
Available Days Distribution
Booked Days Distribution
Booking Pattern Insights for Ephrata Township
- The most common availability pattern in Ephrata Township falls within the 91-180 days range, representing 45% of listings. This suggests many properties have significant open periods on their calendars.
- Approximately 40.0% of listings show high availability (181+ days open annually), indicating potential for increased bookings or specific owner usage patterns.
- For booked days, the 181-270 days range is most frequent in Ephrata Township (50%), reflecting common guest stay durations or potential owner blocking patterns.
- A notable 65.0% of properties secure long booking periods (181+ days booked per year), highlighting successful long-term rental strategies or significant owner usage.
Ephrata Township Airbnb Minimum Stay Requirements Analysis
Distribution of Listings by Minimum Night Requirement
1 Night
6 listings
30% of total
2 Nights
6 listings
30% of total
3 Nights
4 listings
20% of total
7-29 Nights
1 listings
5% of total
30+ Nights
3 listings
15% of total
Key Insights
- The most prevalent minimum stay requirement in Ephrata Township is 1 Night, adopted by 30% of listings. This highlights the market's preference for shorter, flexible bookings.
- A significant segment (15%) caters to monthly stays (30+ nights) in Ephrata Township, pointing to opportunities in the extended-stay market.
Recommendations
- Align with the market by considering a 1 Night minimum stay, as 30% of Ephrata Township hosts use this setting.
- Explore offering discounts for stays of 30+ nights to attract the 15% of the market seeking extended stays.
- Adjust minimum nights based on seasonality – potentially shorter during low season and longer during peak demand periods in Ephrata Township.
Ephrata Township Airbnb Cancellation Policy Trends Analysis (2026)
Limited
1 listings
5% of total
Flexible
5 listings
25% of total
Moderate
4 listings
20% of total
Firm
9 listings
45% of total
Strict
1 listings
5% of total
Cancellation Policy Insights for Ephrata Township
- The prevailing Airbnb cancellation policy trend in Ephrata Township is Firm, used by 45% of listings.
- There's a relatively balanced mix between guest-friendly (45.0%) and stricter (50.0%) policies, offering choices for different guest needs.
- Strict cancellation policies are quite rare (5%), potentially making listings with this policy less competitive unless justified by high demand or property type.
Recommendations for Hosts
- Consider adopting a Firm policy to align with the 45% market standard in Ephrata Township.
- Using a Strict policy might deter some guests, as only 5% of listings use it. Evaluate if potential revenue protection outweighs possible lower booking rates.
- Regularly review your cancellation policy against competitors and market demand shifts in Ephrata Township.
Ephrata Township STR Booking Lead Time Analysis (2026)
Average Booking Lead Time by Month
Booking Lead Time Insights for Ephrata Township
- The overall average booking lead time for vacation rentals in Ephrata Township is 35 days.
- Guests book furthest in advance for stays during June (average 49 days), likely coinciding with peak travel demand or local events.
- The shortest booking windows occur for stays in February (average 13 days), indicating more last-minute travel plans during this time.
- Seasonally, Summer (45 days avg.) sees the longest lead times, while Winter (25 days avg.) has the shortest, reflecting typical travel planning cycles.
Recommendations for Hosts
- Use the overall average lead time (35 days) as a baseline for your pricing and availability strategy in Ephrata Township.
- For June stays, consider implementing length-of-stay discounts or slightly higher rates for bookings made less than 49 days out to capitalize on advance planning.
- During February, focus on last-minute booking availability and promotions, as guests book with very short notice (13 days avg.).
- Target marketing efforts for the Summer season well in advance (at least 45 days) to capture early planners.
- Monitor your own booking lead times against these Ephrata Township averages to identify opportunities for dynamic pricing adjustments.
Popular & Essential Airbnb Amenities in Ephrata Township (2026)
Amenity Prevalence
Amenity Insights for Ephrata Township
- Essential amenities in Ephrata Township that guests expect include: Hot water, Free parking on premises, Essentials, Smoke alarm, Wifi, Heating, Air conditioning, Kitchen, Carbon monoxide alarm, Iron. Lacking these (any) could significantly impact bookings.
Recommendations for Hosts
- Ensure your listing includes all essential amenities for Ephrata Township: Hot water, Free parking on premises, Essentials, Smoke alarm, Wifi, Heating, Air conditioning, Kitchen, Carbon monoxide alarm, Iron.
- Prioritize adding missing essentials: Kitchen, Carbon monoxide alarm, Iron.
- Highlight unique or less common amenities you offer (e.g., hot tub, dedicated workspace, EV charger) in your listing description and photos.
- Regularly check competitor amenities in Ephrata Township to stay competitive.
Ephrata Township Airbnb Guest Demographics & Profile Analysis (2026)
Guest Profile Summary for Ephrata Township
- The typical guest profile for Airbnb in Ephrata Township consists of primarily domestic travelers (97%), often arriving from nearby New York, typically belonging to the Post-2000s (Gen Z/Alpha) group (50%), primarily speaking English or Spanish.
- Domestic travelers account for 97.0% of guests.
- Key international markets include United States (97%) and DC (0.8%).
- Top languages spoken are English (75.2%) followed by Spanish (9%).
- A significant demographic segment is the Post-2000s (Gen Z/Alpha) group, representing 50% of guests.
Recommendations for Hosts
- Target domestic marketing efforts towards travelers from New York and Philadelphia.
- Tailor amenities and listing descriptions to appeal to the dominant Post-2000s (Gen Z/Alpha) demographic (e.g., highlight fast WiFi, smart home features, local guides).
- Highlight unique local experiences or amenities relevant to the primary guest profile.
- Consider seasonal promotions aligned with peak travel times for key origin markets.
Nearby Short-Term Rental Market Comparison
How does the Ephrata Township Airbnb market stack up against its neighbors? Compare key performance metrics like average monthly revenue, ADR, and occupancy rates in surrounding areas to understand the broader regional STR landscape.
| Market | Active Properties | Monthly Revenue | Daily Rate | Avg. Occupancy |
|---|---|---|---|---|
| Freeland | 11 | $8,436 | $684.29 | 42% |
| Berlin Township | 15 | $7,208 | $729.10 | 35% |
| Polk Township | 15 | $6,974 | $520.26 | 38% |
| Lemont | 21 | $6,940 | $873.93 | 37% |
| College Township | 83 | $6,551 | $848.63 | 36% |
| Centreville | 17 | $6,298 | $565.66 | 45% |
| State College | 192 | $6,081 | $712.29 | 40% |
| Shannondale | 45 | $5,808 | $337.30 | 54% |
| Stroud Township | 137 | $5,728 | $478.40 | 40% |
| Hilltown Township | 11 | $5,557 | $578.96 | 40% |