Dreher Township Airbnb Market Analysis 2025: Short Term Rental Data & Vacation Rental Statistics in Pennsylvania, United States
Is Airbnb profitable in Dreher Township in 2025? Explore comprehensive Airbnb analytics for Dreher Township, Pennsylvania, United States to uncover income potential. This 2025 STR market report for Dreher Township, based on AirROI data from December 2024 to November 2025, reveals key trends in the niche market of 19 active listings.
Whether you're considering an Airbnb investment in Dreher Township, optimizing your existing vacation rental, or exploring rental arbitrage opportunities, understanding the Dreher Township Airbnb data is crucial. Leveraging the low regulation environment is key to maximizing your short term rental income potential. Let's dive into the specifics.
Key Dreher Township Airbnb Performance Metrics Overview
Monthly Airbnb Revenue Variations & Income Potential in Dreher Township (2025)
Understanding the monthly revenue variations for Airbnb listings in Dreher Township is key to maximizing your short term rental income potential. Seasonality significantly impacts earnings. Our analysis, based on data from the past 12 months, shows that the peak revenue month for STRs in Dreher Township is typically August, while September often presents the lowest earnings, highlighting opportunities for strategic pricing adjustments during shoulder and low seasons. Explore the typical Airbnb income in Dreher Township across different performance tiers:
- Best-in-class properties (Top 10%) achieve $9,583+ monthly, often utilizing dynamic pricing and superior guest experiences.
- Strong performing properties (Top 25%) earn $5,382 or more, indicating effective management and desirable locations/amenities.
- Typical properties (Median) generate around $1,732 per month, representing the average market performance.
- Entry-level properties (Bottom 25%) see earnings around $681, often with potential for optimization.
Average Monthly Airbnb Earnings Trend in Dreher Township
Dreher Township Airbnb Occupancy Rate Trends (2025)
Maximize your bookings by understanding the Dreher Township STR occupancy trends. Seasonal demand shifts significantly influence how often properties are booked. Typically, Octobersees the highest demand (peak season occupancy), while April experiences the lowest (low season). Effective strategies, like adjusting minimum stays or offering promotions, can boost occupancy during slower periods. Here's how different property tiers perform in Dreher Township:
- Best-in-class properties (Top 10%) achieve 66%+ occupancy, indicating high desirability and potentially optimized availability.
- Strong performing properties (Top 25%) maintain 49% or higher occupancy, suggesting good market fit and guest satisfaction.
- Typical properties (Median) have an occupancy rate around 33%.
- Entry-level properties (Bottom 25%) average 14% occupancy, potentially facing higher vacancy.
Average Monthly Occupancy Rate Trend in Dreher Township
Average Daily Rate (ADR) Airbnb Trends in Dreher Township (2025)
Effective short term rental pricing strategy in Dreher Township involves understanding monthly ADR fluctuations. The Average Daily Rate (ADR) for Airbnb in Dreher Township typically peaks in June and dips lowest during November. Leveraging Airbnb dynamic pricing tools or strategies based on this seasonality can significantly boost revenue. Here's a look at the typical nightly rates achieved:
- Best-in-class properties (Top 10%) command rates of $838+ per night, often due to premium features or locations.
- Strong performing properties (Top 25%) achieve nightly rates of $532 or more.
- Typical properties (Median) charge around $264 per night.
- Entry-level properties (Bottom 25%) earn around $113 per night.
Average Daily Rate (ADR) Trend by Month in Dreher Township
Get Live Dreher Township Market Intelligence 👇

Explore Real-time Analytics
Airbnb Seasonality Analysis & Trends in Dreher Township (2025)
Peak Season (August, July, December)
- Revenue averages $5,579 per month
- Occupancy rates average 43.9%
- Daily rates average $384
Shoulder Season
- Revenue averages $4,397 per month
- Occupancy maintains around 35.8%
- Daily rates hold near $370
Low Season (April, May, September)
- Revenue drops to average $2,960 per month
- Occupancy decreases to average 27.8%
- Daily rates adjust to average $361
Seasonality Insights for Dreher Township
- The Airbnb seasonality in Dreher Township shows highly seasonal trends requiring careful strategy. While the sections above show seasonal averages, it's also insightful to look at the extremes:
- During the high season, the absolute peak month showcases Dreher Township's highest earning potential, with monthly revenues capable of climbing to $5,866, occupancy reaching a high of 46.8%, and ADRs peaking at $396.
- Conversely, the slowest single month of the year, typically falling within the low season, marks the market's lowest point. In this month, revenue might dip to $2,633, occupancy could drop to 24.0%, and ADRs may adjust down to $350.
- Understanding both the seasonal averages and these monthly peaks and troughs in revenue, occupancy, and ADR is crucial for maximizing your Airbnb profit potential in Dreher Township.
Seasonal Strategies for Maximizing Profit
- Peak Season: Maximize revenue through premium pricing and potentially longer minimum stays. Ensure high availability.
- Low Season: Offer competitive pricing, special promotions (e.g., extended stay discounts), and flexible cancellation policies. Target off-season travelers like remote workers or budget-conscious guests.
- Shoulder Seasons: Implement dynamic pricing that balances peak and low rates. Target weekend travelers or specific events. Offer slightly more flexible terms than peak season.
- Regularly analyze your own performance against these Dreher Township seasonality benchmarks and adjust your pricing and availability strategy accordingly.
Best Areas for Airbnb Investment in Dreher Township (2025)
Exploring the top neighborhoods for short-term rentals in Dreher Township? This section highlights key areas, outlining why they are attractive for hosts and guests, along with notable local attractions. Consider these locations based on your target guest profile and investment strategy.
| Neighborhood / Area | Why Host Here? (Target Guests & Appeal) | Key Attractions & Landmarks |
|---|---|---|
| Lake Wallenpaupack | A popular recreational lake known for water sports, fishing, and summer cabins. Great destination for families and outdoor enthusiasts looking for a lakeside retreat. | Lake Wallenpaupack, Promised Land State Park, Tobyhanna State Park, Waterfront restaurants, Boat rentals |
| Hawley | Charming historic town near Lake Wallenpaupack, known for its quaint downtown and local shops. Attracts tourists looking for a peaceful getaway with small-town charm. | Lakeside Park, The Hawley Silk Mill, Claws 'N' Paws Wild Animal Park, Locust Lake State Park, Hawley Public Library |
| Dingmans Ferry | Gateway to beautiful natural parks and waterfalls, this area attracts nature lovers and hikers. Perfect for those seeking an immersive nature experience close to the Delaware Water Gap. | Delaware Water Gap National Recreation Area, Dingmans Falls, Bushkill Falls, Resica Falls, Multiple hiking trails |
| Palmyra Township | Offers easy access to Lake Wallenpaupack and several recreational areas. Popular among visitors looking for outdoor activities and family-friendly attractions. | Lake Wallenpaupack, Cove Haven Entertainment Resort, Wallenpaupack Scenic View Park, Local hiking trails, Fishing spots |
| Greentown | Peaceful location surrounded by nature, great for those looking for a serene getaway. Close to outdoor activities such as hiking, boating, and fishing. | Lake Wallenpaupack, Promised Land State Park, Local trails, Nearby fishing spots, Natural beauty |
| Milford | Historic town with a vibrant arts scene and close proximity to the Delaware River. Appeals to travelers interested in history, culture, and outdoor fun. | Milford Historic District, Delaware River, Grey Towers National Historic Site, Local art galleries, Shopping and dining |
| Shohola | A quiet township with access to the Delaware River. Ideal for those seeking a retreat in nature with fishing, canoeing, and outdoor activities. | Delaware River, Shohola Falls, Nearby parks, Camping areas, Fishing spots |
| Lackawaxen | Scenic area known for its access to the river and historical sites. Attracts tourists looking for adventure and leisure activities along the water. | Delaware River, Zane Grey Museum, Shooting Star Overlook, River Rafting, Nature trails |
Understanding Airbnb License Requirements & STR Laws in Dreher Township (2025)
While Dreher Township, Pennsylvania, United States currently shows low STR regulations, specific Airbnb license requirements might still exist or change. Always verify the latest short term rental regulations and Airbnb license requirements directly with local government authorities for Dreher Township to ensure full compliance before hosting.
(Source: AirROI data, 2025, finding no licensed listings among those analyzed)
Top Performing Airbnb Properties in Dreher Township (2025)
Benchmark your potential! Explore examples of top-performing Airbnb properties in Dreher Townshipbased on Trailing Twelve Month (TTM) revenue. Analyze their characteristics, revenue, occupancy rate, and ADR to understand what drives success in this market.

Otter Lodge - Private Pond!
Entire Place • 8 bedrooms

Mount Zurich-Poconos/Hot Tub/Pool Table/Playground
Entire Place • 5 bedrooms
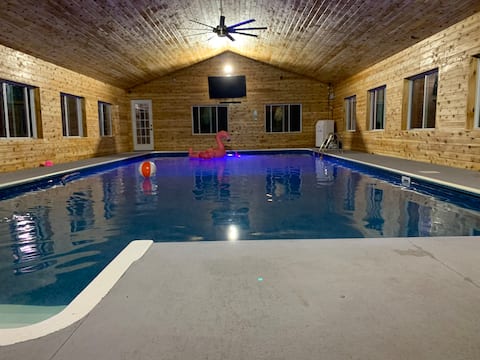
Tuscany Manor
Entire Place • 4 bedrooms
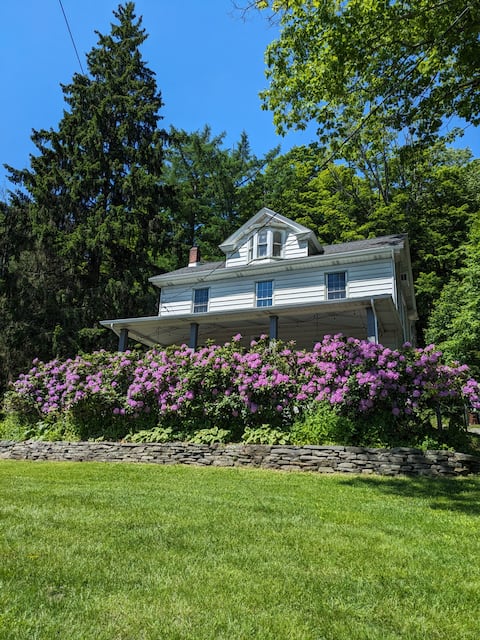
Large Farmhouse!
Entire Place • 4 bedrooms

Pocono Family Farmhouse w/KING BED & Game Room
Entire Place • 5 bedrooms
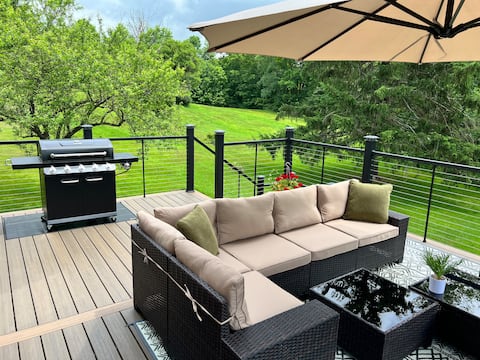
Blissful retreat|Hot tub|Playroom
Entire Place • 4 bedrooms
Note: Performance varies based on location, size, amenities, seasonality, and management quality. Data reflects the past 12 months.
Top Performing Airbnb Hosts in Dreher Township (2025)
Learn from the best! This table showcases top-performing Airbnb hosts in Dreher Township based on the number of properties managed and estimated total revenue over the past year. Analyze their scale and performance metrics.
| Host Name | Properties | Grossing Revenue | Stay Reviews | Avg Rating |
|---|---|---|---|---|
| Ashita | 1 | $266,341 | 49 | 5.00/5.0 |
| David N Nya | 1 | $86,287 | 36 | 5.00/5.0 |
| Silvio | 1 | $73,071 | 16 | 5.00/5.0 |
| Jonathan | 1 | $63,130 | 35 | 4.86/5.0 |
| Curt And Monique | 1 | $52,661 | 26 | 4.77/5.0 |
| Peter | 1 | $33,192 | 37 | 4.97/5.0 |
| Dominick | 4 | $31,439 | 7 | 5.00/5.0 |
| Jean | 1 | $28,234 | 89 | 4.90/5.0 |
| Kelly | 1 | $21,141 | 419 | 4.96/5.0 |
| John | 2 | $13,959 | 358 | 4.85/5.0 |
Analyzing the strategies of top hosts, such as their property selection, pricing, and guest communication, can offer valuable lessons for optimizing your own Airbnb operations in Dreher Township.
Dive Deeper: Advanced Dreher Township STR Market Data (2025)
Ready to unlock more insights? AirROI provides access to advanced metrics and comprehensive Airbnb data for Dreher Township. Explore detailed analytics beyond this report to refine your investment strategy, optimize pricing, and maximize your vacation rental profits.
Explore Advanced MetricsDreher Township Short-Term Rental Market Composition (2025): Property & Room Types
Room Type Distribution
Property Type Distribution
Market Composition Insights for Dreher Township
- The Dreher Township Airbnb market composition is heavily skewed towards Entire Home/Apt listings, which make up 78.9% of the 19 active rentals. This indicates strong guest preference for privacy and space.
- Looking at the property type distribution in Dreher Township, Outdoor/Unique properties are the most common (47.4%), reflecting the local real estate landscape.
- Houses represent a significant 47.4% portion, catering likely to families or larger groups.
- The presence of 5.3% Hotel/Boutique listings indicates integration with traditional hospitality.
Dreher Township Airbnb Room Capacity Analysis (2025): Bedroom Distribution
Distribution of Listings by Number of Bedrooms
Room Capacity Insights for Dreher Township
- The dominant room capacity in Dreher Township is 2 bedrooms listings, making up 15.8% of the market. This suggests a strong demand for properties suitable for couples or solo travelers.
- Together, 2 bedrooms and 4 bedrooms properties represent 31.6% of the active Airbnb listings in Dreher Township, indicating a high concentration in these sizes.
- A significant 42.1% of listings offer 3+ bedrooms, catering to larger groups and families seeking more space in Dreher Township.
Dreher Township Vacation Rental Guest Capacity Trends (2025)
Distribution of Listings by Guest Capacity
Guest Capacity Insights for Dreher Township
- The most common guest capacity trend in Dreher Township vacation rentals is listings accommodating 8+ guests (42.1%). This suggests the primary traveler segment is likely larger groups.
- Properties designed for 8+ guests and 4 guests dominate the Dreher Township STR market, accounting for 57.9% of listings.
- 52.6% of properties accommodate 6+ guests, serving the market segment for larger families or group travel in Dreher Township.
- On average, properties in Dreher Township are equipped to host 5.0 guests.
Dreher Township Airbnb Booking Patterns (2025): Available vs. Booked Days
Available Days Distribution
Booked Days Distribution
Booking Pattern Insights for Dreher Township
- The most common availability pattern in Dreher Township falls within the 271-366 days range, representing 57.9% of listings. This suggests many properties have significant open periods on their calendars.
- Approximately 89.5% of listings show high availability (181+ days open annually), indicating potential for increased bookings or specific owner usage patterns.
- For booked days, the 91-180 days range is most frequent in Dreher Township (36.8%), reflecting common guest stay durations or potential owner blocking patterns.
- A notable 10.5% of properties secure long booking periods (181+ days booked per year), highlighting successful long-term rental strategies or significant owner usage.
Dreher Township Airbnb Minimum Stay Requirements Analysis
Distribution of Listings by Minimum Night Requirement
1 Night
5 listings
26.3% of total
2 Nights
10 listings
52.6% of total
30+ Nights
4 listings
21.1% of total
Key Insights
- The most prevalent minimum stay requirement in Dreher Township is 2 Nights, adopted by 52.6% of listings. This highlights the market's preference for shorter, flexible bookings.
- A strong majority (78.9%) of the Dreher Township Airbnb data shows acceptance of very short stays (1-2 nights), indicating a dynamic, high-turnover market.
- A significant segment (21.1%) caters to monthly stays (30+ nights) in Dreher Township, pointing to opportunities in the extended-stay market.
Recommendations
- Align with the market by considering a 2 Nights minimum stay, as 52.6% of Dreher Township hosts use this setting.
- If feasible, allowing 1-night stays, especially midweek or during low season, could capture last-minute bookings, as only 26.3% currently do.
- Explore offering discounts for stays of 30+ nights to attract the 21.1% of the market seeking extended stays.
- Adjust minimum nights based on seasonality – potentially shorter during low season and longer during peak demand periods in Dreher Township.
Dreher Township Airbnb Cancellation Policy Trends Analysis (2025)
Flexible
8 listings
42.1% of total
Firm
8 listings
42.1% of total
Strict
3 listings
15.8% of total
Cancellation Policy Insights for Dreher Township
- The prevailing Airbnb cancellation policy trend in Dreher Township is Flexible, used by 42.1% of listings.
- A majority (57.9%) of hosts in Dreher Township utilize Firm or Strict policies, indicating a market where hosts prioritize booking security.
Recommendations for Hosts
- Consider adopting a Flexible policy to align with the 42.1% market standard in Dreher Township.
- Regularly review your cancellation policy against competitors and market demand shifts in Dreher Township.
Dreher Township STR Booking Lead Time Analysis (2025)
Average Booking Lead Time by Month
Booking Lead Time Insights for Dreher Township
- The overall average booking lead time for vacation rentals in Dreher Township is 66 days.
- Guests book furthest in advance for stays during August (average 104 days), likely coinciding with peak travel demand or local events.
- The shortest booking windows occur for stays in March (average 17 days), indicating more last-minute travel plans during this time.
- Seasonally, Summer (81 days avg.) sees the longest lead times, while Winter (23 days avg.) has the shortest, reflecting typical travel planning cycles.
Recommendations for Hosts
- Use the overall average lead time (66 days) as a baseline for your pricing and availability strategy in Dreher Township.
- For August stays, consider implementing length-of-stay discounts or slightly higher rates for bookings made less than 104 days out to capitalize on advance planning.
- Target marketing efforts for the Summer season well in advance (at least 81 days) to capture early planners.
- Monitor your own booking lead times against these Dreher Township averages to identify opportunities for dynamic pricing adjustments.
Popular & Essential Airbnb Amenities in Dreher Township (2025)
Amenity Prevalence
Amenity Insights for Dreher Township
- Essential amenities in Dreher Township that guests expect include: Smoke alarm, Coffee maker, Free parking on premises, Backyard, Heating, Carbon monoxide alarm. Lacking these (any) could significantly impact bookings.
- Popular amenities like Essentials, Hot water, Dishes and silverware are common but not universal. Offering these can provide a competitive edge.
Recommendations for Hosts
- Ensure your listing includes all essential amenities for Dreher Township: Smoke alarm, Coffee maker, Free parking on premises, Backyard, Heating, Carbon monoxide alarm.
- Consider adding popular differentiators like Essentials or Hot water to increase appeal.
- Highlight unique or less common amenities you offer (e.g., hot tub, dedicated workspace, EV charger) in your listing description and photos.
- Regularly check competitor amenities in Dreher Township to stay competitive.
Dreher Township Airbnb Guest Demographics & Profile Analysis (2025)
Guest Profile Summary for Dreher Township
- The typical guest profile for Airbnb in Dreher Township consists of primarily domestic travelers (97%), often arriving from nearby New York, typically belonging to the Post-2000s (Gen Z/Alpha) group (50%), primarily speaking English or Spanish.
- Domestic travelers account for 96.5% of guests.
- Key international markets include United States (96.5%) and Canada (2.1%).
- Top languages spoken are English (63.6%) followed by Spanish (21.6%).
- A significant demographic segment is the Post-2000s (Gen Z/Alpha) group, representing 50% of guests.
Recommendations for Hosts
- Target domestic marketing efforts towards travelers from New York and Philadelphia.
- Tailor amenities and listing descriptions to appeal to the dominant Post-2000s (Gen Z/Alpha) demographic (e.g., highlight fast WiFi, smart home features, local guides).
- Highlight unique local experiences or amenities relevant to the primary guest profile.
- Consider seasonal promotions aligned with peak travel times for key origin markets.
Nearby Short-Term Rental Market Comparison
How does the Dreher Township Airbnb market stack up against its neighbors? Compare key performance metrics like average monthly revenue, ADR, and occupancy rates in surrounding areas to understand the broader regional STR landscape.
| Market | Active Properties | Monthly Revenue | Daily Rate | Avg. Occupancy |
|---|---|---|---|---|
| Freeland | 11 | $8,887 | $727.45 | 41% |
| Berlin Township | 15 | $7,236 | $719.50 | 35% |
| Polk Township | 15 | $6,978 | $525.44 | 38% |
| Stroud Township | 136 | $6,165 | $490.08 | 42% |
| Frankford Township | 12 | $6,112 | $492.62 | 41% |
| Spring Lake Heights | 16 | $6,072 | $743.21 | 40% |
| Hellam Township | 24 | $5,840 | $393.26 | 45% |
| Town of Torrey | 34 | $5,675 | $446.47 | 51% |
| Town of Kingston | 12 | $5,672 | $470.26 | 44% |
| Foster Township | 21 | $5,621 | $533.53 | 39% |