Danville Airbnb Market Analysis 2026: Short Term Rental Data & Vacation Rental Statistics in Pennsylvania, United States
Is Airbnb profitable in Danville in 2026? Explore comprehensive Airbnb analytics for Danville, Pennsylvania, United States to uncover income potential. This 2026 STR market report for Danville, based on AirROI data from February 2025 to January 2026, reveals key trends in the niche market of 30 active listings.
Whether you're considering an Airbnb investment in Danville, optimizing your existing vacation rental, or exploring rental arbitrage opportunities, understanding the Danville Airbnb data is crucial. Leveraging the low regulation environment is key to maximizing your short term rental income potential. Let's dive into the specifics.
Key Danville Airbnb Performance Metrics Overview
Monthly Airbnb Revenue Variations & Income Potential in Danville (2026)
Understanding the monthly revenue variations for Airbnb listings in Danville is key to maximizing your short term rental income potential. Seasonality significantly impacts earnings. Our analysis, based on data from the past 12 months, shows that the peak revenue month for STRs in Danville is typically August, while February often presents the lowest earnings, highlighting opportunities for strategic pricing adjustments during shoulder and low seasons. Explore the typical Airbnb income in Danville across different performance tiers:
- Best-in-class properties (Top 10%) achieve $5,645+ monthly, often utilizing dynamic pricing and superior guest experiences.
- Strong performing properties (Top 25%) earn $2,813 or more, indicating effective management and desirable locations/amenities.
- Typical properties (Median) generate around $1,069 per month, representing the average market performance.
- Entry-level properties (Bottom 25%) see earnings around $513, often with potential for optimization.
Average Monthly Airbnb Earnings Trend in Danville
Danville Airbnb Occupancy Rate Trends (2026)
Maximize your bookings by understanding the Danville STR occupancy trends. Seasonal demand shifts significantly influence how often properties are booked. Typically, Augustsees the highest demand (peak season occupancy), while February experiences the lowest (low season). Effective strategies, like adjusting minimum stays or offering promotions, can boost occupancy during slower periods. Here's how different property tiers perform in Danville:
- Best-in-class properties (Top 10%) achieve 85%+ occupancy, indicating high desirability and potentially optimized availability.
- Strong performing properties (Top 25%) maintain 69% or higher occupancy, suggesting good market fit and guest satisfaction.
- Typical properties (Median) have an occupancy rate around 51%.
- Entry-level properties (Bottom 25%) average 33% occupancy, potentially facing higher vacancy.
Average Monthly Occupancy Rate Trend in Danville
Average Daily Rate (ADR) Airbnb Trends in Danville (2026)
Effective short term rental pricing strategy in Danville involves understanding monthly ADR fluctuations. The Average Daily Rate (ADR) for Airbnb in Danville typically peaks in December and dips lowest during September. Leveraging Airbnb dynamic pricing tools or strategies based on this seasonality can significantly boost revenue. Here's a look at the typical nightly rates achieved:
- Best-in-class properties (Top 10%) command rates of $272+ per night, often due to premium features or locations.
- Strong performing properties (Top 25%) achieve nightly rates of $176 or more.
- Typical properties (Median) charge around $49 per night.
- Entry-level properties (Bottom 25%) earn around $30 per night.
Average Daily Rate (ADR) Trend by Month in Danville
Get Live Danville Market Intelligence 👇

Explore Real-time Analytics
Airbnb Seasonality Analysis & Trends in Danville (2026)
Peak Season (August, January, December)
- Revenue averages $2,730 per month
- Occupancy rates average 54.8%
- Daily rates average $114
Shoulder Season
- Revenue averages $2,210 per month
- Occupancy maintains around 54.9%
- Daily rates hold near $112
Low Season (February, March, April)
- Revenue drops to average $1,095 per month
- Occupancy decreases to average 40.1%
- Daily rates adjust to average $107
Seasonality Insights for Danville
- The Airbnb seasonality in Danville shows highly seasonal trends requiring careful strategy. While the sections above show seasonal averages, it's also insightful to look at the extremes:
- During the high season, the absolute peak month showcases Danville's highest earning potential, with monthly revenues capable of climbing to $2,828, occupancy reaching a high of 67.4%, and ADRs peaking at $117.
- Conversely, the slowest single month of the year, typically falling within the low season, marks the market's lowest point. In this month, revenue might dip to $813, occupancy could drop to 36.3%, and ADRs may adjust down to $107.
- Understanding both the seasonal averages and these monthly peaks and troughs in revenue, occupancy, and ADR is crucial for maximizing your Airbnb profit potential in Danville.
Seasonal Strategies for Maximizing Profit
- Peak Season: Maximize revenue through premium pricing and potentially longer minimum stays. Ensure high availability.
- Low Season: Offer competitive pricing, special promotions (e.g., extended stay discounts), and flexible cancellation policies. Target off-season travelers like remote workers or budget-conscious guests.
- Shoulder Seasons: Implement dynamic pricing that balances peak and low rates. Target weekend travelers or specific events. Offer slightly more flexible terms than peak season.
- Regularly analyze your own performance against these Danville seasonality benchmarks and adjust your pricing and availability strategy accordingly.
Best Areas for Airbnb Investment in Danville (2026)
Exploring the top neighborhoods for short-term rentals in Danville? This section highlights key areas, outlining why they are attractive for hosts and guests, along with notable local attractions. Consider these locations based on your target guest profile and investment strategy.
| Neighborhood / Area | Why Host Here? (Target Guests & Appeal) | Key Attractions & Landmarks |
|---|---|---|
| Danville Main Street | The central business district provides convenient access to shops, restaurants, and local events, making it an attractive spot for visitors. | Danville Riverfront Park, Thomas Beaver Free Library, Danville Arts Council, Shamokin Dam, Local eateries and shops |
| Montour Preserve | A beautiful nature preserve offering outdoor activities such as hiking and wildlife viewing, appealing to nature enthusiasts and families seeking recreational options. | Montour Preserve trails, Wildlife observation, Fishing opportunities, Picnic areas |
| Geisinger Medical Center | This area attracts visiting medical professionals and families of patients, providing a steady stream of potential guests for short-term rentals. | Geisinger Medical Center, Health-related services, Local dining options nearby |
| Susquehanna River | Scenic views and outdoor activities along the river attract tourists looking to enjoy nature as well as recreational boating and fishing. | Susquehanna River Walk, Fishing spots, Water activities, Natural scenery |
| Fort Augusta Park | A local park that is popular for family outings and community events, drawing families and groups looking for leisure activities. | Playgrounds, Picnic areas, Community events, Recreational sports |
| Danville State Hospital Grounds | Historical significance and scenic grounds make this a unique area to attract those interested in history and architecture. | Historical buildings, Walking paths, Local history tours |
| Riverside | A nearby borough with charming small-town vibes and access to local parks, making it appealing for those seeking a quiet getaway close to Danville. | Riverside Park, Community events, Local coffee shops |
| Local Wineries | The surrounding area is home to several wineries that attract visitors looking for vineyard tours and tastings, perfect for wine enthusiasts and couples. | Wine tastings, Vineyard tours, Special events at wineries |
Understanding Airbnb License Requirements & STR Laws in Danville (2026)
While Danville, Pennsylvania, United States currently shows low STR regulations, specific Airbnb license requirements might still exist or change. Always verify the latest short term rental regulations and Airbnb license requirements directly with local government authorities for Danville to ensure full compliance before hosting.
(Source: AirROI data, 2026, finding no licensed listings among those analyzed)
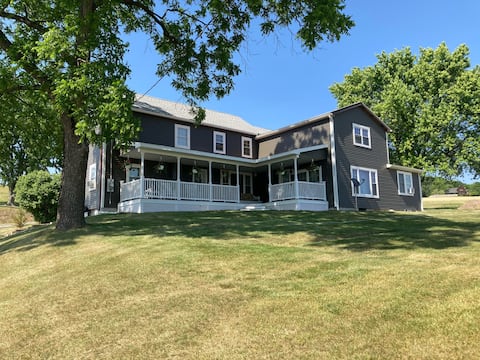
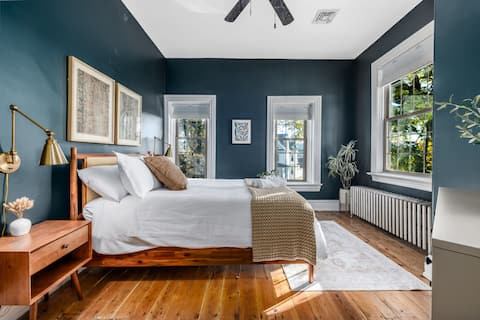
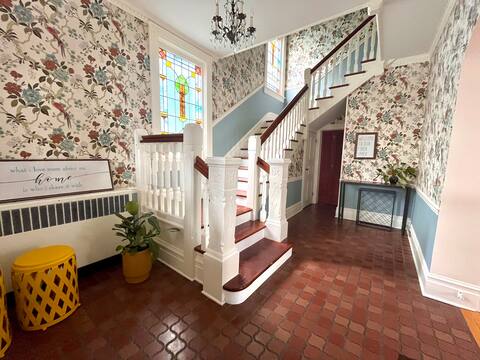
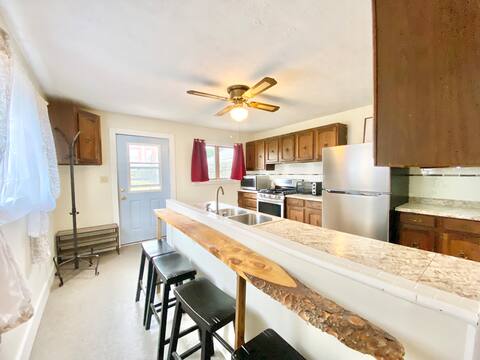
Top Performing Airbnb Properties in Danville (2026)
Benchmark your potential! Explore examples of top-performing Airbnb properties in Danvillebased on Trailing Twelve Month (TTM) revenue. Analyze their characteristics, revenue, occupancy rate, and ADR to understand what drives success in this market.
The Farmhouse/“Kids Paradise”
Entire Place • 7 bedrooms
Charming 1850s home near Knoebels & Geisinger
Entire Place • 4 bedrooms
Mi casita azul close to Knoebels and GMC
Entire Place • 3 bedrooms

My Uncle's Place 2
Entire Place • 1 bedroom

My Uncles Place
Entire Place • 1 bedroom
3 Bedroom Home 5Mins Walk Geisinger Hospital
Entire Place • 3 bedrooms
Note: Performance varies based on location, size, amenities, seasonality, and management quality. Data reflects the past 12 months.
Top Performing Airbnb Hosts in Danville (2026)
Learn from the best! This table showcases top-performing Airbnb hosts in Danville based on the number of properties managed and estimated total revenue over the past year. Analyze their scale and performance metrics.
| Host Name | Properties | Grossing Revenue | Stay Reviews | Avg Rating |
|---|---|---|---|---|
| LuAnn | 3 | $98,239 | 37 | 5.00/5.0 |
| Mindy | 1 | $63,347 | 55 | 4.96/5.0 |
| Rhea | 6 | $62,276 | 29 | 5.00/5.0 |
| Launa | 2 | $39,213 | 153 | 4.95/5.0 |
| Marilu Cristina | 1 | $34,959 | 81 | 4.85/5.0 |
| John | 11 | $27,123 | 120 | 4.73/5.0 |
| Emilee | 4 | $19,282 | 36 | 4.90/5.0 |
| Jenni | 1 | $19,246 | 23 | 4.91/5.0 |
| Kimberly | 1 | $189 | 1 | Not Rated |
Analyzing the strategies of top hosts, such as their property selection, pricing, and guest communication, can offer valuable lessons for optimizing your own Airbnb operations in Danville.
Dive Deeper: Advanced Danville STR Market Data (2026)
Ready to unlock more insights? AirROI provides access to advanced metrics and comprehensive Airbnb data for Danville. Explore detailed analytics beyond this report to refine your investment strategy, optimize pricing, and maximize your vacation rental profits.
Explore Advanced MetricsDanville Short-Term Rental Market Composition (2026): Property & Room Types
Room Type Distribution
Property Type Distribution
Market Composition Insights for Danville
- The Danville Airbnb market composition is heavily skewed towards Private Room listings, which make up 53.3% of the 30 active rentals. This indicates strong guest preference for privacy and space.
- Looking at the property type distribution in Danville, House properties are the most common (46.7%), reflecting the local real estate landscape.
- Houses represent a significant 46.7% portion, catering likely to families or larger groups.
- The presence of 26.7% Hotel/Boutique listings indicates integration with traditional hospitality.
Danville Airbnb Room Capacity Analysis (2026): Bedroom Distribution
Distribution of Listings by Number of Bedrooms
Room Capacity Insights for Danville
- The dominant room capacity in Danville is 1 bedroom listings, making up 43.3% of the market. This suggests a strong demand for properties suitable for couples or solo travelers.
- Together, 1 bedroom and 2 bedrooms properties represent 56.6% of the active Airbnb listings in Danville, indicating a high concentration in these sizes.
Danville Vacation Rental Guest Capacity Trends (2026)
Distribution of Listings by Guest Capacity
Guest Capacity Insights for Danville
- The most common guest capacity trend in Danville vacation rentals is listings accommodating 1 guest (26.7%). This suggests the primary traveler segment is likely couples or solo travelers.
- Properties designed for 1 guest and 2 guests dominate the Danville STR market, accounting for 43.4% of listings.
- A significant 43.4% of listings cater specifically to 1-2 guests, highlighting strong demand from couples and solo travelers in Danville.
- 13.3% of properties accommodate 6+ guests, serving the market segment for larger families or group travel in Danville.
- On average, properties in Danville are equipped to host 2.4 guests.
Danville Airbnb Booking Patterns (2026): Available vs. Booked Days
Available Days Distribution
Booked Days Distribution
Booking Pattern Insights for Danville
- The most common availability pattern in Danville falls within the 271-366 days range, representing 50% of listings. This suggests many properties have significant open periods on their calendars.
- Approximately 86.7% of listings show high availability (181+ days open annually), indicating potential for increased bookings or specific owner usage patterns.
- For booked days, the 91-180 days range is most frequent in Danville (36.7%), reflecting common guest stay durations or potential owner blocking patterns.
- A notable 13.3% of properties secure long booking periods (181+ days booked per year), highlighting successful long-term rental strategies or significant owner usage.
Danville Airbnb Minimum Stay Requirements Analysis
Distribution of Listings by Minimum Night Requirement
1 Night
3 listings
10% of total
2 Nights
7 listings
23.3% of total
4-6 Nights
1 listings
3.3% of total
7-29 Nights
10 listings
33.3% of total
30+ Nights
9 listings
30% of total
Key Insights
- The most prevalent minimum stay requirement in Danville is 7-29 Nights, adopted by 33.3% of listings. This highlights the market's preference for shorter, flexible bookings.
- A significant segment (30%) caters to monthly stays (30+ nights) in Danville, pointing to opportunities in the extended-stay market.
Recommendations
- Align with the market by considering a 7-29 Nights minimum stay, as 33.3% of Danville hosts use this setting.
- If feasible, allowing 1-night stays, especially midweek or during low season, could capture last-minute bookings, as only 10% currently do.
- Explore offering discounts for stays of 30+ nights to attract the 30% of the market seeking extended stays.
- Adjust minimum nights based on seasonality – potentially shorter during low season and longer during peak demand periods in Danville.
Danville Airbnb Cancellation Policy Trends Analysis (2026)
Flexible
14 listings
46.7% of total
Moderate
8 listings
26.7% of total
Firm
8 listings
26.7% of total
Cancellation Policy Insights for Danville
- The prevailing Airbnb cancellation policy trend in Danville is Flexible, used by 46.7% of listings.
- The market strongly favors guest-friendly terms, with 73.4% of listings offering Flexible or Moderate policies. This suggests guests in Danville may expect booking flexibility.
Recommendations for Hosts
- Consider adopting a Flexible policy to align with the 46.7% market standard in Danville.
- Regularly review your cancellation policy against competitors and market demand shifts in Danville.
Danville STR Booking Lead Time Analysis (2026)
Average Booking Lead Time by Month
Booking Lead Time Insights for Danville
- The overall average booking lead time for vacation rentals in Danville is 38 days.
- Guests book furthest in advance for stays during October (average 80 days), likely coinciding with peak travel demand or local events.
- The shortest booking windows occur for stays in February (average 12 days), indicating more last-minute travel plans during this time.
- Seasonally, Fall (73 days avg.) sees the longest lead times, while Winter (28 days avg.) has the shortest, reflecting typical travel planning cycles.
Recommendations for Hosts
- Use the overall average lead time (38 days) as a baseline for your pricing and availability strategy in Danville.
- For October stays, consider implementing length-of-stay discounts or slightly higher rates for bookings made less than 80 days out to capitalize on advance planning.
- During February, focus on last-minute booking availability and promotions, as guests book with very short notice (12 days avg.).
- Target marketing efforts for the Fall season well in advance (at least 73 days) to capture early planners.
- Monitor your own booking lead times against these Danville averages to identify opportunities for dynamic pricing adjustments.
Popular & Essential Airbnb Amenities in Danville (2026)
Amenity Prevalence
Amenity Insights for Danville
- Essential amenities in Danville that guests expect include: Washer, Wifi, Air conditioning, Smoke alarm, Kitchen, TV, Carbon monoxide alarm, Fire extinguisher, Heating. Lacking these (any) could significantly impact bookings.
- Popular amenities like Free parking on premises are common but not universal. Offering these can provide a competitive edge.
Recommendations for Hosts
- Ensure your listing includes all essential amenities for Danville: Washer, Wifi, Air conditioning, Smoke alarm, Kitchen, TV, Carbon monoxide alarm, Fire extinguisher, Heating.
- Prioritize adding missing essentials: TV, Carbon monoxide alarm, Fire extinguisher, Heating.
- Consider adding popular differentiators like Free parking on premises to increase appeal.
- Highlight unique or less common amenities you offer (e.g., hot tub, dedicated workspace, EV charger) in your listing description and photos.
- Regularly check competitor amenities in Danville to stay competitive.
Danville Airbnb Guest Demographics & Profile Analysis (2026)
Guest Profile Summary for Danville
- The typical guest profile for Airbnb in Danville consists of primarily domestic travelers (94%), often arriving from nearby Philadelphia, typically belonging to the Post-2000s (Gen Z/Alpha) group (50%), primarily speaking English or French.
- Domestic travelers account for 94.3% of guests.
- Key international markets include United States (94.3%) and Canada (2.3%).
- Top languages spoken are English (78.8%) followed by French (6.1%).
- A significant demographic segment is the Post-2000s (Gen Z/Alpha) group, representing 50% of guests.
Recommendations for Hosts
- Target domestic marketing efforts towards travelers from Philadelphia and Fallston.
- Tailor amenities and listing descriptions to appeal to the dominant Post-2000s (Gen Z/Alpha) demographic (e.g., highlight fast WiFi, smart home features, local guides).
- Highlight unique local experiences or amenities relevant to the primary guest profile.
- Consider seasonal promotions aligned with peak travel times for key origin markets.
Nearby Short-Term Rental Market Comparison
How does the Danville Airbnb market stack up against its neighbors? Compare key performance metrics like average monthly revenue, ADR, and occupancy rates in surrounding areas to understand the broader regional STR landscape.
| Market | Active Properties | Monthly Revenue | Daily Rate | Avg. Occupancy |
|---|---|---|---|---|
| Freeland | 11 | $8,436 | $684.29 | 42% |
| Berlin Township | 15 | $7,208 | $729.10 | 35% |
| Polk Township | 15 | $6,974 | $520.26 | 38% |
| Lemont | 21 | $6,940 | $873.93 | 37% |
| College Township | 83 | $6,551 | $848.63 | 36% |
| Centreville | 17 | $6,298 | $565.66 | 45% |
| State College | 192 | $6,081 | $712.29 | 40% |
| Shannondale | 45 | $5,808 | $337.30 | 54% |
| Stroud Township | 137 | $5,728 | $478.40 | 40% |
| Hilltown Township | 11 | $5,557 | $578.96 | 40% |