Confluence Airbnb Market Analysis 2026: Short Term Rental Data & Vacation Rental Statistics in Pennsylvania, United States
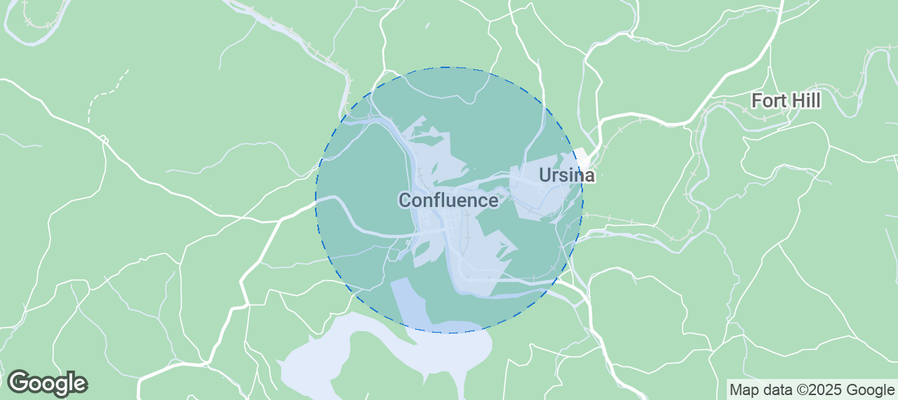
Is Airbnb profitable in Confluence in 2026? Explore comprehensive Airbnb analytics for Confluence, Pennsylvania, United States to uncover income potential. This 2026 STR market report for Confluence, based on AirROI data from February 2025 to January 2026, reveals key trends in the niche market of 24 active listings.
Whether you're considering an Airbnb investment in Confluence, optimizing your existing vacation rental, or exploring rental arbitrage opportunities, understanding the Confluence Airbnb data is crucial. Leveraging the low regulation environment is key to maximizing your short term rental income potential. Let's dive into the specifics.
Key Confluence Airbnb Performance Metrics Overview
Monthly Airbnb Revenue Variations & Income Potential in Confluence (2026)
Understanding the monthly revenue variations for Airbnb listings in Confluence is key to maximizing your short term rental income potential. Seasonality significantly impacts earnings. Our analysis, based on data from the past 12 months, shows that the peak revenue month for STRs in Confluence is typically July, while April often presents the lowest earnings, highlighting opportunities for strategic pricing adjustments during shoulder and low seasons. Explore the typical Airbnb income in Confluence across different performance tiers:
- Best-in-class properties (Top 10%) achieve $3,605+ monthly, often utilizing dynamic pricing and superior guest experiences.
- Strong performing properties (Top 25%) earn $2,482 or more, indicating effective management and desirable locations/amenities.
- Typical properties (Median) generate around $1,444 per month, representing the average market performance.
- Entry-level properties (Bottom 25%) see earnings around $754, often with potential for optimization.
Average Monthly Airbnb Earnings Trend in Confluence
Confluence Airbnb Occupancy Rate Trends (2026)
Maximize your bookings by understanding the Confluence STR occupancy trends. Seasonal demand shifts significantly influence how often properties are booked. Typically, Julysees the highest demand (peak season occupancy), while April experiences the lowest (low season). Effective strategies, like adjusting minimum stays or offering promotions, can boost occupancy during slower periods. Here's how different property tiers perform in Confluence:
- Best-in-class properties (Top 10%) achieve 51%+ occupancy, indicating high desirability and potentially optimized availability.
- Strong performing properties (Top 25%) maintain 37% or higher occupancy, suggesting good market fit and guest satisfaction.
- Typical properties (Median) have an occupancy rate around 25%.
- Entry-level properties (Bottom 25%) average 13% occupancy, potentially facing higher vacancy.
Average Monthly Occupancy Rate Trend in Confluence
Average Daily Rate (ADR) Airbnb Trends in Confluence (2026)
Effective short term rental pricing strategy in Confluence involves understanding monthly ADR fluctuations. The Average Daily Rate (ADR) for Airbnb in Confluence typically peaks in June and dips lowest during February. Leveraging Airbnb dynamic pricing tools or strategies based on this seasonality can significantly boost revenue. Here's a look at the typical nightly rates achieved:
- Best-in-class properties (Top 10%) command rates of $491+ per night, often due to premium features or locations.
- Strong performing properties (Top 25%) achieve nightly rates of $270 or more.
- Typical properties (Median) charge around $170 per night.
- Entry-level properties (Bottom 25%) earn around $141 per night.
Average Daily Rate (ADR) Trend by Month in Confluence
Get Live Confluence Market Intelligence 👇
Explore Real-time Analytics
Airbnb Seasonality Analysis & Trends in Confluence (2026)
Peak Season (July, August, October)
- Revenue averages $2,984 per month
- Occupancy rates average 41.1%
- Daily rates average $243
Shoulder Season
- Revenue averages $1,893 per month
- Occupancy maintains around 24.8%
- Daily rates hold near $240
Low Season (January, February, April)
- Revenue drops to average $1,122 per month
- Occupancy decreases to average 20.2%
- Daily rates adjust to average $231
Seasonality Insights for Confluence
- The Airbnb seasonality in Confluence shows highly seasonal trends requiring careful strategy. While the sections above show seasonal averages, it's also insightful to look at the extremes:
- During the high season, the absolute peak month showcases Confluence's highest earning potential, with monthly revenues capable of climbing to $3,157, occupancy reaching a high of 42.6%, and ADRs peaking at $250.
- Conversely, the slowest single month of the year, typically falling within the low season, marks the market's lowest point. In this month, revenue might dip to $1,002, occupancy could drop to 15.7%, and ADRs may adjust down to $227.
- Understanding both the seasonal averages and these monthly peaks and troughs in revenue, occupancy, and ADR is crucial for maximizing your Airbnb profit potential in Confluence.
Seasonal Strategies for Maximizing Profit
- Peak Season: Maximize revenue through premium pricing and potentially longer minimum stays. Ensure high availability.
- Low Season: Offer competitive pricing, special promotions (e.g., extended stay discounts), and flexible cancellation policies. Target off-season travelers like remote workers or budget-conscious guests.
- Shoulder Seasons: Implement dynamic pricing that balances peak and low rates. Target weekend travelers or specific events. Offer slightly more flexible terms than peak season.
- Regularly analyze your own performance against these Confluence seasonality benchmarks and adjust your pricing and availability strategy accordingly.
Best Areas for Airbnb Investment in Confluence (2026)
Exploring the top neighborhoods for short-term rentals in Confluence? This section highlights key areas, outlining why they are attractive for hosts and guests, along with notable local attractions. Consider these locations based on your target guest profile and investment strategy.
| Neighborhood / Area | Why Host Here? (Target Guests & Appeal) | Key Attractions & Landmarks |
|---|---|---|
| Downtown Confluence | The heart of Confluence, known for its charming small-town vibe and proximity to outdoor activities. Ideal for travelers looking to explore the local culture and enjoy events like the annual Confluence Festival. | Confluence River Access, Ligonier Valley Rail Road Museum, Laurel Hill State Park, Youghiogheny River, Kayaking and fishing opportunities |
| Ohiopyle State Park | A major outdoor recreational area known for its stunning natural beauty and adventure activities. Perfect for guests seeking outdoor experiences like whitewater rafting, hiking, and camping. | Ohiopyle Falls, Great Allegheny Passage, Cucumber Falls, Natural Waterslides, Biking and hiking trails |
| Sandy Creek | A peaceful neighborhood close to nature, ideal for those wanting a quiet retreat. Attracts visitors looking to relax amidst beautiful scenery and enjoy nature walks or birdwatching. | Coopers Rock State Forest, Sandy Creek Trail, Picnic areas, Scenic views, Wildlife observation |
| Twin Lakes Park | A popular local park offering recreational facilities and beautiful lake views, appealing to families and groups looking for a fun day outdoors. | Twin Lakes, Hiking trails, Fishing spots, Playgrounds, Picnic areas |
| Somerset | Nearby town offering additional amenities and dining options. Useful for guests who want proximity to both small-town charm and larger town facilities. | Somerset Historical Center, Somerset County Courthouse, Shopping centers, Restaurants, Local events |
| New Centerville | A quaint community with access to local culture and attractions. Great for visitors looking to experience a quiet countryside atmosphere. | New Centerville and Pennsylvania Railroad, Countryside views, Local farms, Small-town shopping, Community events |
| Uniontown | A larger city nearby with a variety of restaurants, shops, and entertainment options. Attractive for travelers who want to enjoy city amenities while being close to rural areas. | Uniontown Mall, Fayette County Historical Society, Local art scene, Restaurants and cafes, Annual fairs |
| Ligonier | Charming historic town with a vibrant downtown area. Known for its seasonal festivals and beautiful surroundings, appealing to those who enjoy history and local culture. | Fort Ligonier, Ligonier Valley Rail Road Museum, Shopping and dining in downtown, Seasonal festivals, Scenic vistas |
Understanding Airbnb License Requirements & STR Laws in Confluence (2026)
While Confluence, Pennsylvania, United States currently shows low STR regulations, specific Airbnb license requirements might still exist or change. Always verify the latest short term rental regulations and Airbnb license requirements directly with local government authorities for Confluence to ensure full compliance before hosting.
(Source: AirROI data, 2026, finding no licensed listings among those analyzed)
Top Performing Airbnb Properties in Confluence (2026)
Benchmark your potential! Explore examples of top-performing Airbnb properties in Confluencebased on Trailing Twelve Month (TTM) revenue. Analyze their characteristics, revenue, occupancy rate, and ADR to understand what drives success in this market.

Turkeyfoot Inn
Entire Place • 8 bedrooms

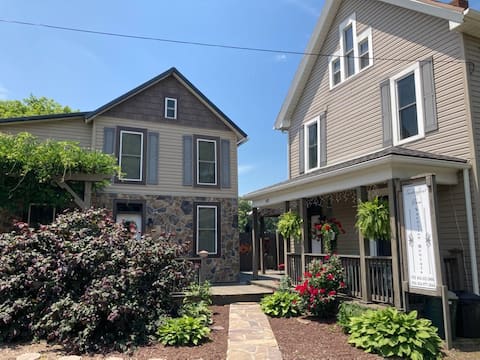
Stonehouse w/ Hot Tub, Walk to GAP Trail & Town
Entire Place • 4 bedrooms
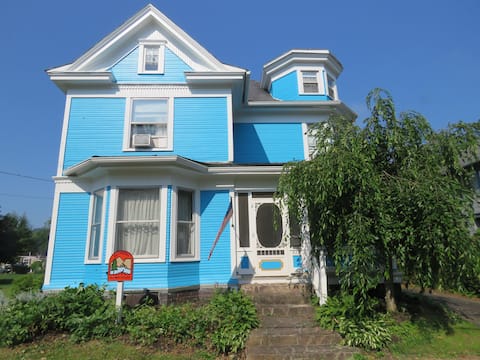
Grand Victorian - easy walk to trail, food & shops
Entire Place • 4 bedrooms
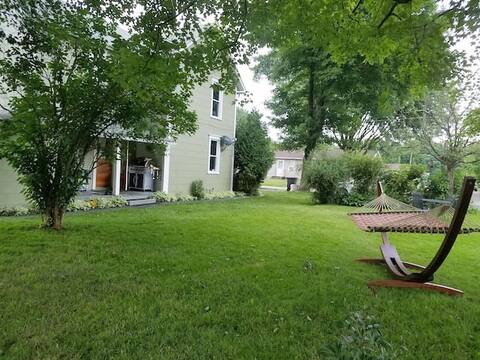
Laurel Creek House at the Turkeyfoot Inn.
Entire Place • 4 bedrooms
Birdhouse Inn Confluence
Entire Place • 3 bedrooms

Jones'Inn Confluence
Entire Place • 3 bedrooms
Note: Performance varies based on location, size, amenities, seasonality, and management quality. Data reflects the past 12 months.
Top Performing Airbnb Hosts in Confluence (2026)
Learn from the best! This table showcases top-performing Airbnb hosts in Confluence based on the number of properties managed and estimated total revenue over the past year. Analyze their scale and performance metrics.
| Host Name | Properties | Grossing Revenue | Stay Reviews | Avg Rating |
|---|---|---|---|---|
| Diana | 6 | $172,856 | 734 | 4.89/5.0 |
| Kara | 2 | $56,808 | 122 | 4.93/5.0 |
| Michael | 2 | $47,967 | 152 | 4.97/5.0 |
| Theresa | 5 | $40,924 | 148 | 4.78/5.0 |
| Ruth | 1 | $32,535 | 44 | 4.93/5.0 |
| Jennifer | 4 | $25,049 | 150 | 4.98/5.0 |
| Brandy | 1 | $21,081 | 275 | 4.84/5.0 |
| Leo | 1 | $19,722 | 233 | 4.91/5.0 |
| Miriam | 1 | $16,376 | 121 | 4.79/5.0 |
| Douglas | 1 | $15,651 | 83 | 4.93/5.0 |
Analyzing the strategies of top hosts, such as their property selection, pricing, and guest communication, can offer valuable lessons for optimizing your own Airbnb operations in Confluence.
Dive Deeper: Advanced Confluence STR Market Data (2026)
Ready to unlock more insights? AirROI provides access to advanced metrics and comprehensive Airbnb data for Confluence. Explore detailed analytics beyond this report to refine your investment strategy, optimize pricing, and maximize your vacation rental profits.
Explore Advanced MetricsConfluence Short-Term Rental Market Composition (2026): Property & Room Types
Room Type Distribution
Property Type Distribution
Market Composition Insights for Confluence
- The Confluence Airbnb market composition is heavily skewed towards Entire Home/Apt listings, which make up 83.3% of the 24 active rentals. This indicates strong guest preference for privacy and space.
- Looking at the property type distribution in Confluence, House properties are the most common (58.3%), reflecting the local real estate landscape.
- Houses represent a significant 58.3% portion, catering likely to families or larger groups.
- Smaller segments like outdoor/unique (combined 4.2%) offer potential for unique stay experiences.
Confluence Airbnb Room Capacity Analysis (2026): Bedroom Distribution
Distribution of Listings by Number of Bedrooms
Room Capacity Insights for Confluence
- The dominant room capacity in Confluence is 2 bedrooms listings, making up 20.8% of the market. This suggests a strong demand for properties suitable for couples or solo travelers.
- Together, 2 bedrooms and 4 bedrooms properties represent 41.6% of the active Airbnb listings in Confluence, indicating a high concentration in these sizes.
- A significant 45.8% of listings offer 3+ bedrooms, catering to larger groups and families seeking more space in Confluence.
Confluence Vacation Rental Guest Capacity Trends (2026)
Distribution of Listings by Guest Capacity
Guest Capacity Insights for Confluence
- The most common guest capacity trend in Confluence vacation rentals is listings accommodating 8+ guests (37.5%). This suggests the primary traveler segment is likely larger groups.
- Properties designed for 8+ guests and 4 guests dominate the Confluence STR market, accounting for 54.2% of listings.
- 50.0% of properties accommodate 6+ guests, serving the market segment for larger families or group travel in Confluence.
- On average, properties in Confluence are equipped to host 5.0 guests.
Confluence Airbnb Booking Patterns (2026): Available vs. Booked Days
Available Days Distribution
Booked Days Distribution
Booking Pattern Insights for Confluence
- The most common availability pattern in Confluence falls within the 271-366 days range, representing 66.7% of listings. This suggests many properties have significant open periods on their calendars.
- Approximately 95.9% of listings show high availability (181+ days open annually), indicating potential for increased bookings or specific owner usage patterns.
- For booked days, the 91-180 days range is most frequent in Confluence (41.7%), reflecting common guest stay durations or potential owner blocking patterns.
- A notable 4.2% of properties secure long booking periods (181+ days booked per year), highlighting successful long-term rental strategies or significant owner usage.
Confluence Airbnb Minimum Stay Requirements Analysis
Distribution of Listings by Minimum Night Requirement
1 Night
13 listings
54.2% of total
2 Nights
7 listings
29.2% of total
30+ Nights
4 listings
16.7% of total
Key Insights
- The most prevalent minimum stay requirement in Confluence is 1 Night, adopted by 54.2% of listings. This highlights the market's preference for shorter, flexible bookings.
- A strong majority (83.4%) of the Confluence Airbnb data shows acceptance of very short stays (1-2 nights), indicating a dynamic, high-turnover market.
- A significant segment (16.7%) caters to monthly stays (30+ nights) in Confluence, pointing to opportunities in the extended-stay market.
Recommendations
- Align with the market by considering a 1 Night minimum stay, as 54.2% of Confluence hosts use this setting.
- Explore offering discounts for stays of 30+ nights to attract the 16.7% of the market seeking extended stays.
- Adjust minimum nights based on seasonality – potentially shorter during low season and longer during peak demand periods in Confluence.
Confluence Airbnb Cancellation Policy Trends Analysis (2026)
Moderate
5 listings
20.8% of total
Firm
19 listings
79.2% of total
Cancellation Policy Insights for Confluence
- The prevailing Airbnb cancellation policy trend in Confluence is Firm, used by 79.2% of listings.
- A majority (79.2%) of hosts in Confluence utilize Firm or Strict policies, indicating a market where hosts prioritize booking security.
Recommendations for Hosts
- Consider adopting a Firm policy to align with the 79.2% market standard in Confluence.
- Regularly review your cancellation policy against competitors and market demand shifts in Confluence.
Confluence STR Booking Lead Time Analysis (2026)
Average Booking Lead Time by Month
Booking Lead Time Insights for Confluence
- The overall average booking lead time for vacation rentals in Confluence is 56 days.
- Guests book furthest in advance for stays during June (average 72 days), likely coinciding with peak travel demand or local events.
- The shortest booking windows occur for stays in January (average 25 days), indicating more last-minute travel plans during this time.
- Seasonally, Summer (69 days avg.) sees the longest lead times, while Winter (38 days avg.) has the shortest, reflecting typical travel planning cycles.
Recommendations for Hosts
- Use the overall average lead time (56 days) as a baseline for your pricing and availability strategy in Confluence.
- For June stays, consider implementing length-of-stay discounts or slightly higher rates for bookings made less than 72 days out to capitalize on advance planning.
- Target marketing efforts for the Summer season well in advance (at least 69 days) to capture early planners.
- Monitor your own booking lead times against these Confluence averages to identify opportunities for dynamic pricing adjustments.
Popular & Essential Airbnb Amenities in Confluence (2026)
Amenity Prevalence
Amenity Insights for Confluence
- Essential amenities in Confluence that guests expect include: TV, Refrigerator, Air conditioning, Essentials, Smoke alarm, Shampoo, Heating, Free parking on premises, Hot water, Fire extinguisher. Lacking these (any) could significantly impact bookings.
Recommendations for Hosts
- Ensure your listing includes all essential amenities for Confluence: TV, Refrigerator, Air conditioning, Essentials, Smoke alarm, Shampoo, Heating, Free parking on premises, Hot water, Fire extinguisher.
- Prioritize adding missing essentials: Essentials, Smoke alarm, Shampoo, Heating, Free parking on premises, Hot water, Fire extinguisher.
- Highlight unique or less common amenities you offer (e.g., hot tub, dedicated workspace, EV charger) in your listing description and photos.
- Regularly check competitor amenities in Confluence to stay competitive.
Confluence Airbnb Guest Demographics & Profile Analysis (2026)
Guest Profile Summary for Confluence
- The typical guest profile for Airbnb in Confluence consists of primarily domestic travelers (97%), often arriving from nearby Pittsburgh, typically belonging to the Post-2000s (Gen Z/Alpha) group (50%), primarily speaking English or Spanish.
- Domestic travelers account for 97.0% of guests.
- Key international markets include United States (97%) and DC (2.4%).
- Top languages spoken are English (75.7%) followed by Spanish (8.6%).
- A significant demographic segment is the Post-2000s (Gen Z/Alpha) group, representing 50% of guests.
Recommendations for Hosts
- Target domestic marketing efforts towards travelers from Pittsburgh and Arlington.
- Tailor amenities and listing descriptions to appeal to the dominant Post-2000s (Gen Z/Alpha) demographic (e.g., highlight fast WiFi, smart home features, local guides).
- Highlight unique local experiences or amenities relevant to the primary guest profile.
- Consider seasonal promotions aligned with peak travel times for key origin markets.
Nearby Short-Term Rental Market Comparison
How does the Confluence Airbnb market stack up against its neighbors? Compare key performance metrics like average monthly revenue, ADR, and occupancy rates in surrounding areas to understand the broader regional STR landscape.
| Market | Active Properties | Monthly Revenue | Daily Rate | Avg. Occupancy |
|---|---|---|---|---|
| McGaheysville | 83 | $6,156 | $431.72 | 45% |
| Bentonville | 23 | $5,372 | $420.82 | 51% |
| Bumpass | 120 | $4,851 | $553.01 | 33% |
| Shenandoah | 104 | $4,778 | $354.44 | 47% |
| Skyland Estates | 14 | $4,649 | $280.30 | 55% |
| Castleton | 11 | $4,646 | $528.43 | 30% |
| Stanley | 103 | $4,550 | $324.33 | 48% |
| Wardensville | 33 | $4,485 | $267.00 | 54% |
| Rileyville | 66 | $4,225 | $294.93 | 48% |
| Shenandoah Shores | 15 | $4,219 | $421.31 | 38% |