Clifton Township Airbnb Market Analysis 2026: Short Term Rental Data & Vacation Rental Statistics in Pennsylvania, United States
Is Airbnb profitable in Clifton Township in 2026? Explore comprehensive Airbnb analytics for Clifton Township, Pennsylvania, United States to uncover income potential. This 2026 STR market report for Clifton Township, based on AirROI data from February 2025 to January 2026, reveals key trends in the niche market of 133 active listings.
Whether you're considering an Airbnb investment in Clifton Township, optimizing your existing vacation rental, or exploring rental arbitrage opportunities, understanding the Clifton Township Airbnb data is crucial. Leveraging the low regulation environment is key to maximizing your short term rental income potential. Let's dive into the specifics.
Key Clifton Township Airbnb Performance Metrics Overview
Monthly Airbnb Revenue Variations & Income Potential in Clifton Township (2026)
Understanding the monthly revenue variations for Airbnb listings in Clifton Township is key to maximizing your short term rental income potential. Seasonality significantly impacts earnings. Our analysis, based on data from the past 12 months, shows that the peak revenue month for STRs in Clifton Township is typically July, while April often presents the lowest earnings, highlighting opportunities for strategic pricing adjustments during shoulder and low seasons. Explore the typical Airbnb income in Clifton Township across different performance tiers:
- Best-in-class properties (Top 10%) achieve $8,945+ monthly, often utilizing dynamic pricing and superior guest experiences.
- Strong performing properties (Top 25%) earn $6,014 or more, indicating effective management and desirable locations/amenities.
- Typical properties (Median) generate around $3,648 per month, representing the average market performance.
- Entry-level properties (Bottom 25%) see earnings around $2,012, often with potential for optimization.
Average Monthly Airbnb Earnings Trend in Clifton Township
Clifton Township Airbnb Occupancy Rate Trends (2026)
Maximize your bookings by understanding the Clifton Township STR occupancy trends. Seasonal demand shifts significantly influence how often properties are booked. Typically, Augustsees the highest demand (peak season occupancy), while January experiences the lowest (low season). Effective strategies, like adjusting minimum stays or offering promotions, can boost occupancy during slower periods. Here's how different property tiers perform in Clifton Township:
- Best-in-class properties (Top 10%) achieve 75%+ occupancy, indicating high desirability and potentially optimized availability.
- Strong performing properties (Top 25%) maintain 60% or higher occupancy, suggesting good market fit and guest satisfaction.
- Typical properties (Median) have an occupancy rate around 38%.
- Entry-level properties (Bottom 25%) average 21% occupancy, potentially facing higher vacancy.
Average Monthly Occupancy Rate Trend in Clifton Township
Average Daily Rate (ADR) Airbnb Trends in Clifton Township (2026)
Effective short term rental pricing strategy in Clifton Township involves understanding monthly ADR fluctuations. The Average Daily Rate (ADR) for Airbnb in Clifton Township typically peaks in December and dips lowest during March. Leveraging Airbnb dynamic pricing tools or strategies based on this seasonality can significantly boost revenue. Here's a look at the typical nightly rates achieved:
- Best-in-class properties (Top 10%) command rates of $539+ per night, often due to premium features or locations.
- Strong performing properties (Top 25%) achieve nightly rates of $399 or more.
- Typical properties (Median) charge around $295 per night.
- Entry-level properties (Bottom 25%) earn around $232 per night.
Average Daily Rate (ADR) Trend by Month in Clifton Township
Get Live Clifton Township Market Intelligence 👇

Explore Real-time Analytics
Airbnb Seasonality Analysis & Trends in Clifton Township (2026)
Peak Season (July, August, December)
- Revenue averages $6,566 per month
- Occupancy rates average 52.6%
- Daily rates average $376
Shoulder Season
- Revenue averages $3,985 per month
- Occupancy maintains around 37.8%
- Daily rates hold near $349
Low Season (March, April, May)
- Revenue drops to average $3,174 per month
- Occupancy decreases to average 36.3%
- Daily rates adjust to average $293
Seasonality Insights for Clifton Township
- The Airbnb seasonality in Clifton Township shows highly seasonal trends requiring careful strategy. While the sections above show seasonal averages, it's also insightful to look at the extremes:
- During the high season, the absolute peak month showcases Clifton Township's highest earning potential, with monthly revenues capable of climbing to $7,468, occupancy reaching a high of 62.2%, and ADRs peaking at $411.
- Conversely, the slowest single month of the year, typically falling within the low season, marks the market's lowest point. In this month, revenue might dip to $2,969, occupancy could drop to 31.3%, and ADRs may adjust down to $281.
- Understanding both the seasonal averages and these monthly peaks and troughs in revenue, occupancy, and ADR is crucial for maximizing your Airbnb profit potential in Clifton Township.
Seasonal Strategies for Maximizing Profit
- Peak Season: Maximize revenue through premium pricing and potentially longer minimum stays. Ensure high availability.
- Low Season: Offer competitive pricing, special promotions (e.g., extended stay discounts), and flexible cancellation policies. Target off-season travelers like remote workers or budget-conscious guests.
- Shoulder Seasons: Implement dynamic pricing that balances peak and low rates. Target weekend travelers or specific events. Offer slightly more flexible terms than peak season.
- Regularly analyze your own performance against these Clifton Township seasonality benchmarks and adjust your pricing and availability strategy accordingly.
Best Areas for Airbnb Investment in Clifton Township (2026)
Exploring the top neighborhoods for short-term rentals in Clifton Township? This section highlights key areas, outlining why they are attractive for hosts and guests, along with notable local attractions. Consider these locations based on your target guest profile and investment strategy.
| Neighborhood / Area | Why Host Here? (Target Guests & Appeal) | Key Attractions & Landmarks |
|---|---|---|
| Clifton Park | A serene residential area with close proximity to parks and recreational facilities. Popular among families and nature lovers, making it a peaceful retreat for guests. | Clifton Park, Clifton Township Community Park, Lake Frances, Monroe County Parks, Lakeside Trails |
| Cranberry Township | Known for its modern amenities, shopping centers, and family-friendly environment. An ideal location for visitors looking for comfort and convenience with easy access to nearby Pittsburgh. | Cranberry Township Community Park, Cranberry Mall, Mason Park, North Boundary Park, Fun Fore All |
| Baden | A small, charming borough that offers a quaint local atmosphere. Visitors appreciate the quiet neighborhood vibe and proximity to outdoor activities. | Baden Park, Baden Area Memorial Library, Raccoon Creek State Park, Local shops and eateries, Historic local architecture |
| Mars | A quaint and cozy township with a strong local community feel. Attracts guests seeking a small-town experience with plenty of nearby activities. | Mars Park, Local festivals, Nearby hiking trails, Dining in local cafes, Peaceful residential vibe |
| Shaler Township | A suburban area with great views and parks, just a short drive from Pittsburgh. Ideal for guests who enjoy city proximity without being in the center of the hustle and bustle. | Shaler North Hills Library, Shaler Area Community Park, Local art galleries, Kayak Pittsburgh, Nearby golf courses |
| Sewickley | Known for its beautiful historic homes and quaint village atmosphere. Popular for those looking for a charming and upscale neighborhood to explore. | Sewickley Village, Sewickley Public Library, Walking trails along the Ohio River, Local boutiques, Cafes and fine dining |
| Hopewell Township | Offers a mix of suburban and rural feel, appealing to visitors who appreciate natural beauty and outdoor activities. Great for families and outdoor enthusiasts. | Hopewell Community Park, Local wineries, Parks with hiking trails, Family-friendly outdoor activities, Nearby historical sites |
| West View | A small borough with an inviting community spirit. Guests enjoy the affordability and accessibility to Pittsburgh while experiencing local charm. | West View Park, Restaurants and local shops, Family-friendly community events, Access to public transportation, Nearby theaters and recreation |
Understanding Airbnb License Requirements & STR Laws in Clifton Township (2026)
While Clifton Township, Pennsylvania, United States currently shows low STR regulations, specific Airbnb license requirements might still exist or change. Always verify the latest short term rental regulations and Airbnb license requirements directly with local government authorities for Clifton Township to ensure full compliance before hosting.
(Source: AirROI data, 2026, finding no licensed listings among those analyzed)
Top Performing Airbnb Properties in Clifton Township (2026)
Benchmark your potential! Explore examples of top-performing Airbnb properties in Clifton Townshipbased on Trailing Twelve Month (TTM) revenue. Analyze their characteristics, revenue, occupancy rate, and ADR to understand what drives success in this market.

Snowy Cozy Retreat w/Hot Tub & Sauna near Skiing
Entire Place • 5 bedrooms

Lakefront * Hot Tub * Canoes * Game Room * Wood FP
Entire Place • 4 bedrooms
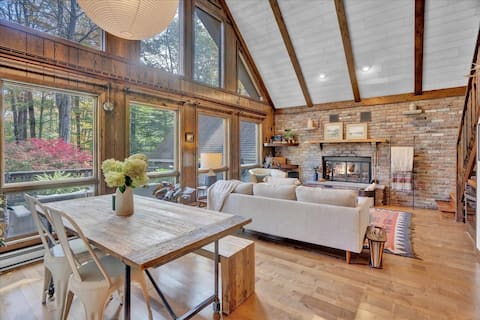
Mountain Chalet in Pocono Resort
Entire Place • 5 bedrooms
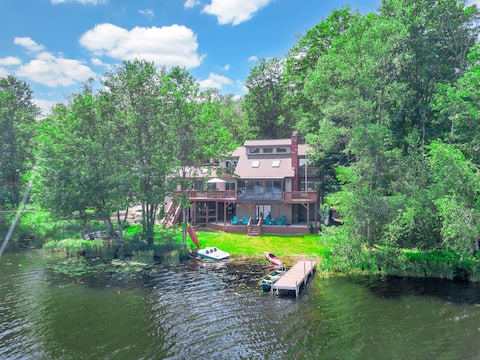
Lakefront | Big Bass Lake | Dock | Games
Entire Place • 4 bedrooms

Lake Front, Hot Tub, Fire Pit, FP, Boats, Ski
Entire Place • 5 bedrooms
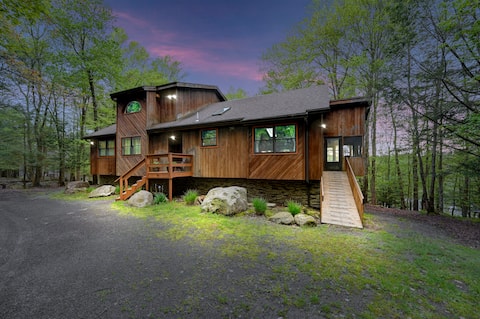
Cozy house in Poconos with hot tub, king bed
Entire Place • 6 bedrooms
Note: Performance varies based on location, size, amenities, seasonality, and management quality. Data reflects the past 12 months.
Top Performing Airbnb Hosts in Clifton Township (2026)
Learn from the best! This table showcases top-performing Airbnb hosts in Clifton Township based on the number of properties managed and estimated total revenue over the past year. Analyze their scale and performance metrics.
| Host Name | Properties | Grossing Revenue | Stay Reviews | Avg Rating |
|---|---|---|---|---|
| Jesse | 16 | $824,909 | 1059 | 4.78/5.0 |
| Evolve | 12 | $410,793 | 369 | 4.69/5.0 |
| CJ @ Select Rentals | 3 | $344,460 | 133 | 4.93/5.0 |
| Jd | 6 | $284,169 | 335 | 4.67/5.0 |
| Viktoriya | 1 | $190,325 | 222 | 4.89/5.0 |
| Volha | 4 | $157,743 | 351 | 4.92/5.0 |
| Christopher And Heidi | 2 | $144,189 | 105 | 4.99/5.0 |
| Camille | 1 | $115,902 | 82 | 4.88/5.0 |
| Michael | 2 | $109,242 | 194 | 4.97/5.0 |
| Leanne | 1 | $106,648 | 143 | 4.80/5.0 |
Analyzing the strategies of top hosts, such as their property selection, pricing, and guest communication, can offer valuable lessons for optimizing your own Airbnb operations in Clifton Township.
Dive Deeper: Advanced Clifton Township STR Market Data (2026)
Ready to unlock more insights? AirROI provides access to advanced metrics and comprehensive Airbnb data for Clifton Township. Explore detailed analytics beyond this report to refine your investment strategy, optimize pricing, and maximize your vacation rental profits.
Explore Advanced MetricsClifton Township Short-Term Rental Market Composition (2026): Property & Room Types
Room Type Distribution
Property Type Distribution
Market Composition Insights for Clifton Township
- The Clifton Township Airbnb market composition is heavily skewed towards Entire Home/Apt listings, which make up 100% of the 133 active rentals. This indicates strong guest preference for privacy and space.
- Looking at the property type distribution in Clifton Township, House properties are the most common (75.9%), reflecting the local real estate landscape.
- Houses represent a significant 75.9% portion, catering likely to families or larger groups.
Clifton Township Airbnb Room Capacity Analysis (2026): Bedroom Distribution
Distribution of Listings by Number of Bedrooms
Room Capacity Insights for Clifton Township
- The dominant room capacity in Clifton Township is 3 bedrooms listings, making up 44.4% of the market. This suggests a strong demand for properties suitable for families or small groups.
- Together, 3 bedrooms and 4 bedrooms properties represent 76.7% of the active Airbnb listings in Clifton Township, indicating a high concentration in these sizes.
- A significant 96.2% of listings offer 3+ bedrooms, catering to larger groups and families seeking more space in Clifton Township.
Clifton Township Vacation Rental Guest Capacity Trends (2026)
Distribution of Listings by Guest Capacity
Guest Capacity Insights for Clifton Township
- The most common guest capacity trend in Clifton Township vacation rentals is listings accommodating 8+ guests (79.7%). This suggests the primary traveler segment is likely larger groups.
- Properties designed for 8+ guests and 6 guests dominate the Clifton Township STR market, accounting for 94.0% of listings.
- 99.3% of properties accommodate 6+ guests, serving the market segment for larger families or group travel in Clifton Township.
- On average, properties in Clifton Township are equipped to host 7.6 guests.
Clifton Township Airbnb Booking Patterns (2026): Available vs. Booked Days
Available Days Distribution
Booked Days Distribution
Booking Pattern Insights for Clifton Township
- The most common availability pattern in Clifton Township falls within the 181-270 days range, representing 36.1% of listings. This suggests many properties have significant open periods on their calendars.
- Approximately 71.4% of listings show high availability (181+ days open annually), indicating potential for increased bookings or specific owner usage patterns.
- For booked days, the 91-180 days range is most frequent in Clifton Township (39.1%), reflecting common guest stay durations or potential owner blocking patterns.
- A notable 30.1% of properties secure long booking periods (181+ days booked per year), highlighting successful long-term rental strategies or significant owner usage.
Clifton Township Airbnb Minimum Stay Requirements Analysis
Distribution of Listings by Minimum Night Requirement
1 Night
11 listings
8.3% of total
2 Nights
68 listings
51.1% of total
3 Nights
6 listings
4.5% of total
4-6 Nights
1 listings
0.8% of total
30+ Nights
47 listings
35.3% of total
Key Insights
- The most prevalent minimum stay requirement in Clifton Township is 2 Nights, adopted by 51.1% of listings. This highlights the market's preference for shorter, flexible bookings.
- A significant segment (35.3%) caters to monthly stays (30+ nights) in Clifton Township, pointing to opportunities in the extended-stay market.
Recommendations
- Align with the market by considering a 2 Nights minimum stay, as 51.1% of Clifton Township hosts use this setting.
- If feasible, allowing 1-night stays, especially midweek or during low season, could capture last-minute bookings, as only 8.3% currently do.
- A 2-night minimum appears standard (51.1%). Consider this for weekends or peak periods.
- Explore offering discounts for stays of 30+ nights to attract the 35.3% of the market seeking extended stays.
- Adjust minimum nights based on seasonality – potentially shorter during low season and longer during peak demand periods in Clifton Township.
Clifton Township Airbnb Cancellation Policy Trends Analysis (2026)
Limited
2 listings
1.5% of total
Super Strict 60 Days
2 listings
1.5% of total
Super Strict 30 Days
1 listings
0.8% of total
Flexible
9 listings
6.8% of total
Moderate
27 listings
20.5% of total
Firm
60 listings
45.5% of total
Strict
31 listings
23.5% of total
Cancellation Policy Insights for Clifton Township
- The prevailing Airbnb cancellation policy trend in Clifton Township is Firm, used by 45.5% of listings.
- A majority (69.0%) of hosts in Clifton Township utilize Firm or Strict policies, indicating a market where hosts prioritize booking security.
Recommendations for Hosts
- Consider adopting a Firm policy to align with the 45.5% market standard in Clifton Township.
- Regularly review your cancellation policy against competitors and market demand shifts in Clifton Township.
Clifton Township STR Booking Lead Time Analysis (2026)
Average Booking Lead Time by Month
Booking Lead Time Insights for Clifton Township
- The overall average booking lead time for vacation rentals in Clifton Township is 38 days.
- Guests book furthest in advance for stays during July (average 68 days), likely coinciding with peak travel demand or local events.
- The shortest booking windows occur for stays in March (average 19 days), indicating more last-minute travel plans during this time.
- Seasonally, Summer (61 days avg.) sees the longest lead times, while Spring (27 days avg.) has the shortest, reflecting typical travel planning cycles.
Recommendations for Hosts
- Use the overall average lead time (38 days) as a baseline for your pricing and availability strategy in Clifton Township.
- For July stays, consider implementing length-of-stay discounts or slightly higher rates for bookings made less than 68 days out to capitalize on advance planning.
- Target marketing efforts for the Summer season well in advance (at least 61 days) to capture early planners.
- Monitor your own booking lead times against these Clifton Township averages to identify opportunities for dynamic pricing adjustments.
Popular & Essential Airbnb Amenities in Clifton Township (2026)
Amenity Prevalence
Amenity Insights for Clifton Township
- Essential amenities in Clifton Township that guests expect include: Free parking on premises, Kitchen, Wifi, TV, Heating, Smoke alarm, Hot water, Dishes and silverware, Dryer, Washer. Lacking these (any) could significantly impact bookings.
Recommendations for Hosts
- Ensure your listing includes all essential amenities for Clifton Township: Free parking on premises, Kitchen, Wifi, TV, Heating, Smoke alarm, Hot water, Dishes and silverware, Dryer, Washer.
- Prioritize adding missing essentials: TV, Heating, Smoke alarm, Hot water, Dishes and silverware, Dryer, Washer.
- Highlight unique or less common amenities you offer (e.g., hot tub, dedicated workspace, EV charger) in your listing description and photos.
- Regularly check competitor amenities in Clifton Township to stay competitive.
Clifton Township Airbnb Guest Demographics & Profile Analysis (2026)
Guest Profile Summary for Clifton Township
- The typical guest profile for Airbnb in Clifton Township consists of primarily domestic travelers (96%), often arriving from nearby New York, typically belonging to the Post-2000s (Gen Z/Alpha) group (50%), primarily speaking English or Spanish.
- Domestic travelers account for 96.3% of guests.
- Key international markets include United States (96.3%) and Canada (0.6%).
- Top languages spoken are English (65.7%) followed by Spanish (16.3%).
- A significant demographic segment is the Post-2000s (Gen Z/Alpha) group, representing 50% of guests.
Recommendations for Hosts
- Target domestic marketing efforts towards travelers from New York and Philadelphia.
- Tailor amenities and listing descriptions to appeal to the dominant Post-2000s (Gen Z/Alpha) demographic (e.g., highlight fast WiFi, smart home features, local guides).
- Highlight unique local experiences or amenities relevant to the primary guest profile.
- Consider seasonal promotions aligned with peak travel times for key origin markets.
Nearby Short-Term Rental Market Comparison
How does the Clifton Township Airbnb market stack up against its neighbors? Compare key performance metrics like average monthly revenue, ADR, and occupancy rates in surrounding areas to understand the broader regional STR landscape.
| Market | Active Properties | Monthly Revenue | Daily Rate | Avg. Occupancy |
|---|---|---|---|---|
| Freeland | 11 | $8,436 | $684.29 | 42% |
| Berlin Township | 15 | $7,208 | $729.10 | 35% |
| Polk Township | 15 | $6,974 | $520.26 | 38% |
| Town of Kingston | 10 | $6,470 | $473.76 | 49% |
| Frankford Township | 11 | $6,329 | $505.19 | 41% |
| Spring Lake Heights | 16 | $5,785 | $725.20 | 40% |
| Stroud Township | 137 | $5,728 | $478.40 | 40% |
| Town of Monroe | 22 | $5,690 | $720.52 | 37% |
| Hilltown Township | 11 | $5,557 | $578.96 | 40% |
| Town of Torrey | 34 | $5,535 | $437.35 | 50% |