Brecknock Township Airbnb Market Analysis 2025: Short Term Rental Data & Vacation Rental Statistics in Pennsylvania, United States
Is Airbnb profitable in Brecknock Township in 2025? Explore comprehensive Airbnb analytics for Brecknock Township, Pennsylvania, United States to uncover income potential. This 2025 STR market report for Brecknock Township, based on AirROI data from November 2024 to October 2025, reveals key trends in the niche market of 18 active listings.
Whether you're considering an Airbnb investment in Brecknock Township, optimizing your existing vacation rental, or exploring rental arbitrage opportunities, understanding the Brecknock Township Airbnb data is crucial. Leveraging the low regulation environment is key to maximizing your short term rental income potential. Let's dive into the specifics.
Key Brecknock Township Airbnb Performance Metrics Overview
Monthly Airbnb Revenue Variations & Income Potential in Brecknock Township (2025)
Understanding the monthly revenue variations for Airbnb listings in Brecknock Township is key to maximizing your short term rental income potential. Seasonality significantly impacts earnings. Our analysis, based on data from the past 12 months, shows that the peak revenue month for STRs in Brecknock Township is typically August, while February often presents the lowest earnings, highlighting opportunities for strategic pricing adjustments during shoulder and low seasons. Explore the typical Airbnb income in Brecknock Township across different performance tiers:
- Best-in-class properties (Top 10%) achieve $4,976+ monthly, often utilizing dynamic pricing and superior guest experiences.
- Strong performing properties (Top 25%) earn $3,054 or more, indicating effective management and desirable locations/amenities.
- Typical properties (Median) generate around $1,696 per month, representing the average market performance.
- Entry-level properties (Bottom 25%) see earnings around $889, often with potential for optimization.
Average Monthly Airbnb Earnings Trend in Brecknock Township
Brecknock Township Airbnb Occupancy Rate Trends (2025)
Maximize your bookings by understanding the Brecknock Township STR occupancy trends. Seasonal demand shifts significantly influence how often properties are booked. Typically, Augustsees the highest demand (peak season occupancy), while January experiences the lowest (low season). Effective strategies, like adjusting minimum stays or offering promotions, can boost occupancy during slower periods. Here's how different property tiers perform in Brecknock Township:
- Best-in-class properties (Top 10%) achieve 83%+ occupancy, indicating high desirability and potentially optimized availability.
- Strong performing properties (Top 25%) maintain 71% or higher occupancy, suggesting good market fit and guest satisfaction.
- Typical properties (Median) have an occupancy rate around 50%.
- Entry-level properties (Bottom 25%) average 30% occupancy, potentially facing higher vacancy.
Average Monthly Occupancy Rate Trend in Brecknock Township
Average Daily Rate (ADR) Airbnb Trends in Brecknock Township (2025)
Effective short term rental pricing strategy in Brecknock Township involves understanding monthly ADR fluctuations. The Average Daily Rate (ADR) for Airbnb in Brecknock Township typically peaks in May and dips lowest during July. Leveraging Airbnb dynamic pricing tools or strategies based on this seasonality can significantly boost revenue. Here's a look at the typical nightly rates achieved:
- Best-in-class properties (Top 10%) command rates of $377+ per night, often due to premium features or locations.
- Strong performing properties (Top 25%) achieve nightly rates of $192 or more.
- Typical properties (Median) charge around $123 per night.
- Entry-level properties (Bottom 25%) earn around $93 per night.
Average Daily Rate (ADR) Trend by Month in Brecknock Township
Get Live Brecknock Township Market Intelligence 👇

Explore Real-time Analytics
Airbnb Seasonality Analysis & Trends in Brecknock Township (2025)
Peak Season (August, June, July)
- Revenue averages $2,711 per month
- Occupancy rates average 58.7%
- Daily rates average $146
Shoulder Season
- Revenue averages $2,349 per month
- Occupancy maintains around 51.4%
- Daily rates hold near $166
Low Season (January, February, April)
- Revenue drops to average $1,611 per month
- Occupancy decreases to average 40.3%
- Daily rates adjust to average $176
Seasonality Insights for Brecknock Township
- The Airbnb seasonality in Brecknock Township shows moderate seasonality with distinct peak and low periods. While the sections above show seasonal averages, it's also insightful to look at the extremes:
- During the high season, the absolute peak month showcases Brecknock Township's highest earning potential, with monthly revenues capable of climbing to $2,771, occupancy reaching a high of 60.6%, and ADRs peaking at $183.
- Conversely, the slowest single month of the year, typically falling within the low season, marks the market's lowest point. In this month, revenue might dip to $1,388, occupancy could drop to 34.3%, and ADRs may adjust down to $142.
- Understanding both the seasonal averages and these monthly peaks and troughs in revenue, occupancy, and ADR is crucial for maximizing your Airbnb profit potential in Brecknock Township.
Seasonal Strategies for Maximizing Profit
- Peak Season: Maximize revenue through premium pricing and potentially longer minimum stays. Ensure high availability.
- Low Season: Offer competitive pricing, special promotions (e.g., extended stay discounts), and flexible cancellation policies. Target off-season travelers like remote workers or budget-conscious guests.
- Shoulder Seasons: Implement dynamic pricing that balances peak and low rates. Target weekend travelers or specific events. Offer slightly more flexible terms than peak season.
- Regularly analyze your own performance against these Brecknock Township seasonality benchmarks and adjust your pricing and availability strategy accordingly.
Best Areas for Airbnb Investment in Brecknock Township (2025)
Exploring the top neighborhoods for short-term rentals in Brecknock Township? This section highlights key areas, outlining why they are attractive for hosts and guests, along with notable local attractions. Consider these locations based on your target guest profile and investment strategy.
| Neighborhood / Area | Why Host Here? (Target Guests & Appeal) | Key Attractions & Landmarks |
|---|---|---|
| Brecknock Township Center | The township center offers a charming small-town atmosphere with easy access to local amenities. It's perfect for families and visitors looking for a peaceful retreat while still being close to attractions. | Brecknock Park, Local Shops, Community Events, Outdoor Activities |
| Muddy Creek Forks | Known for its natural beauty and outdoor recreation opportunities, this area attracts nature lovers and those seeking tranquility. It's ideal for cabins and rural getaways. | Muddy Creek, Nature Trails, Fishing Spots, Hiking Areas |
| Hickory Corners | A quiet neighborhood offering a rural setting with larger properties. Ideal for those looking to host guests seeking a farmstay experience or a peaceful escape from city life. | Local Farms, Fruit Picking, Scenic Drives, Historic Sites |
| Bowers | Bowers is a quaint village that serves as a great base for exploring the surrounding countryside. It appeals to travelers who appreciate rural charm and local culture. | Historic Bowers Church, Community Park, Local Festivals |
| Reinholds | A small community known for its welcoming atmosphere and local attractions. Great for visitors seeking authenticity and a taste of local life. | Local Markets, Community Events, Nearby Parks |
| Strasburg | Nearby Strasburg offers a quaint, historical setting that attracts tourists, especially those interested in Pennsylvania Dutch culture and heritage. | Strasburg Railroad, Amish Country Tours, Historic Sites, Local Crafts |
| Lancaster | While slightly outside of Brecknock Township, Lancaster is a major tourist destination known for its Amish culture, making it appealing to guests seeking unique experiences. | Amish Village, Lancaster Central Market, Sight and Sound Theatre, Shopping and Dining |
| East Earl | A peaceful area known for its agricultural landscape and traditional homes. It caters to those looking for a rural retreat away from urban noise. | Local Farms, Scenic Views, Biking Trails, Community Parks |
Understanding Airbnb License Requirements & STR Laws in Brecknock Township (2025)
While Brecknock Township, Pennsylvania, United States currently shows low STR regulations, specific Airbnb license requirements might still exist or change. Always verify the latest short term rental regulations and Airbnb license requirements directly with local government authorities for Brecknock Township to ensure full compliance before hosting.
(Source: AirROI data, 2025, finding no licensed listings among those analyzed)
Top Performing Airbnb Properties in Brecknock Township (2025)
Benchmark your potential! Explore examples of top-performing Airbnb properties in Brecknock Townshipbased on Trailing Twelve Month (TTM) revenue. Analyze their characteristics, revenue, occupancy rate, and ADR to understand what drives success in this market.
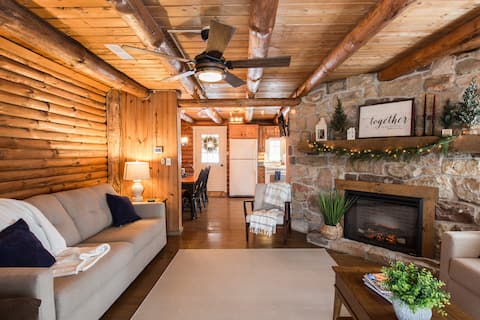
Fox Creek Cabin, private wooded property w/ stream
Entire Place • 4 bedrooms
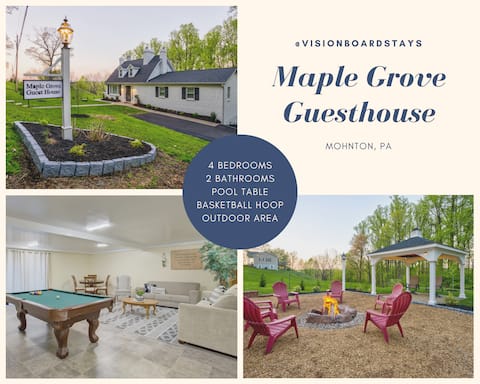
1 Mi. to Maple Grove Raceway, PoolTable & Backyard
Entire Place • 4 bedrooms
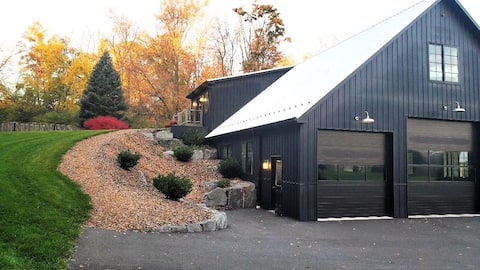
Loft 311
Entire Place • 1 bedroom
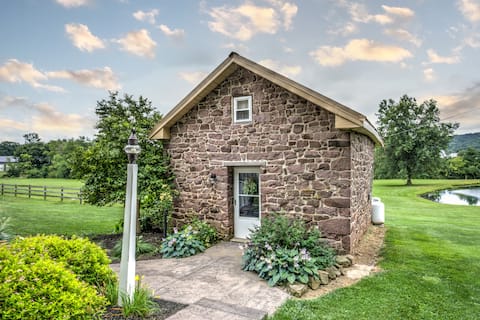
Laurel Springs Guest House
Entire Place • 1 bedroom
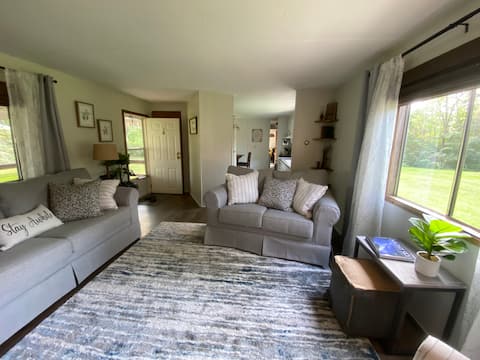
Cozy hideaway on your own corner of our homestead
Entire Place • 2 bedrooms
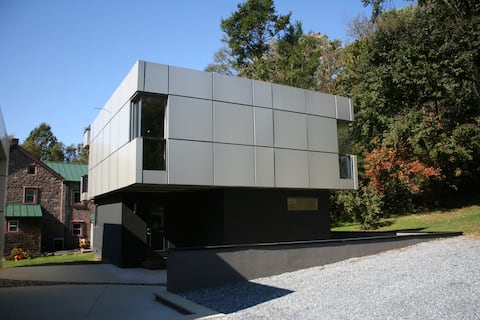
The CUBE
Entire Place • 2 bedrooms
Note: Performance varies based on location, size, amenities, seasonality, and management quality. Data reflects the past 12 months.
Top Performing Airbnb Hosts in Brecknock Township (2025)
Learn from the best! This table showcases top-performing Airbnb hosts in Brecknock Township based on the number of properties managed and estimated total revenue over the past year. Analyze their scale and performance metrics.
| Host Name | Properties | Grossing Revenue | Stay Reviews | Avg Rating |
|---|---|---|---|---|
| Donny And Michelle | 1 | $64,273 | 328 | 4.99/5.0 |
| Juliana | 1 | $62,295 | 92 | 4.89/5.0 |
| Charissa | 1 | $41,265 | 157 | 4.99/5.0 |
| Carla | 1 | $39,199 | 349 | 4.99/5.0 |
| Annette | 1 | $29,361 | 237 | 4.90/5.0 |
| Scott | 1 | $26,821 | 98 | 4.73/5.0 |
| Lucinda Leid | 1 | $25,429 | 95 | 5.00/5.0 |
| Govind And Florita | 4 | $23,943 | 671 | 4.91/5.0 |
| Marcyanna | 1 | $19,485 | 391 | 4.81/5.0 |
| Sheila | 1 | $18,647 | 679 | 4.98/5.0 |
Analyzing the strategies of top hosts, such as their property selection, pricing, and guest communication, can offer valuable lessons for optimizing your own Airbnb operations in Brecknock Township.
Dive Deeper: Advanced Brecknock Township STR Market Data (2025)
Ready to unlock more insights? AirROI provides access to advanced metrics and comprehensive Airbnb data for Brecknock Township. Explore detailed analytics beyond this report to refine your investment strategy, optimize pricing, and maximize your vacation rental profits.
Explore Advanced MetricsBrecknock Township Short-Term Rental Market Composition (2025): Property & Room Types
Room Type Distribution
Property Type Distribution
Market Composition Insights for Brecknock Township
- The Brecknock Township Airbnb market composition is heavily skewed towards Entire Home/Apt listings, which make up 83.3% of the 18 active rentals. This indicates strong guest preference for privacy and space.
- Looking at the property type distribution in Brecknock Township, House properties are the most common (38.9%), reflecting the local real estate landscape.
- Houses represent a significant 38.9% portion, catering likely to families or larger groups.
- The presence of 11.1% Hotel/Boutique listings indicates integration with traditional hospitality.
Brecknock Township Airbnb Room Capacity Analysis (2025): Bedroom Distribution
Distribution of Listings by Number of Bedrooms
Room Capacity Insights for Brecknock Township
- The dominant room capacity in Brecknock Township is 1 bedroom listings, making up 38.9% of the market. This suggests a strong demand for properties suitable for couples or solo travelers.
- Together, 1 bedroom and 4 bedrooms properties represent 55.6% of the active Airbnb listings in Brecknock Township, indicating a high concentration in these sizes.
- A significant 22.3% of listings offer 3+ bedrooms, catering to larger groups and families seeking more space in Brecknock Township.
Brecknock Township Vacation Rental Guest Capacity Trends (2025)
Distribution of Listings by Guest Capacity
Guest Capacity Insights for Brecknock Township
- The most common guest capacity trend in Brecknock Township vacation rentals is listings accommodating 2 guests (27.8%). This suggests the primary traveler segment is likely couples or solo travelers.
- Properties designed for 2 guests and 4 guests dominate the Brecknock Township STR market, accounting for 50.0% of listings.
- 22.3% of properties accommodate 6+ guests, serving the market segment for larger families or group travel in Brecknock Township.
- On average, properties in Brecknock Township are equipped to host 3.5 guests.
Brecknock Township Airbnb Booking Patterns (2025): Available vs. Booked Days
Available Days Distribution
Booked Days Distribution
Booking Pattern Insights for Brecknock Township
- The most common availability pattern in Brecknock Township falls within the 181-270 days range, representing 44.4% of listings. This suggests many properties have significant open periods on their calendars.
- Approximately 66.6% of listings show high availability (181+ days open annually), indicating potential for increased bookings or specific owner usage patterns.
- For booked days, the 91-180 days range is most frequent in Brecknock Township (44.4%), reflecting common guest stay durations or potential owner blocking patterns.
- A notable 33.3% of properties secure long booking periods (181+ days booked per year), highlighting successful long-term rental strategies or significant owner usage.
Brecknock Township Airbnb Minimum Stay Requirements Analysis
Distribution of Listings by Minimum Night Requirement
1 Night
10 listings
55.6% of total
2 Nights
3 listings
16.7% of total
3 Nights
1 listings
5.6% of total
30+ Nights
4 listings
22.2% of total
Key Insights
- The most prevalent minimum stay requirement in Brecknock Township is 1 Night, adopted by 55.6% of listings. This highlights the market's preference for shorter, flexible bookings.
- A strong majority (72.3%) of the Brecknock Township Airbnb data shows acceptance of very short stays (1-2 nights), indicating a dynamic, high-turnover market.
- A significant segment (22.2%) caters to monthly stays (30+ nights) in Brecknock Township, pointing to opportunities in the extended-stay market.
Recommendations
- Align with the market by considering a 1 Night minimum stay, as 55.6% of Brecknock Township hosts use this setting.
- Explore offering discounts for stays of 30+ nights to attract the 22.2% of the market seeking extended stays.
- Adjust minimum nights based on seasonality – potentially shorter during low season and longer during peak demand periods in Brecknock Township.
Brecknock Township Airbnb Cancellation Policy Trends Analysis (2025)
Flexible
10 listings
55.6% of total
Moderate
5 listings
27.8% of total
Firm
2 listings
11.1% of total
Strict
1 listings
5.6% of total
Cancellation Policy Insights for Brecknock Township
- The prevailing Airbnb cancellation policy trend in Brecknock Township is Flexible, used by 55.6% of listings.
- The market strongly favors guest-friendly terms, with 83.4% of listings offering Flexible or Moderate policies. This suggests guests in Brecknock Township may expect booking flexibility.
- Strict cancellation policies are quite rare (5.6%), potentially making listings with this policy less competitive unless justified by high demand or property type.
Recommendations for Hosts
- Consider adopting a Flexible policy to align with the 55.6% market standard in Brecknock Township.
- Given the high prevalence of Flexible policies (55.6%), offering this can enhance booking appeal, especially during shoulder seasons.
- Using a Strict policy might deter some guests, as only 5.6% of listings use it. Evaluate if potential revenue protection outweighs possible lower booking rates.
- Regularly review your cancellation policy against competitors and market demand shifts in Brecknock Township.
Brecknock Township STR Booking Lead Time Analysis (2025)
Average Booking Lead Time by Month
Booking Lead Time Insights for Brecknock Township
- The overall average booking lead time for vacation rentals in Brecknock Township is 40 days.
- Guests book furthest in advance for stays during September (average 76 days), likely coinciding with peak travel demand or local events.
- The shortest booking windows occur for stays in January (average 25 days), indicating more last-minute travel plans during this time.
- Seasonally, Fall (61 days avg.) sees the longest lead times, while Winter (29 days avg.) has the shortest, reflecting typical travel planning cycles.
Recommendations for Hosts
- Use the overall average lead time (40 days) as a baseline for your pricing and availability strategy in Brecknock Township.
- For September stays, consider implementing length-of-stay discounts or slightly higher rates for bookings made less than 76 days out to capitalize on advance planning.
- Target marketing efforts for the Fall season well in advance (at least 61 days) to capture early planners.
- Monitor your own booking lead times against these Brecknock Township averages to identify opportunities for dynamic pricing adjustments.
Popular & Essential Airbnb Amenities in Brecknock Township (2025)
Amenity Prevalence
Amenity Insights for Brecknock Township
- Essential amenities in Brecknock Township that guests expect include: Wifi, Heating, Smoke alarm, Air conditioning, Free parking on premises, Hot water. Lacking these (any) could significantly impact bookings.
- Popular amenities like Private entrance, Fire extinguisher, Kitchen are common but not universal. Offering these can provide a competitive edge.
Recommendations for Hosts
- Ensure your listing includes all essential amenities for Brecknock Township: Wifi, Heating, Smoke alarm, Air conditioning, Free parking on premises, Hot water.
- Consider adding popular differentiators like Private entrance or Fire extinguisher to increase appeal.
- Highlight unique or less common amenities you offer (e.g., hot tub, dedicated workspace, EV charger) in your listing description and photos.
- Regularly check competitor amenities in Brecknock Township to stay competitive.
Brecknock Township Airbnb Guest Demographics & Profile Analysis (2025)
Guest Profile Summary for Brecknock Township
- The typical guest profile for Airbnb in Brecknock Township consists of primarily domestic travelers (96%), often arriving from nearby New York, typically belonging to the Post-2000s (Gen Z/Alpha) group (50%), primarily speaking English or Spanish.
- Domestic travelers account for 96.3% of guests.
- Key international markets include United States (96.3%) and Canada (1.2%).
- Top languages spoken are English (77.5%) followed by Spanish (10%).
- A significant demographic segment is the Post-2000s (Gen Z/Alpha) group, representing 50% of guests.
Recommendations for Hosts
- Target domestic marketing efforts towards travelers from New York and Philadelphia.
- Tailor amenities and listing descriptions to appeal to the dominant Post-2000s (Gen Z/Alpha) demographic (e.g., highlight fast WiFi, smart home features, local guides).
- Highlight unique local experiences or amenities relevant to the primary guest profile.
- Consider seasonal promotions aligned with peak travel times for key origin markets.
Nearby Short-Term Rental Market Comparison
How does the Brecknock Township Airbnb market stack up against its neighbors? Compare key performance metrics like average monthly revenue, ADR, and occupancy rates in surrounding areas to understand the broader regional STR landscape.
| Market | Active Properties | Monthly Revenue | Daily Rate | Avg. Occupancy |
|---|---|---|---|---|
| Freeland | 10 | $9,465 | $755.73 | 40% |
| Berlin Township | 15 | $7,289 | $729.20 | 35% |
| Lemont | 21 | $6,886 | $899.31 | 38% |
| Polk Township | 15 | $6,786 | $520.11 | 38% |
| Centreville | 16 | $6,145 | $599.99 | 42% |
| State College | 171 | $6,023 | $744.32 | 40% |
| Stroud Township | 141 | $5,934 | $488.89 | 41% |
| Hellam Township | 23 | $5,803 | $404.52 | 46% |
| Foster Township | 21 | $5,721 | $534.09 | 39% |
| Shannondale | 48 | $5,591 | $328.04 | 56% |