Bloomfield Township Airbnb Market Analysis 2026: Short Term Rental Data & Vacation Rental Statistics in Pennsylvania, United States
Is Airbnb profitable in Bloomfield Township in 2026? Explore comprehensive Airbnb analytics for Bloomfield Township, Pennsylvania, United States to uncover income potential. This 2026 STR market report for Bloomfield Township, based on AirROI data from February 2025 to January 2026, reveals key trends in the niche market of 34 active listings.
Whether you're considering an Airbnb investment in Bloomfield Township, optimizing your existing vacation rental, or exploring rental arbitrage opportunities, understanding the Bloomfield Township Airbnb data is crucial. Leveraging the low regulation environment is key to maximizing your short term rental income potential. Let's dive into the specifics.
Key Bloomfield Township Airbnb Performance Metrics Overview
Monthly Airbnb Revenue Variations & Income Potential in Bloomfield Township (2026)
Understanding the monthly revenue variations for Airbnb listings in Bloomfield Township is key to maximizing your short term rental income potential. Seasonality significantly impacts earnings. Our analysis, based on data from the past 12 months, shows that the peak revenue month for STRs in Bloomfield Township is typically July, while May often presents the lowest earnings, highlighting opportunities for strategic pricing adjustments during shoulder and low seasons. Explore the typical Airbnb income in Bloomfield Township across different performance tiers:
- Best-in-class properties (Top 10%) achieve $4,325+ monthly, often utilizing dynamic pricing and superior guest experiences.
- Strong performing properties (Top 25%) earn $2,603 or more, indicating effective management and desirable locations/amenities.
- Typical properties (Median) generate around $1,277 per month, representing the average market performance.
- Entry-level properties (Bottom 25%) see earnings around $747, often with potential for optimization.
Average Monthly Airbnb Earnings Trend in Bloomfield Township
Bloomfield Township Airbnb Occupancy Rate Trends (2026)
Maximize your bookings by understanding the Bloomfield Township STR occupancy trends. Seasonal demand shifts significantly influence how often properties are booked. Typically, Julysees the highest demand (peak season occupancy), while February experiences the lowest (low season). Effective strategies, like adjusting minimum stays or offering promotions, can boost occupancy during slower periods. Here's how different property tiers perform in Bloomfield Township:
- Best-in-class properties (Top 10%) achieve 55%+ occupancy, indicating high desirability and potentially optimized availability.
- Strong performing properties (Top 25%) maintain 41% or higher occupancy, suggesting good market fit and guest satisfaction.
- Typical properties (Median) have an occupancy rate around 27%.
- Entry-level properties (Bottom 25%) average 16% occupancy, potentially facing higher vacancy.
Average Monthly Occupancy Rate Trend in Bloomfield Township
Average Daily Rate (ADR) Airbnb Trends in Bloomfield Township (2026)
Effective short term rental pricing strategy in Bloomfield Township involves understanding monthly ADR fluctuations. The Average Daily Rate (ADR) for Airbnb in Bloomfield Township typically peaks in October and dips lowest during March. Leveraging Airbnb dynamic pricing tools or strategies based on this seasonality can significantly boost revenue. Here's a look at the typical nightly rates achieved:
- Best-in-class properties (Top 10%) command rates of $254+ per night, often due to premium features or locations.
- Strong performing properties (Top 25%) achieve nightly rates of $182 or more.
- Typical properties (Median) charge around $143 per night.
- Entry-level properties (Bottom 25%) earn around $122 per night.
Average Daily Rate (ADR) Trend by Month in Bloomfield Township
Get Live Bloomfield Township Market Intelligence 👇

Explore Real-time Analytics
Airbnb Seasonality Analysis & Trends in Bloomfield Township (2026)
Peak Season (July, August, November)
- Revenue averages $2,360 per month
- Occupancy rates average 42.0%
- Daily rates average $164
Shoulder Season
- Revenue averages $1,794 per month
- Occupancy maintains around 26.0%
- Daily rates hold near $165
Low Season (March, May, June)
- Revenue drops to average $1,432 per month
- Occupancy decreases to average 25.2%
- Daily rates adjust to average $159
Seasonality Insights for Bloomfield Township
- The Airbnb seasonality in Bloomfield Township shows highly seasonal trends requiring careful strategy. While the sections above show seasonal averages, it's also insightful to look at the extremes:
- During the high season, the absolute peak month showcases Bloomfield Township's highest earning potential, with monthly revenues capable of climbing to $2,835, occupancy reaching a high of 54.4%, and ADRs peaking at $173.
- Conversely, the slowest single month of the year, typically falling within the low season, marks the market's lowest point. In this month, revenue might dip to $1,209, occupancy could drop to 19.1%, and ADRs may adjust down to $153.
- Understanding both the seasonal averages and these monthly peaks and troughs in revenue, occupancy, and ADR is crucial for maximizing your Airbnb profit potential in Bloomfield Township.
Seasonal Strategies for Maximizing Profit
- Peak Season: Maximize revenue through premium pricing and potentially longer minimum stays. Ensure high availability.
- Low Season: Offer competitive pricing, special promotions (e.g., extended stay discounts), and flexible cancellation policies. Target off-season travelers like remote workers or budget-conscious guests.
- Shoulder Seasons: Implement dynamic pricing that balances peak and low rates. Target weekend travelers or specific events. Offer slightly more flexible terms than peak season.
- Regularly analyze your own performance against these Bloomfield Township seasonality benchmarks and adjust your pricing and availability strategy accordingly.
Best Areas for Airbnb Investment in Bloomfield Township (2026)
Exploring the top neighborhoods for short-term rentals in Bloomfield Township? This section highlights key areas, outlining why they are attractive for hosts and guests, along with notable local attractions. Consider these locations based on your target guest profile and investment strategy.
| Neighborhood / Area | Why Host Here? (Target Guests & Appeal) | Key Attractions & Landmarks |
|---|---|---|
| Pinecrest | Suburban neighborhood known for its excellent schools and family-friendly atmosphere, making it appealing for family travelers and long-term stays. | Pinecrest Gardens, The Pinecrest Farmers Market, Dadeland Mall, Coral Reef Park, Matheson Hammock Park |
| Oakland | Quaint township known for its parks and community events, appealing to those looking for a tranquil getaway close to nature. | Oakland Park, Wampum Lake Park, Local festivals, Nearby hiking trails, Community Farmers Market |
| Squirrel Hill | Vibrant neighborhood famous for its cultural diversity and eclectic dining options, attracting food lovers and cultural tourists. | Squirrel Hill Historical Society, Shadyside Nursery, Schenley Park, Local eateries, Pittsburgh Art Museum |
| Fox Chapel | Upscale area with beautiful homes and scenic river views, attracting those looking for luxury and tranquility. | Fox Chapel Yacht Club, Aspinwall Riverfront Park, Local art galleries, Fox Chapel Golf Club, Nearby upscale dining |
| Upper St. Clair | Family-friendly suburb with parks and recreational facilities, ideal for those seeking a peaceful retreat with family-oriented activities. | Upper St. Clair Community and Recreation Center, Tyler Park, Hembree Park, Local shopping centers, Nearby schools |
| Churchill | Small borough with a close-knit community vibe, perfect for travelers looking for a quiet and genuine local experience. | Churchill Valley Country Club, Local shops, Natural parks, Community events, Nice neighborhoods |
| Monroeville | Convenient suburban location with diverse shopping and dining options, drawing both business and leisure travelers. | Monroeville Mall, Local cinemas, Parks and recreation centers, Nearby hotels, Dining variety |
| Penn Hills | Diverse and evolving neighborhood with numerous parks and recreational activities, great for outdoor enthusiasts and families. | Penn Hills Park, Hiking trails, Community parks, Local festivals, Nearby schools |
Understanding Airbnb License Requirements & STR Laws in Bloomfield Township (2026)
While Bloomfield Township, Pennsylvania, United States currently shows low STR regulations, specific Airbnb license requirements might still exist or change. Always verify the latest short term rental regulations and Airbnb license requirements directly with local government authorities for Bloomfield Township to ensure full compliance before hosting.
(Source: AirROI data, 2026, finding no licensed listings among those analyzed)
Top Performing Airbnb Properties in Bloomfield Township (2026)
Benchmark your potential! Explore examples of top-performing Airbnb properties in Bloomfield Townshipbased on Trailing Twelve Month (TTM) revenue. Analyze their characteristics, revenue, occupancy rate, and ADR to understand what drives success in this market.

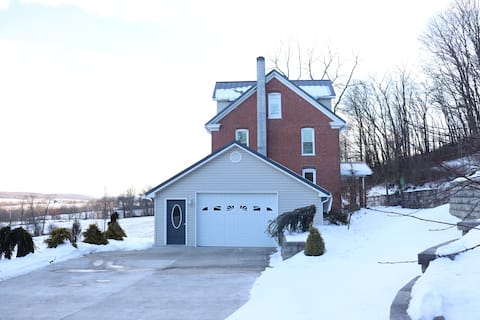
Secluded, Spacious Cabin~ hot tub and picnic area
Entire Place • 7 bedrooms
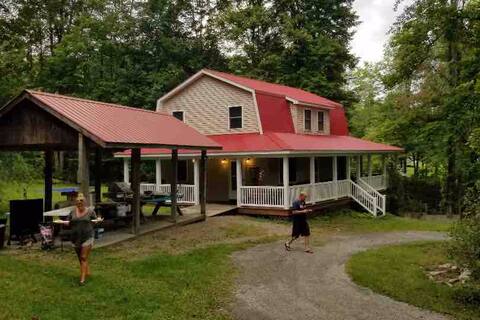
Mountainview vacation home| Fire Pit|View|Raystown
Entire Place • 4 bedrooms
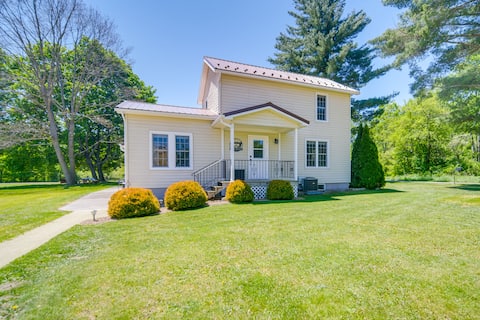
Large Family Camp
Entire Place • 3 bedrooms

Dock Holiday - Lakefront Canadohta Cottage
Entire Place • 2 bedrooms

Canadohta Lakefront Cottage - 3 BR -Dock-Modern
Entire Place • 3 bedrooms
Pet-Friendly Centerville Home w/ Fire Pit & Grill
Entire Place • 3 bedrooms
Note: Performance varies based on location, size, amenities, seasonality, and management quality. Data reflects the past 12 months.
Top Performing Airbnb Hosts in Bloomfield Township (2026)
Learn from the best! This table showcases top-performing Airbnb hosts in Bloomfield Township based on the number of properties managed and estimated total revenue over the past year. Analyze their scale and performance metrics.
| Host Name | Properties | Grossing Revenue | Stay Reviews | Avg Rating |
|---|---|---|---|---|
| Tina | 4 | $55,056 | 66 | 4.87/5.0 |
| Tyler | 1 | $41,849 | 40 | 4.95/5.0 |
| Matthew | 1 | $40,354 | 251 | 4.89/5.0 |
| Kyle | 1 | $37,351 | 40 | 4.93/5.0 |
| Tammy | 5 | $31,786 | 30 | 5.00/5.0 |
| Amanda | 1 | $28,956 | 51 | 4.94/5.0 |
| Marianne | 2 | $23,506 | 137 | 4.88/5.0 |
| Evolve | 1 | $21,902 | 41 | 4.90/5.0 |
| Evolve | 1 | $20,288 | 8 | 5.00/5.0 |
| Chris | 1 | $13,904 | 73 | 4.78/5.0 |
Analyzing the strategies of top hosts, such as their property selection, pricing, and guest communication, can offer valuable lessons for optimizing your own Airbnb operations in Bloomfield Township.
Dive Deeper: Advanced Bloomfield Township STR Market Data (2026)
Ready to unlock more insights? AirROI provides access to advanced metrics and comprehensive Airbnb data for Bloomfield Township. Explore detailed analytics beyond this report to refine your investment strategy, optimize pricing, and maximize your vacation rental profits.
Explore Advanced MetricsBloomfield Township Short-Term Rental Market Composition (2026): Property & Room Types
Room Type Distribution
Property Type Distribution
Market Composition Insights for Bloomfield Township
- The Bloomfield Township Airbnb market composition is heavily skewed towards Entire Home/Apt listings, which make up 97.1% of the 34 active rentals. This indicates strong guest preference for privacy and space.
- Looking at the property type distribution in Bloomfield Township, House properties are the most common (85.3%), reflecting the local real estate landscape.
- Houses represent a significant 85.3% portion, catering likely to families or larger groups.
- Smaller segments like apartment/condo, hotel/boutique (combined 5.8%) offer potential for unique stay experiences.
Bloomfield Township Airbnb Room Capacity Analysis (2026): Bedroom Distribution
Distribution of Listings by Number of Bedrooms
Room Capacity Insights for Bloomfield Township
- The dominant room capacity in Bloomfield Township is 2 bedrooms listings, making up 50% of the market. This suggests a strong demand for properties suitable for couples or solo travelers.
- Together, 2 bedrooms and 3 bedrooms properties represent 70.6% of the active Airbnb listings in Bloomfield Township, indicating a high concentration in these sizes.
- A significant 32.3% of listings offer 3+ bedrooms, catering to larger groups and families seeking more space in Bloomfield Township.
Bloomfield Township Vacation Rental Guest Capacity Trends (2026)
Distribution of Listings by Guest Capacity
Guest Capacity Insights for Bloomfield Township
- The most common guest capacity trend in Bloomfield Township vacation rentals is listings accommodating 6 guests (47.1%). This suggests the primary traveler segment is likely larger groups.
- Properties designed for 6 guests and 8+ guests dominate the Bloomfield Township STR market, accounting for 67.7% of listings.
- 70.6% of properties accommodate 6+ guests, serving the market segment for larger families or group travel in Bloomfield Township.
- On average, properties in Bloomfield Township are equipped to host 5.8 guests.
Bloomfield Township Airbnb Booking Patterns (2026): Available vs. Booked Days
Available Days Distribution
Booked Days Distribution
Booking Pattern Insights for Bloomfield Township
- The most common availability pattern in Bloomfield Township falls within the 271-366 days range, representing 76.5% of listings. This suggests many properties have significant open periods on their calendars.
- Approximately 100.0% of listings show high availability (181+ days open annually), indicating potential for increased bookings or specific owner usage patterns.
- For booked days, the 31-90 days range is most frequent in Bloomfield Township (55.9%), reflecting common guest stay durations or potential owner blocking patterns.
Bloomfield Township Airbnb Minimum Stay Requirements Analysis
Distribution of Listings by Minimum Night Requirement
1 Night
5 listings
14.7% of total
2 Nights
17 listings
50% of total
3 Nights
3 listings
8.8% of total
4-6 Nights
1 listings
2.9% of total
30+ Nights
8 listings
23.5% of total
Key Insights
- The most prevalent minimum stay requirement in Bloomfield Township is 2 Nights, adopted by 50% of listings. This highlights the market's preference for shorter, flexible bookings.
- A strong majority (64.7%) of the Bloomfield Township Airbnb data shows acceptance of very short stays (1-2 nights), indicating a dynamic, high-turnover market.
- A significant segment (23.5%) caters to monthly stays (30+ nights) in Bloomfield Township, pointing to opportunities in the extended-stay market.
Recommendations
- Align with the market by considering a 2 Nights minimum stay, as 50% of Bloomfield Township hosts use this setting.
- If feasible, allowing 1-night stays, especially midweek or during low season, could capture last-minute bookings, as only 14.7% currently do.
- A 2-night minimum appears standard (50%). Consider this for weekends or peak periods.
- Explore offering discounts for stays of 30+ nights to attract the 23.5% of the market seeking extended stays.
- Adjust minimum nights based on seasonality – potentially shorter during low season and longer during peak demand periods in Bloomfield Township.
Bloomfield Township Airbnb Cancellation Policy Trends Analysis (2026)
Flexible
5 listings
14.7% of total
Moderate
4 listings
11.8% of total
Firm
13 listings
38.2% of total
Strict
12 listings
35.3% of total
Cancellation Policy Insights for Bloomfield Township
- The prevailing Airbnb cancellation policy trend in Bloomfield Township is Firm, used by 38.2% of listings.
- A majority (73.5%) of hosts in Bloomfield Township utilize Firm or Strict policies, indicating a market where hosts prioritize booking security.
Recommendations for Hosts
- Consider adopting a Firm policy to align with the 38.2% market standard in Bloomfield Township.
- With 35.3% using Strict terms, this is a viable option in Bloomfield Township, particularly for high-value properties or during peak demand periods.
- Regularly review your cancellation policy against competitors and market demand shifts in Bloomfield Township.
Bloomfield Township STR Booking Lead Time Analysis (2026)
Average Booking Lead Time by Month
Booking Lead Time Insights for Bloomfield Township
- The overall average booking lead time for vacation rentals in Bloomfield Township is 64 days.
- Guests book furthest in advance for stays during July (average 105 days), likely coinciding with peak travel demand or local events.
- The shortest booking windows occur for stays in February (average 20 days), indicating more last-minute travel plans during this time.
- Seasonally, Summer (71 days avg.) sees the longest lead times, while Winter (29 days avg.) has the shortest, reflecting typical travel planning cycles.
Recommendations for Hosts
- Use the overall average lead time (64 days) as a baseline for your pricing and availability strategy in Bloomfield Township.
- For July stays, consider implementing length-of-stay discounts or slightly higher rates for bookings made less than 105 days out to capitalize on advance planning.
- Target marketing efforts for the Summer season well in advance (at least 71 days) to capture early planners.
- Monitor your own booking lead times against these Bloomfield Township averages to identify opportunities for dynamic pricing adjustments.
Popular & Essential Airbnb Amenities in Bloomfield Township (2026)
Amenity Prevalence
Amenity Insights for Bloomfield Township
- Essential amenities in Bloomfield Township that guests expect include: Free parking on premises, Hot water, Heating. Lacking these (any) could significantly impact bookings.
- Popular amenities like Smoke alarm, Kitchen, Dishes and silverware are common but not universal. Offering these can provide a competitive edge.
Recommendations for Hosts
- Ensure your listing includes all essential amenities for Bloomfield Township: Free parking on premises, Hot water, Heating.
- Prioritize adding missing essentials: Free parking on premises, Hot water, Heating.
- Consider adding popular differentiators like Smoke alarm or Kitchen to increase appeal.
- Highlight unique or less common amenities you offer (e.g., hot tub, dedicated workspace, EV charger) in your listing description and photos.
- Regularly check competitor amenities in Bloomfield Township to stay competitive.
Bloomfield Township Airbnb Guest Demographics & Profile Analysis (2026)
Guest Profile Summary for Bloomfield Township
- The typical guest profile for Airbnb in Bloomfield Township consists of primarily domestic travelers (98%), often arriving from nearby Pittsburgh, typically belonging to the Post-2000s (Gen Z/Alpha) group (50%), primarily speaking English or Spanish.
- Domestic travelers account for 97.8% of guests.
- Key international markets include United States (97.8%) and Canada (1.1%).
- Top languages spoken are English (81.8%) followed by Spanish (9.1%).
- A significant demographic segment is the Post-2000s (Gen Z/Alpha) group, representing 50% of guests.
Recommendations for Hosts
- Target domestic marketing efforts towards travelers from Pittsburgh and Erie.
- Tailor amenities and listing descriptions to appeal to the dominant Post-2000s (Gen Z/Alpha) demographic (e.g., highlight fast WiFi, smart home features, local guides).
- Highlight unique local experiences or amenities relevant to the primary guest profile.
- Consider seasonal promotions aligned with peak travel times for key origin markets.
Nearby Short-Term Rental Market Comparison
How does the Bloomfield Township Airbnb market stack up against its neighbors? Compare key performance metrics like average monthly revenue, ADR, and occupancy rates in surrounding areas to understand the broader regional STR landscape.
| Market | Active Properties | Monthly Revenue | Daily Rate | Avg. Occupancy |
|---|---|---|---|---|
| Town of Mansfield | 61 | $4,782 | $517.31 | 32% |
| Town of Elma | 11 | $3,973 | $445.95 | 44% |
| Pine Creek Township | 10 | $3,889 | $230.94 | 57% |
| Sewickley | 14 | $3,774 | $230.59 | 59% |
| Buffalo Township | 11 | $3,682 | $257.23 | 44% |
| Town of West Seneca | 19 | $3,674 | $277.29 | 47% |
| Halfmoon Township | 25 | $3,654 | $668.26 | 31% |
| Oakmont | 11 | $3,622 | $265.08 | 49% |
| Clinton Township | 13 | $3,493 | $330.11 | 33% |
| North East Township | 41 | $3,444 | $313.39 | 42% |