Benner Township Airbnb Market Analysis 2026: Short Term Rental Data & Vacation Rental Statistics in Pennsylvania, United States
Is Airbnb profitable in Benner Township in 2026? Explore comprehensive Airbnb analytics for Benner Township, Pennsylvania, United States to uncover income potential. This 2026 STR market report for Benner Township, based on AirROI data from February 2025 to January 2026, reveals key trends in the niche market of 78 active listings.
Whether you're considering an Airbnb investment in Benner Township, optimizing your existing vacation rental, or exploring rental arbitrage opportunities, understanding the Benner Township Airbnb data is crucial. Leveraging the low regulation environment is key to maximizing your short term rental income potential. Let's dive into the specifics.
Key Benner Township Airbnb Performance Metrics Overview
Monthly Airbnb Revenue Variations & Income Potential in Benner Township (2026)
Understanding the monthly revenue variations for Airbnb listings in Benner Township is key to maximizing your short term rental income potential. Seasonality significantly impacts earnings. Our analysis, based on data from the past 12 months, shows that the peak revenue month for STRs in Benner Township is typically September, while January often presents the lowest earnings, highlighting opportunities for strategic pricing adjustments during shoulder and low seasons. Explore the typical Airbnb income in Benner Township across different performance tiers:
- Best-in-class properties (Top 10%) achieve $14,646+ monthly, often utilizing dynamic pricing and superior guest experiences.
- Strong performing properties (Top 25%) earn $6,635 or more, indicating effective management and desirable locations/amenities.
- Typical properties (Median) generate around $3,257 per month, representing the average market performance.
- Entry-level properties (Bottom 25%) see earnings around $1,785, often with potential for optimization.
Average Monthly Airbnb Earnings Trend in Benner Township
Benner Township Airbnb Occupancy Rate Trends (2026)
Maximize your bookings by understanding the Benner Township STR occupancy trends. Seasonal demand shifts significantly influence how often properties are booked. Typically, Augustsees the highest demand (peak season occupancy), while January experiences the lowest (low season). Effective strategies, like adjusting minimum stays or offering promotions, can boost occupancy during slower periods. Here's how different property tiers perform in Benner Township:
- Best-in-class properties (Top 10%) achieve 76%+ occupancy, indicating high desirability and potentially optimized availability.
- Strong performing properties (Top 25%) maintain 55% or higher occupancy, suggesting good market fit and guest satisfaction.
- Typical properties (Median) have an occupancy rate around 32%.
- Entry-level properties (Bottom 25%) average 19% occupancy, potentially facing higher vacancy.
Average Monthly Occupancy Rate Trend in Benner Township
Average Daily Rate (ADR) Airbnb Trends in Benner Township (2026)
Effective short term rental pricing strategy in Benner Township involves understanding monthly ADR fluctuations. The Average Daily Rate (ADR) for Airbnb in Benner Township typically peaks in November and dips lowest during March. Leveraging Airbnb dynamic pricing tools or strategies based on this seasonality can significantly boost revenue. Here's a look at the typical nightly rates achieved:
- Best-in-class properties (Top 10%) command rates of $1,348+ per night, often due to premium features or locations.
- Strong performing properties (Top 25%) achieve nightly rates of $730 or more.
- Typical properties (Median) charge around $371 per night.
- Entry-level properties (Bottom 25%) earn around $248 per night.
Average Daily Rate (ADR) Trend by Month in Benner Township
Get Live Benner Township Market Intelligence 👇

Explore Real-time Analytics
Airbnb Seasonality Analysis & Trends in Benner Township (2026)
Peak Season (September, October, August)
- Revenue averages $8,968 per month
- Occupancy rates average 46.9%
- Daily rates average $598
Shoulder Season
- Revenue averages $5,609 per month
- Occupancy maintains around 36.0%
- Daily rates hold near $575
Low Season (January, February, July)
- Revenue drops to average $2,817 per month
- Occupancy decreases to average 32.4%
- Daily rates adjust to average $552
Seasonality Insights for Benner Township
- The Airbnb seasonality in Benner Township shows highly seasonal trends requiring careful strategy. While the sections above show seasonal averages, it's also insightful to look at the extremes:
- During the high season, the absolute peak month showcases Benner Township's highest earning potential, with monthly revenues capable of climbing to $9,350, occupancy reaching a high of 52.6%, and ADRs peaking at $624.
- Conversely, the slowest single month of the year, typically falling within the low season, marks the market's lowest point. In this month, revenue might dip to $2,275, occupancy could drop to 20.9%, and ADRs may adjust down to $539.
- Understanding both the seasonal averages and these monthly peaks and troughs in revenue, occupancy, and ADR is crucial for maximizing your Airbnb profit potential in Benner Township.
Seasonal Strategies for Maximizing Profit
- Peak Season: Maximize revenue through premium pricing and potentially longer minimum stays. Ensure high availability.
- Low Season: Offer competitive pricing, special promotions (e.g., extended stay discounts), and flexible cancellation policies. Target off-season travelers like remote workers or budget-conscious guests.
- Shoulder Seasons: Implement dynamic pricing that balances peak and low rates. Target weekend travelers or specific events. Offer slightly more flexible terms than peak season.
- Regularly analyze your own performance against these Benner Township seasonality benchmarks and adjust your pricing and availability strategy accordingly.
Best Areas for Airbnb Investment in Benner Township (2026)
Exploring the top neighborhoods for short-term rentals in Benner Township? This section highlights key areas, outlining why they are attractive for hosts and guests, along with notable local attractions. Consider these locations based on your target guest profile and investment strategy.
| Neighborhood / Area | Why Host Here? (Target Guests & Appeal) | Key Attractions & Landmarks |
|---|---|---|
| Lake Harmony | A popular vacation destination known for its scenic lake and outdoor activities. Ideal for families and nature lovers seeking year-round recreational options such as boating, hiking, and skiing in the winter. | Lake Harmony, Big Boulder Lake, Poconos Mountains, Hickory Run State Park, Jack Frost Ski Resort, Clearwater Lake |
| Jim Thorpe | A historic town often referred to as the 'Gateway to the Poconos', known for its stunning Victorian architecture and outdoor adventures. Offers a rich cultural experience with art, music, and local festivals. | Jim Thorpe Historic District, Lehigh Gorge State Park, Mauch Chunk Museum, Skirmish Paintball, Old Jail Museum, Biking on the Lehigh Gorge Trail |
| Stroudsburg | A vibrant town with a mix of urban and rural charm, serving as a hub for outdoor activities in the Pocono region. Great for those looking for access to both nature and amenities. | Downtown Stroudsburg, Delaware Water Gap National Recreation Area, Stroud Mansion, Sherman Theater, East Stroudsburg University, River Road Scenic Byway |
| Poconos Mountain Lake District | A picturesque area filled with lakes and natural beauty, popular for water sports and relaxing retreats. Attracts visitors year-round for its recreational facilities. | Lake Wallenpaupack, Beltzville Lake, Promised Land State Park, Poconos Horseback Riding, Lake Naomi, Poconos Indoor Waterpark |
| East Stroudsburg | A charming borough with proximity to outdoor adventures and a college town vibe. Ideal for visitors who enjoy hiking, skiing, and exploring local culture. | East Stroudsburg University, Stroudsburg-Pocono Airport, Delaware River Tubing, Bushkill Falls, Shawnee Mountain Ski Area, Kittatinny Canoes |
| Tannersville | Known for its outlet shopping and close proximity to ski resorts. A great spot for families and shoppers looking for a combination of leisure and activity. | The Crossings Premium Outlets, Camelback Mountain Resort, Camelbeach Mountain Waterpark, State Game Lands, Kalahari Resorts |
| Mount Pocono | A central location in the Poconos with access to both nature and entertainment, popular for its resorts and outdoor activities. Suitable for tourists looking for a variety of experiences. | Mount Pocono Mountains, Kalahari Indoor Waterpark, Mount Airy Casino, Pocono Raceway, Adventure Park at Skirmish |
| Bushkill | Known for the spectacular Bushkill Falls, often called the 'Niagara of Pennsylvania'. A haven for nature lovers and outdoor activities, appealing to tourists year-round. | Bushkill Falls, Delaware Water Gap National Recreation Area, Poconos Environmental Education Center, River Trips, Hiking trails |
Understanding Airbnb License Requirements & STR Laws in Benner Township (2026)
While Benner Township, Pennsylvania, United States currently shows low STR regulations, specific Airbnb license requirements might still exist or change. Always verify the latest short term rental regulations and Airbnb license requirements directly with local government authorities for Benner Township to ensure full compliance before hosting.
(Source: AirROI data, 2026, finding no licensed listings among those analyzed)
Top Performing Airbnb Properties in Benner Township (2026)
Benchmark your potential! Explore examples of top-performing Airbnb properties in Benner Townshipbased on Trailing Twelve Month (TTM) revenue. Analyze their characteristics, revenue, occupancy rate, and ADR to understand what drives success in this market.
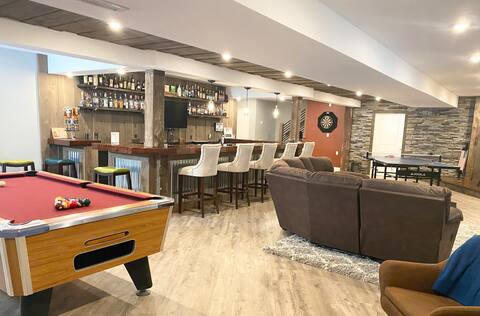
Luxury Home w/Wet Bar & Game Tables. Min from PSU.
Entire Place • 4 bedrooms
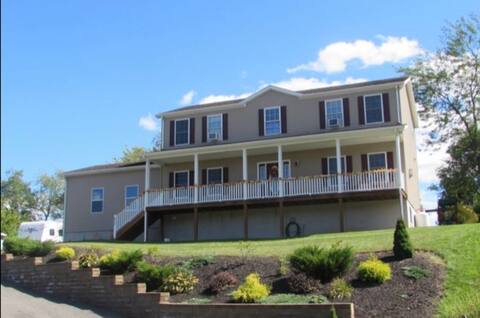
Spacious, open layout 5 bedroom home.
Entire Place • 5 bedrooms

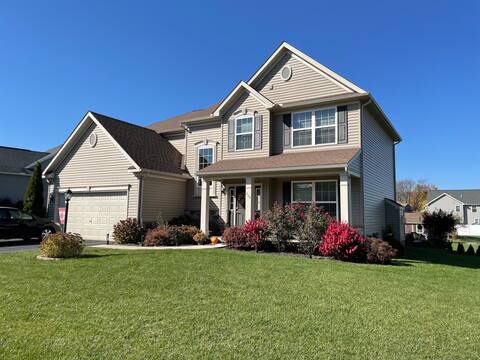
Family friendly home in a quiet neighborhood
Entire Place • 4 bedrooms
PSU home - sleeps 13+
Entire Place • 5 bedrooms
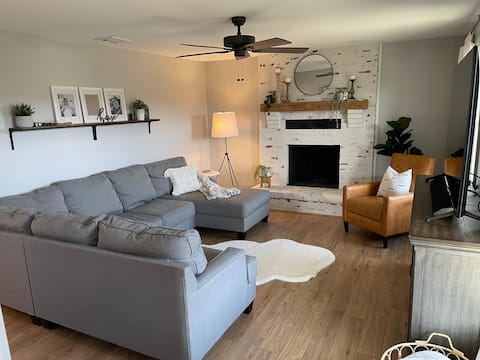
Trendy Family Home Close to Penn State w/ Big Yard
Entire Place • 4 bedrooms

Newer home minutes from PENN STATE games!
Entire Place • 3 bedrooms
Note: Performance varies based on location, size, amenities, seasonality, and management quality. Data reflects the past 12 months.
Top Performing Airbnb Hosts in Benner Township (2026)
Learn from the best! This table showcases top-performing Airbnb hosts in Benner Township based on the number of properties managed and estimated total revenue over the past year. Analyze their scale and performance metrics.
| Host Name | Properties | Grossing Revenue | Stay Reviews | Avg Rating |
|---|---|---|---|---|
| Keith | 1 | $241,450 | 15 | 5.00/5.0 |
| Nathan | 1 | $224,047 | 6 | 5.00/5.0 |
| Aaron | 1 | $218,529 | 9 | 4.89/5.0 |
| Tia | 1 | $196,276 | 22 | 5.00/5.0 |
| Josiah | 1 | $186,275 | 7 | 5.00/5.0 |
| Brittany | 1 | $146,401 | 10 | 5.00/5.0 |
| Nik | 3 | $142,786 | 387 | 4.90/5.0 |
| Abby | 1 | $135,624 | 16 | 5.00/5.0 |
| Kara | 1 | $127,232 | 24 | 4.92/5.0 |
| Ivan | 1 | $119,651 | 25 | 5.00/5.0 |
Analyzing the strategies of top hosts, such as their property selection, pricing, and guest communication, can offer valuable lessons for optimizing your own Airbnb operations in Benner Township.
Dive Deeper: Advanced Benner Township STR Market Data (2026)
Ready to unlock more insights? AirROI provides access to advanced metrics and comprehensive Airbnb data for Benner Township. Explore detailed analytics beyond this report to refine your investment strategy, optimize pricing, and maximize your vacation rental profits.
Explore Advanced MetricsBenner Township Short-Term Rental Market Composition (2026): Property & Room Types
Room Type Distribution
Property Type Distribution
Market Composition Insights for Benner Township
- The Benner Township Airbnb market composition is heavily skewed towards Entire Home/Apt listings, which make up 98.7% of the 78 active rentals. This indicates strong guest preference for privacy and space.
- Looking at the property type distribution in Benner Township, House properties are the most common (74.4%), reflecting the local real estate landscape.
- Houses represent a significant 74.4% portion, catering likely to families or larger groups.
Benner Township Airbnb Room Capacity Analysis (2026): Bedroom Distribution
Distribution of Listings by Number of Bedrooms
Room Capacity Insights for Benner Township
- The dominant room capacity in Benner Township is 3 bedrooms listings, making up 44.9% of the market. This suggests a strong demand for properties suitable for families or small groups.
- Together, 3 bedrooms and 2 bedrooms properties represent 62.8% of the active Airbnb listings in Benner Township, indicating a high concentration in these sizes.
- A significant 66.7% of listings offer 3+ bedrooms, catering to larger groups and families seeking more space in Benner Township.
Benner Township Vacation Rental Guest Capacity Trends (2026)
Distribution of Listings by Guest Capacity
Guest Capacity Insights for Benner Township
- The most common guest capacity trend in Benner Township vacation rentals is listings accommodating 8+ guests (48.7%). This suggests the primary traveler segment is likely larger groups.
- Properties designed for 8+ guests and 6 guests dominate the Benner Township STR market, accounting for 71.8% of listings.
- 75.6% of properties accommodate 6+ guests, serving the market segment for larger families or group travel in Benner Township.
- On average, properties in Benner Township are equipped to host 6.5 guests.
Benner Township Airbnb Booking Patterns (2026): Available vs. Booked Days
Available Days Distribution
Booked Days Distribution
Booking Pattern Insights for Benner Township
- The most common availability pattern in Benner Township falls within the 181-270 days range, representing 44.9% of listings. This suggests many properties have significant open periods on their calendars.
- Approximately 87.2% of listings show high availability (181+ days open annually), indicating potential for increased bookings or specific owner usage patterns.
- For booked days, the 91-180 days range is most frequent in Benner Township (46.2%), reflecting common guest stay durations or potential owner blocking patterns.
- A notable 14.1% of properties secure long booking periods (181+ days booked per year), highlighting successful long-term rental strategies or significant owner usage.
Benner Township Airbnb Minimum Stay Requirements Analysis
Distribution of Listings by Minimum Night Requirement
1 Night
21 listings
26.9% of total
2 Nights
33 listings
42.3% of total
4-6 Nights
1 listings
1.3% of total
30+ Nights
23 listings
29.5% of total
Key Insights
- The most prevalent minimum stay requirement in Benner Township is 2 Nights, adopted by 42.3% of listings. This highlights the market's preference for shorter, flexible bookings.
- A strong majority (69.2%) of the Benner Township Airbnb data shows acceptance of very short stays (1-2 nights), indicating a dynamic, high-turnover market.
- A significant segment (29.5%) caters to monthly stays (30+ nights) in Benner Township, pointing to opportunities in the extended-stay market.
Recommendations
- Align with the market by considering a 2 Nights minimum stay, as 42.3% of Benner Township hosts use this setting.
- If feasible, allowing 1-night stays, especially midweek or during low season, could capture last-minute bookings, as only 26.9% currently do.
- Explore offering discounts for stays of 30+ nights to attract the 29.5% of the market seeking extended stays.
- Adjust minimum nights based on seasonality – potentially shorter during low season and longer during peak demand periods in Benner Township.
Benner Township Airbnb Cancellation Policy Trends Analysis (2026)
Flexible
10 listings
12.8% of total
Moderate
12 listings
15.4% of total
Firm
37 listings
47.4% of total
Strict
19 listings
24.4% of total
Cancellation Policy Insights for Benner Township
- The prevailing Airbnb cancellation policy trend in Benner Township is Firm, used by 47.4% of listings.
- A majority (71.8%) of hosts in Benner Township utilize Firm or Strict policies, indicating a market where hosts prioritize booking security.
Recommendations for Hosts
- Consider adopting a Firm policy to align with the 47.4% market standard in Benner Township.
- Regularly review your cancellation policy against competitors and market demand shifts in Benner Township.
Benner Township STR Booking Lead Time Analysis (2026)
Average Booking Lead Time by Month
Booking Lead Time Insights for Benner Township
- The overall average booking lead time for vacation rentals in Benner Township is 87 days.
- Guests book furthest in advance for stays during May (average 124 days), likely coinciding with peak travel demand or local events.
- The shortest booking windows occur for stays in February (average 27 days), indicating more last-minute travel plans during this time.
- Seasonally, Fall (103 days avg.) sees the longest lead times, while Winter (60 days avg.) has the shortest, reflecting typical travel planning cycles.
Recommendations for Hosts
- Use the overall average lead time (87 days) as a baseline for your pricing and availability strategy in Benner Township.
- For May stays, consider implementing length-of-stay discounts or slightly higher rates for bookings made less than 124 days out to capitalize on advance planning.
- Target marketing efforts for the Fall season well in advance (at least 103 days) to capture early planners.
- Monitor your own booking lead times against these Benner Township averages to identify opportunities for dynamic pricing adjustments.
Popular & Essential Airbnb Amenities in Benner Township (2026)
Amenity Prevalence
Amenity Insights for Benner Township
- Essential amenities in Benner Township that guests expect include: Free parking on premises, Wifi, Smoke alarm, TV. Lacking these (any) could significantly impact bookings.
- Popular amenities like Air conditioning, Heating, Kitchen are common but not universal. Offering these can provide a competitive edge.
Recommendations for Hosts
- Ensure your listing includes all essential amenities for Benner Township: Free parking on premises, Wifi, Smoke alarm, TV.
- Prioritize adding missing essentials: Smoke alarm, TV.
- Consider adding popular differentiators like Air conditioning or Heating to increase appeal.
- Highlight unique or less common amenities you offer (e.g., hot tub, dedicated workspace, EV charger) in your listing description and photos.
- Regularly check competitor amenities in Benner Township to stay competitive.
Benner Township Airbnb Guest Demographics & Profile Analysis (2026)
Guest Profile Summary for Benner Township
- The typical guest profile for Airbnb in Benner Township consists of primarily domestic travelers (96%), often arriving from nearby Philadelphia, typically belonging to the Post-2000s (Gen Z/Alpha) group (50%), primarily speaking English or Spanish.
- Domestic travelers account for 96.3% of guests.
- Key international markets include United States (96.3%) and DC (0.7%).
- Top languages spoken are English (79.8%) followed by Spanish (10.9%).
- A significant demographic segment is the Post-2000s (Gen Z/Alpha) group, representing 50% of guests.
Recommendations for Hosts
- Target domestic marketing efforts towards travelers from Philadelphia and New York.
- Tailor amenities and listing descriptions to appeal to the dominant Post-2000s (Gen Z/Alpha) demographic (e.g., highlight fast WiFi, smart home features, local guides).
- Highlight unique local experiences or amenities relevant to the primary guest profile.
- Consider seasonal promotions aligned with peak travel times for key origin markets.
Nearby Short-Term Rental Market Comparison
How does the Benner Township Airbnb market stack up against its neighbors? Compare key performance metrics like average monthly revenue, ADR, and occupancy rates in surrounding areas to understand the broader regional STR landscape.
| Market | Active Properties | Monthly Revenue | Daily Rate | Avg. Occupancy |
|---|---|---|---|---|
| Polk Township | 15 | $6,974 | $520.26 | 38% |
| Lemont | 21 | $6,940 | $873.93 | 37% |
| College Township | 83 | $6,551 | $848.63 | 36% |
| Centreville | 17 | $6,298 | $565.66 | 45% |
| State College | 192 | $6,081 | $712.29 | 40% |
| Shannondale | 45 | $5,808 | $337.30 | 54% |
| Hellam Township | 24 | $5,496 | $386.69 | 45% |
| Ferguson Township | 126 | $5,115 | $800.25 | 36% |
| Lower Windsor Township | 14 | $5,062 | $428.71 | 45% |
| Bethel Township | 25 | $4,863 | $320.23 | 52% |