Benezette Township Airbnb Market Analysis 2026: Short Term Rental Data & Vacation Rental Statistics in Pennsylvania, United States
Is Airbnb profitable in Benezette Township in 2026? Explore comprehensive Airbnb analytics for Benezette Township, Pennsylvania, United States to uncover income potential. This 2026 STR market report for Benezette Township, based on AirROI data from February 2025 to January 2026, reveals key trends in the niche market of 26 active listings.
Whether you're considering an Airbnb investment in Benezette Township, optimizing your existing vacation rental, or exploring rental arbitrage opportunities, understanding the Benezette Township Airbnb data is crucial. Leveraging the low regulation environment is key to maximizing your short term rental income potential. Let's dive into the specifics.
Key Benezette Township Airbnb Performance Metrics Overview
Monthly Airbnb Revenue Variations & Income Potential in Benezette Township (2026)
Understanding the monthly revenue variations for Airbnb listings in Benezette Township is key to maximizing your short term rental income potential. Seasonality significantly impacts earnings. Our analysis, based on data from the past 12 months, shows that the peak revenue month for STRs in Benezette Township is typically October, while February often presents the lowest earnings, highlighting opportunities for strategic pricing adjustments during shoulder and low seasons. Explore the typical Airbnb income in Benezette Township across different performance tiers:
- Best-in-class properties (Top 10%) achieve $6,331+ monthly, often utilizing dynamic pricing and superior guest experiences.
- Strong performing properties (Top 25%) earn $3,927 or more, indicating effective management and desirable locations/amenities.
- Typical properties (Median) generate around $2,637 per month, representing the average market performance.
- Entry-level properties (Bottom 25%) see earnings around $1,714, often with potential for optimization.
Average Monthly Airbnb Earnings Trend in Benezette Township
Benezette Township Airbnb Occupancy Rate Trends (2026)
Maximize your bookings by understanding the Benezette Township STR occupancy trends. Seasonal demand shifts significantly influence how often properties are booked. Typically, Septembersees the highest demand (peak season occupancy), while January experiences the lowest (low season). Effective strategies, like adjusting minimum stays or offering promotions, can boost occupancy during slower periods. Here's how different property tiers perform in Benezette Township:
- Best-in-class properties (Top 10%) achieve 69%+ occupancy, indicating high desirability and potentially optimized availability.
- Strong performing properties (Top 25%) maintain 55% or higher occupancy, suggesting good market fit and guest satisfaction.
- Typical properties (Median) have an occupancy rate around 41%.
- Entry-level properties (Bottom 25%) average 25% occupancy, potentially facing higher vacancy.
Average Monthly Occupancy Rate Trend in Benezette Township
Average Daily Rate (ADR) Airbnb Trends in Benezette Township (2026)
Effective short term rental pricing strategy in Benezette Township involves understanding monthly ADR fluctuations. The Average Daily Rate (ADR) for Airbnb in Benezette Township typically peaks in October and dips lowest during February. Leveraging Airbnb dynamic pricing tools or strategies based on this seasonality can significantly boost revenue. Here's a look at the typical nightly rates achieved:
- Best-in-class properties (Top 10%) command rates of $435+ per night, often due to premium features or locations.
- Strong performing properties (Top 25%) achieve nightly rates of $308 or more.
- Typical properties (Median) charge around $211 per night.
- Entry-level properties (Bottom 25%) earn around $162 per night.
Average Daily Rate (ADR) Trend by Month in Benezette Township
Get Live Benezette Township Market Intelligence 👇

Explore Real-time Analytics
Airbnb Seasonality Analysis & Trends in Benezette Township (2026)
Peak Season (October, September, August)
- Revenue averages $4,838 per month
- Occupancy rates average 56.8%
- Daily rates average $290
Shoulder Season
- Revenue averages $2,889 per month
- Occupancy maintains around 38.4%
- Daily rates hold near $246
Low Season (January, February, April)
- Revenue drops to average $2,280 per month
- Occupancy decreases to average 31.5%
- Daily rates adjust to average $228
Seasonality Insights for Benezette Township
- The Airbnb seasonality in Benezette Township shows highly seasonal trends requiring careful strategy. While the sections above show seasonal averages, it's also insightful to look at the extremes:
- During the high season, the absolute peak month showcases Benezette Township's highest earning potential, with monthly revenues capable of climbing to $5,411, occupancy reaching a high of 62.4%, and ADRs peaking at $313.
- Conversely, the slowest single month of the year, typically falling within the low season, marks the market's lowest point. In this month, revenue might dip to $2,105, occupancy could drop to 26.8%, and ADRs may adjust down to $210.
- Understanding both the seasonal averages and these monthly peaks and troughs in revenue, occupancy, and ADR is crucial for maximizing your Airbnb profit potential in Benezette Township.
Seasonal Strategies for Maximizing Profit
- Peak Season: Maximize revenue through premium pricing and potentially longer minimum stays. Ensure high availability.
- Low Season: Offer competitive pricing, special promotions (e.g., extended stay discounts), and flexible cancellation policies. Target off-season travelers like remote workers or budget-conscious guests.
- Shoulder Seasons: Implement dynamic pricing that balances peak and low rates. Target weekend travelers or specific events. Offer slightly more flexible terms than peak season.
- Regularly analyze your own performance against these Benezette Township seasonality benchmarks and adjust your pricing and availability strategy accordingly.
Best Areas for Airbnb Investment in Benezette Township (2026)
Exploring the top neighborhoods for short-term rentals in Benezette Township? This section highlights key areas, outlining why they are attractive for hosts and guests, along with notable local attractions. Consider these locations based on your target guest profile and investment strategy.
| Neighborhood / Area | Why Host Here? (Target Guests & Appeal) | Key Attractions & Landmarks |
|---|---|---|
| Benezette | A small, charming village known for its scenic elk viewing opportunities. Ideal for nature lovers and tourists seeking an authentic rural Pennsylvania experience, with ample outdoor activities like hiking and wildlife observation. | Elk Country Visitor Center, Benezette Winery, State Game Lands, Quehanna Trail, Elk Watching |
| Medix Run | A peaceful area close to Benezette township, perfect for those looking to escape city life. Known for its natural beauty and access to outdoor adventures such as fishing, hiking, and camping. | Medix Run, Benezette River, Hiking Trails, Camping Sites |
| Dunlow | A quiet, secluded spot ideal for those seeking tranquility and nature. Attracts visitors looking for cabin rentals and a peaceful getaway in the woods. | Dunlow Trails, Wildlife Observation, Fishing Areas |
| Sinnemahoning State Park | A large state park offering a variety of recreational activities including camping, hiking, and fishing. Attracts families and outdoor enthusiasts. | Sinnemahoning Creek, Trackside Station, Wildlife Viewing |
| Renovo | Close to the Benezette area and offers beautiful landscapes. A great place for those who want to explore the outdoors and enjoy the serenity of the countryside. | Little Pine State Park, Renovo River, Hiking Trails, Wildlife Areas |
| Cameron County | Known for its natural beauty and outdoor activities, this area draws visitors interested in nature, hunting, and fishing. | Susquehannock State Forest, Kettle Creek State Park, Fishing and Hunting Areas |
| Clearfield County | Offers varied landscapes from forests to rivers, making it attractive for those looking to enjoy the outdoors. | Moshannon State Forest, Clearfield Creek, Outdoor Recreation Areas |
| Allegheny National Forest | A bit further but a prime destination for nature lovers. It offers numerous outdoor activities such as hiking, boating, and fishing, drawing tourists year-round. | Kinzua Dam, Red Bridge, Allegheny Reservoir, Hiking Trails |
Understanding Airbnb License Requirements & STR Laws in Benezette Township (2026)
While Benezette Township, Pennsylvania, United States currently shows low STR regulations, specific Airbnb license requirements might still exist or change. Always verify the latest short term rental regulations and Airbnb license requirements directly with local government authorities for Benezette Township to ensure full compliance before hosting.
(Source: AirROI data, 2026, finding no licensed listings among those analyzed)
Top Performing Airbnb Properties in Benezette Township (2026)
Benchmark your potential! Explore examples of top-performing Airbnb properties in Benezette Townshipbased on Trailing Twelve Month (TTM) revenue. Analyze their characteristics, revenue, occupancy rate, and ADR to understand what drives success in this market.

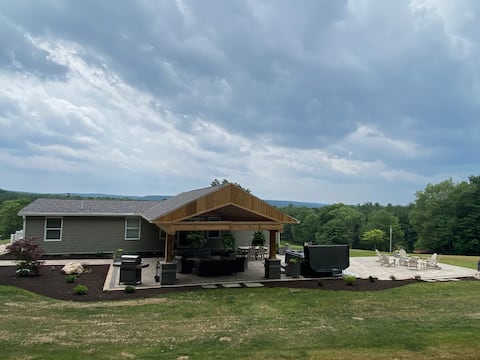
Hot Tub, Grill & Mtn Views! Benezette Cabin
Entire Place • 4 bedrooms
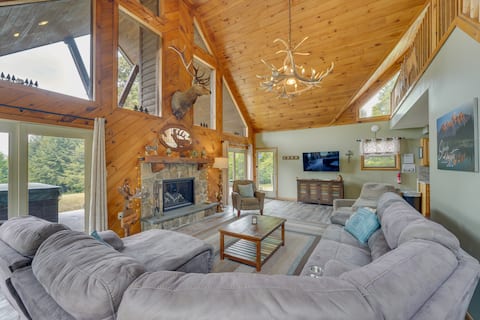
3-Acre Benezette Cabin: Hot Tub, Grill & Mtn View
Entire Place • 2 bedrooms
The Friday Escape! Stay on 60 acres (Winslow Hill)
Entire Place • 3 bedrooms

The Rut Hut on Winslow Hill
Entire Place • 2 bedrooms

Elk From the Hot Tub - Bugle Inn
Entire Place • 2 bedrooms

Deck, Hot Tub, Fire Pit: Rustic Cabin in Benezette
Entire Place • 3 bedrooms
Note: Performance varies based on location, size, amenities, seasonality, and management quality. Data reflects the past 12 months.
Top Performing Airbnb Hosts in Benezette Township (2026)
Learn from the best! This table showcases top-performing Airbnb hosts in Benezette Township based on the number of properties managed and estimated total revenue over the past year. Analyze their scale and performance metrics.
| Host Name | Properties | Grossing Revenue | Stay Reviews | Avg Rating |
|---|---|---|---|---|
| Evolve | 3 | $225,991 | 222 | 4.87/5.0 |
| Dylan | 3 | $90,063 | 190 | 4.76/5.0 |
| Brooke | 1 | $65,883 | 20 | 5.00/5.0 |
| Jeff And Tara | 2 | $64,684 | 172 | 4.92/5.0 |
| Thomas | 3 | $62,495 | 59 | 4.97/5.0 |
| Pam | 1 | $56,256 | 55 | 5.00/5.0 |
| Richie | 1 | $46,096 | 45 | 4.98/5.0 |
| McKenzie | 1 | $40,873 | 23 | 4.65/5.0 |
| Kayla | 1 | $37,754 | 172 | 4.85/5.0 |
| David | 1 | $29,381 | 58 | 4.95/5.0 |
Analyzing the strategies of top hosts, such as their property selection, pricing, and guest communication, can offer valuable lessons for optimizing your own Airbnb operations in Benezette Township.
Dive Deeper: Advanced Benezette Township STR Market Data (2026)
Ready to unlock more insights? AirROI provides access to advanced metrics and comprehensive Airbnb data for Benezette Township. Explore detailed analytics beyond this report to refine your investment strategy, optimize pricing, and maximize your vacation rental profits.
Explore Advanced MetricsBenezette Township Short-Term Rental Market Composition (2026): Property & Room Types
Room Type Distribution
Property Type Distribution
Market Composition Insights for Benezette Township
- The Benezette Township Airbnb market composition is heavily skewed towards Entire Home/Apt listings, which make up 100% of the 26 active rentals. This indicates strong guest preference for privacy and space.
- Looking at the property type distribution in Benezette Township, Outdoor/Unique properties are the most common (65.4%), reflecting the local real estate landscape.
- Houses represent a significant 26.9% portion, catering likely to families or larger groups.
- Smaller segments like unique stays, apartment/condo (combined 7.6%) offer potential for unique stay experiences.
Benezette Township Airbnb Room Capacity Analysis (2026): Bedroom Distribution
Distribution of Listings by Number of Bedrooms
Room Capacity Insights for Benezette Township
- The dominant room capacity in Benezette Township is 2 bedrooms listings, making up 57.7% of the market. This suggests a strong demand for properties suitable for couples or solo travelers.
- Together, 2 bedrooms and 3 bedrooms properties represent 76.9% of the active Airbnb listings in Benezette Township, indicating a high concentration in these sizes.
- A significant 30.7% of listings offer 3+ bedrooms, catering to larger groups and families seeking more space in Benezette Township.
Benezette Township Vacation Rental Guest Capacity Trends (2026)
Distribution of Listings by Guest Capacity
Guest Capacity Insights for Benezette Township
- The most common guest capacity trend in Benezette Township vacation rentals is listings accommodating 6 guests (30.8%). This suggests the primary traveler segment is likely larger groups.
- Properties designed for 6 guests and 8+ guests dominate the Benezette Township STR market, accounting for 57.7% of listings.
- 65.4% of properties accommodate 6+ guests, serving the market segment for larger families or group travel in Benezette Township.
- On average, properties in Benezette Township are equipped to host 6.0 guests.
Benezette Township Airbnb Booking Patterns (2026): Available vs. Booked Days
Available Days Distribution
Booked Days Distribution
Booking Pattern Insights for Benezette Township
- The most common availability pattern in Benezette Township falls within the 181-270 days range, representing 46.2% of listings. This suggests many properties have significant open periods on their calendars.
- Approximately 77.0% of listings show high availability (181+ days open annually), indicating potential for increased bookings or specific owner usage patterns.
- For booked days, the 91-180 days range is most frequent in Benezette Township (50%), reflecting common guest stay durations or potential owner blocking patterns.
- A notable 23.1% of properties secure long booking periods (181+ days booked per year), highlighting successful long-term rental strategies or significant owner usage.
Benezette Township Airbnb Minimum Stay Requirements Analysis
Distribution of Listings by Minimum Night Requirement
1 Night
2 listings
7.7% of total
2 Nights
17 listings
65.4% of total
30+ Nights
7 listings
26.9% of total
Key Insights
- The most prevalent minimum stay requirement in Benezette Township is 2 Nights, adopted by 65.4% of listings. This highlights the market's preference for shorter, flexible bookings.
- A strong majority (73.1%) of the Benezette Township Airbnb data shows acceptance of very short stays (1-2 nights), indicating a dynamic, high-turnover market.
- A significant segment (26.9%) caters to monthly stays (30+ nights) in Benezette Township, pointing to opportunities in the extended-stay market.
Recommendations
- Align with the market by considering a 2 Nights minimum stay, as 65.4% of Benezette Township hosts use this setting.
- If feasible, allowing 1-night stays, especially midweek or during low season, could capture last-minute bookings, as only 7.7% currently do.
- A 2-night minimum appears standard (65.4%). Consider this for weekends or peak periods.
- Explore offering discounts for stays of 30+ nights to attract the 26.9% of the market seeking extended stays.
- Adjust minimum nights based on seasonality – potentially shorter during low season and longer during peak demand periods in Benezette Township.
Benezette Township Airbnb Cancellation Policy Trends Analysis (2026)
Moderate
4 listings
15.4% of total
Firm
15 listings
57.7% of total
Strict
7 listings
26.9% of total
Cancellation Policy Insights for Benezette Township
- The prevailing Airbnb cancellation policy trend in Benezette Township is Firm, used by 57.7% of listings.
- A majority (84.6%) of hosts in Benezette Township utilize Firm or Strict policies, indicating a market where hosts prioritize booking security.
Recommendations for Hosts
- Consider adopting a Firm policy to align with the 57.7% market standard in Benezette Township.
- Regularly review your cancellation policy against competitors and market demand shifts in Benezette Township.
Benezette Township STR Booking Lead Time Analysis (2026)
Average Booking Lead Time by Month
Booking Lead Time Insights for Benezette Township
- The overall average booking lead time for vacation rentals in Benezette Township is 76 days.
- Guests book furthest in advance for stays during September (average 142 days), likely coinciding with peak travel demand or local events.
- The shortest booking windows occur for stays in December (average 45 days), indicating more last-minute travel plans during this time.
- Seasonally, Fall (119 days avg.) sees the longest lead times, while Spring (54 days avg.) has the shortest, reflecting typical travel planning cycles.
Recommendations for Hosts
- Use the overall average lead time (76 days) as a baseline for your pricing and availability strategy in Benezette Township.
- For September stays, consider implementing length-of-stay discounts or slightly higher rates for bookings made less than 142 days out to capitalize on advance planning.
- Target marketing efforts for the Fall season well in advance (at least 119 days) to capture early planners.
- Monitor your own booking lead times against these Benezette Township averages to identify opportunities for dynamic pricing adjustments.
Popular & Essential Airbnb Amenities in Benezette Township (2026)
Amenity Prevalence
Amenity Insights for Benezette Township
- Essential amenities in Benezette Township that guests expect include: TV, Heating, Fire extinguisher, Hot water, Bed linens, Smoke alarm. Lacking these (any) could significantly impact bookings.
- Popular amenities like Kitchen, Air conditioning, Refrigerator are common but not universal. Offering these can provide a competitive edge.
- Warning: Wifi is not universally provided but is considered essential globally. Ensure reliable Wifi is offered.
Recommendations for Hosts
- Ensure your listing includes all essential amenities for Benezette Township: TV, Heating, Fire extinguisher, Hot water, Bed linens, Smoke alarm.
- Prioritize adding missing essentials: Hot water, Bed linens, Smoke alarm.
- Consider adding popular differentiators like Kitchen or Air conditioning to increase appeal.
- Highlight unique or less common amenities you offer (e.g., hot tub, dedicated workspace, EV charger) in your listing description and photos.
- Regularly check competitor amenities in Benezette Township to stay competitive.
Benezette Township Airbnb Guest Demographics & Profile Analysis (2026)
Guest Profile Summary for Benezette Township
- The typical guest profile for Airbnb in Benezette Township consists of primarily domestic travelers (97%), often arriving from nearby Erie, typically belonging to the Post-2000s (Gen Z/Alpha) group (50%), primarily speaking English or Polish.
- Domestic travelers account for 96.7% of guests.
- Key international markets include United States (96.7%) and Canada (1.6%).
- Top languages spoken are English (92.9%) followed by Polish (1.8%).
- A significant demographic segment is the Post-2000s (Gen Z/Alpha) group, representing 50% of guests.
Recommendations for Hosts
- Target domestic marketing efforts towards travelers from Erie and Philadelphia.
- Tailor amenities and listing descriptions to appeal to the dominant Post-2000s (Gen Z/Alpha) demographic (e.g., highlight fast WiFi, smart home features, local guides).
- Highlight unique local experiences or amenities relevant to the primary guest profile.
- Consider seasonal promotions aligned with peak travel times for key origin markets.
Nearby Short-Term Rental Market Comparison
How does the Benezette Township Airbnb market stack up against its neighbors? Compare key performance metrics like average monthly revenue, ADR, and occupancy rates in surrounding areas to understand the broader regional STR landscape.
| Market | Active Properties | Monthly Revenue | Daily Rate | Avg. Occupancy |
|---|---|---|---|---|
| Lemont | 21 | $6,940 | $873.93 | 37% |
| College Township | 83 | $6,551 | $848.63 | 36% |
| State College | 192 | $6,081 | $712.29 | 40% |
| Rushville | 16 | $5,126 | $656.66 | 41% |
| Ferguson Township | 126 | $5,115 | $800.25 | 36% |
| Town of Mansfield | 61 | $4,782 | $517.31 | 32% |
| Town of Canandaigua | 79 | $4,714 | $488.12 | 42% |
| Harris Township | 42 | $4,579 | $595.35 | 36% |
| Boalsburg | 39 | $4,536 | $693.13 | 33% |
| Benner Township | 78 | $4,534 | $549.23 | 38% |