Ararat Township Airbnb Market Analysis 2026: Short Term Rental Data & Vacation Rental Statistics in Pennsylvania, United States
Is Airbnb profitable in Ararat Township in 2026? Explore comprehensive Airbnb analytics for Ararat Township, Pennsylvania, United States to uncover income potential. This 2026 STR market report for Ararat Township, based on AirROI data from February 2025 to January 2026, reveals key trends in the niche market of 19 active listings.
Whether you're considering an Airbnb investment in Ararat Township, optimizing your existing vacation rental, or exploring rental arbitrage opportunities, understanding the Ararat Township Airbnb data is crucial. Leveraging the low regulation environment is key to maximizing your short term rental income potential. Let's dive into the specifics.
Key Ararat Township Airbnb Performance Metrics Overview
Monthly Airbnb Revenue Variations & Income Potential in Ararat Township (2026)
Understanding the monthly revenue variations for Airbnb listings in Ararat Township is key to maximizing your short term rental income potential. Seasonality significantly impacts earnings. Our analysis, based on data from the past 12 months, shows that the peak revenue month for STRs in Ararat Township is typically July, while March often presents the lowest earnings, highlighting opportunities for strategic pricing adjustments during shoulder and low seasons. Explore the typical Airbnb income in Ararat Township across different performance tiers:
- Best-in-class properties (Top 10%) achieve $5,847+ monthly, often utilizing dynamic pricing and superior guest experiences.
- Strong performing properties (Top 25%) earn $3,758 or more, indicating effective management and desirable locations/amenities.
- Typical properties (Median) generate around $2,204 per month, representing the average market performance.
- Entry-level properties (Bottom 25%) see earnings around $1,476, often with potential for optimization.
Average Monthly Airbnb Earnings Trend in Ararat Township
Ararat Township Airbnb Occupancy Rate Trends (2026)
Maximize your bookings by understanding the Ararat Township STR occupancy trends. Seasonal demand shifts significantly influence how often properties are booked. Typically, Julysees the highest demand (peak season occupancy), while April experiences the lowest (low season). Effective strategies, like adjusting minimum stays or offering promotions, can boost occupancy during slower periods. Here's how different property tiers perform in Ararat Township:
- Best-in-class properties (Top 10%) achieve 65%+ occupancy, indicating high desirability and potentially optimized availability.
- Strong performing properties (Top 25%) maintain 49% or higher occupancy, suggesting good market fit and guest satisfaction.
- Typical properties (Median) have an occupancy rate around 32%.
- Entry-level properties (Bottom 25%) average 21% occupancy, potentially facing higher vacancy.
Average Monthly Occupancy Rate Trend in Ararat Township
Average Daily Rate (ADR) Airbnb Trends in Ararat Township (2026)
Effective short term rental pricing strategy in Ararat Township involves understanding monthly ADR fluctuations. The Average Daily Rate (ADR) for Airbnb in Ararat Township typically peaks in July and dips lowest during March. Leveraging Airbnb dynamic pricing tools or strategies based on this seasonality can significantly boost revenue. Here's a look at the typical nightly rates achieved:
- Best-in-class properties (Top 10%) command rates of $627+ per night, often due to premium features or locations.
- Strong performing properties (Top 25%) achieve nightly rates of $307 or more.
- Typical properties (Median) charge around $197 per night.
- Entry-level properties (Bottom 25%) earn around $170 per night.
Average Daily Rate (ADR) Trend by Month in Ararat Township
Get Live Ararat Township Market Intelligence 👇

Explore Real-time Analytics
Airbnb Seasonality Analysis & Trends in Ararat Township (2026)
Peak Season (July, October, August)
- Revenue averages $3,809 per month
- Occupancy rates average 42.2%
- Daily rates average $295
Shoulder Season
- Revenue averages $2,903 per month
- Occupancy maintains around 34.0%
- Daily rates hold near $289
Low Season (February, March, April)
- Revenue drops to average $2,153 per month
- Occupancy decreases to average 31.4%
- Daily rates adjust to average $264
Seasonality Insights for Ararat Township
- The Airbnb seasonality in Ararat Township shows highly seasonal trends requiring careful strategy. While the sections above show seasonal averages, it's also insightful to look at the extremes:
- During the high season, the absolute peak month showcases Ararat Township's highest earning potential, with monthly revenues capable of climbing to $4,542, occupancy reaching a high of 43.9%, and ADRs peaking at $301.
- Conversely, the slowest single month of the year, typically falling within the low season, marks the market's lowest point. In this month, revenue might dip to $1,769, occupancy could drop to 27.7%, and ADRs may adjust down to $254.
- Understanding both the seasonal averages and these monthly peaks and troughs in revenue, occupancy, and ADR is crucial for maximizing your Airbnb profit potential in Ararat Township.
Seasonal Strategies for Maximizing Profit
- Peak Season: Maximize revenue through premium pricing and potentially longer minimum stays. Ensure high availability.
- Low Season: Offer competitive pricing, special promotions (e.g., extended stay discounts), and flexible cancellation policies. Target off-season travelers like remote workers or budget-conscious guests.
- Shoulder Seasons: Implement dynamic pricing that balances peak and low rates. Target weekend travelers or specific events. Offer slightly more flexible terms than peak season.
- Regularly analyze your own performance against these Ararat Township seasonality benchmarks and adjust your pricing and availability strategy accordingly.
Best Areas for Airbnb Investment in Ararat Township (2026)
Exploring the top neighborhoods for short-term rentals in Ararat Township? This section highlights key areas, outlining why they are attractive for hosts and guests, along with notable local attractions. Consider these locations based on your target guest profile and investment strategy.
| Neighborhood / Area | Why Host Here? (Target Guests & Appeal) | Key Attractions & Landmarks |
|---|---|---|
| Lake Wallenpaupack | A popular destination for water activities and outdoor recreation, Lake Wallenpaupack is perfect for family vacations and offers a scenic environment for visitors. | Lake Wallenpaupack, Pointe Recreation Area, Lakeside Park, Ski Big Bear at Masthope Mountain, Boulder Field |
| Scranton | An urban area with a rich history and a growing cultural scene, Scranton offers a mix of entertainment options, historical sites, and easy access to the Pocono Mountains. | The Electric City Trolley Museum, Steamtown National Historic Site, Lackawanna Coal Mine Tour, Nay Aug Park, Anthracite Heritage Museum |
| Poconos Mountains | Famous for its resorts and natural beauty, the Poconos are a year-round destination for outdoor enthusiasts and families looking for a recreational getaway. | Camelback Mountain Resort, Bushkill Falls, Shawnee Mountain Ski Area, Big Pocono State Park, Delaware Water Gap |
| Honesdale | A charming small town rich in history, Honesdale is close to nature and a great spot for visitors looking for a quieter experience with access to outdoor activities. | Wayne County Historical Society, The Poconos, Lake Wallenpaupack, Honesdale's Historic Main Street, Dingman's Ferry |
| Wilkes-Barre | A city with a strong arts and entertainment scene, Wilkes-Barre attracts visitors looking for cultural activities and proximity to outdoor adventures. | Wilkes-Barre River Common, F.M. Kirby Center for the Performing Arts, Luzerne County Community College, Mohegan Sun Arena, Seven Tubs Recreation Area |
| Jim Thorpe | Known as the 'Switzerland of America', Jim Thorpe is a picturesque town with stunning views and a variety of outdoor activities, making it a top choice for Airbnb hosts. | Jim Thorpe Memorial, Old Jail Museum, Lehigh Gorge Scenic Railway, Hiking and biking trails, Mauch Chunk Lake Park |
| Stroudsburg | A gateway to the Pocono Mountains with a vibrant downtown, Stroudsburg combines outdoor activities with a rich array of dining and shopping options. | Stroud Mansion, Quiet Valley Living Historical Farm, Pocono Mountains Visitors Center, Delaware Water Gap National Recreation Area, The Sherman Theater |
| East Stroudsburg | With close proximity to nature as well as town amenities, East Stroudsburg is a favorite for visitors wanting easy access to both the outdoors and urban conveniences. | East Stroudsburg University, The Shawnee Inn and Golf Resort, Delaware River, Camelbeach Mountain Waterpark, Nescopeck State Park |
Understanding Airbnb License Requirements & STR Laws in Ararat Township (2026)
While Ararat Township, Pennsylvania, United States currently shows low STR regulations, specific Airbnb license requirements might still exist or change. Always verify the latest short term rental regulations and Airbnb license requirements directly with local government authorities for Ararat Township to ensure full compliance before hosting.
(Source: AirROI data, 2026, finding no licensed listings among those analyzed)
Top Performing Airbnb Properties in Ararat Township (2026)
Benchmark your potential! Explore examples of top-performing Airbnb properties in Ararat Townshipbased on Trailing Twelve Month (TTM) revenue. Analyze their characteristics, revenue, occupancy rate, and ADR to understand what drives success in this market.
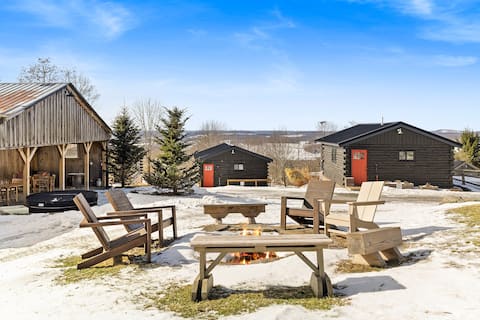
Retreat w/ Incredible Views, Hot Tub & Pavilion!
Entire Place • 4 bedrooms
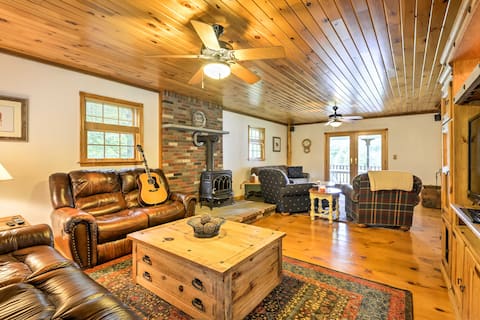
Thompson Home w/ Deck + Pond, 8 Mi to Elk Mountain
Entire Place • 3 bedrooms
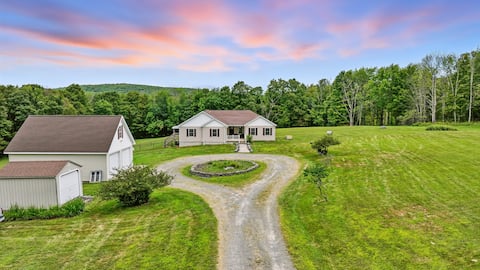
Elk Mountain Cottage, 12 beds and 5 bathrooms.
Entire Place • 8 bedrooms
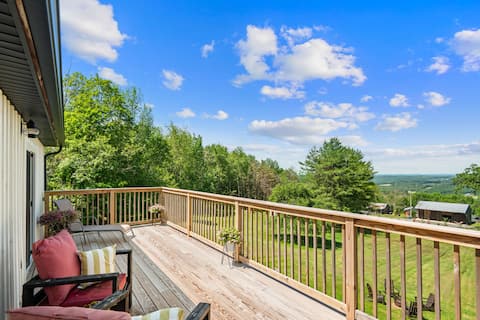
Close to Elk Mnt, Hot Tub, Campfires, Views!
Entire Place • 3 bedrooms

Romantic Winter Cabin w/ Hot Tub & Firepit
Entire Place • 1 bedroom

Peaceful Winter Escape w/ Hot Tub & Firepit!
Entire Place • 1 bedroom
Note: Performance varies based on location, size, amenities, seasonality, and management quality. Data reflects the past 12 months.
Top Performing Airbnb Hosts in Ararat Township (2026)
Learn from the best! This table showcases top-performing Airbnb hosts in Ararat Township based on the number of properties managed and estimated total revenue over the past year. Analyze their scale and performance metrics.
| Host Name | Properties | Grossing Revenue | Stay Reviews | Avg Rating |
|---|---|---|---|---|
| Lisa | 7 | $276,748 | 881 | 4.93/5.0 |
| Evolve | 1 | $55,838 | 62 | 4.94/5.0 |
| Philip | 1 | $52,666 | 17 | 5.00/5.0 |
| Lorraine | 1 | $30,757 | 125 | 4.98/5.0 |
| Bobby | 1 | $29,774 | 44 | 4.95/5.0 |
| Kelsey | 1 | $25,453 | 281 | 4.89/5.0 |
| Jade | 1 | $19,794 | 68 | 4.97/5.0 |
| Pamela | 1 | $17,737 | 68 | 5.00/5.0 |
| Lorraine | 1 | $17,700 | 63 | 4.94/5.0 |
| Thomas | 1 | $14,279 | 22 | 4.91/5.0 |
Analyzing the strategies of top hosts, such as their property selection, pricing, and guest communication, can offer valuable lessons for optimizing your own Airbnb operations in Ararat Township.
Dive Deeper: Advanced Ararat Township STR Market Data (2026)
Ready to unlock more insights? AirROI provides access to advanced metrics and comprehensive Airbnb data for Ararat Township. Explore detailed analytics beyond this report to refine your investment strategy, optimize pricing, and maximize your vacation rental profits.
Explore Advanced MetricsArarat Township Short-Term Rental Market Composition (2026): Property & Room Types
Room Type Distribution
Property Type Distribution
Market Composition Insights for Ararat Township
- The Ararat Township Airbnb market composition is heavily skewed towards Entire Home/Apt listings, which make up 100% of the 19 active rentals. This indicates strong guest preference for privacy and space.
- Looking at the property type distribution in Ararat Township, House properties are the most common (52.6%), reflecting the local real estate landscape.
- Houses represent a significant 52.6% portion, catering likely to families or larger groups.
Ararat Township Airbnb Room Capacity Analysis (2026): Bedroom Distribution
Distribution of Listings by Number of Bedrooms
Room Capacity Insights for Ararat Township
- The dominant room capacity in Ararat Township is 1 bedroom listings, making up 31.6% of the market. This suggests a strong demand for properties suitable for couples or solo travelers.
- Together, 1 bedroom and 2 bedrooms properties represent 57.9% of the active Airbnb listings in Ararat Township, indicating a high concentration in these sizes.
- A significant 42.1% of listings offer 3+ bedrooms, catering to larger groups and families seeking more space in Ararat Township.
Ararat Township Vacation Rental Guest Capacity Trends (2026)
Distribution of Listings by Guest Capacity
Guest Capacity Insights for Ararat Township
- The most common guest capacity trend in Ararat Township vacation rentals is listings accommodating 8+ guests (31.6%). This suggests the primary traveler segment is likely larger groups.
- Properties designed for 8+ guests and 6 guests dominate the Ararat Township STR market, accounting for 57.9% of listings.
- 63.2% of properties accommodate 6+ guests, serving the market segment for larger families or group travel in Ararat Township.
- On average, properties in Ararat Township are equipped to host 5.7 guests.
Ararat Township Airbnb Booking Patterns (2026): Available vs. Booked Days
Available Days Distribution
Booked Days Distribution
Booking Pattern Insights for Ararat Township
- The most common availability pattern in Ararat Township falls within the 271-366 days range, representing 52.6% of listings. This suggests many properties have significant open periods on their calendars.
- Approximately 94.7% of listings show high availability (181+ days open annually), indicating potential for increased bookings or specific owner usage patterns.
- For booked days, the 91-180 days range is most frequent in Ararat Township (52.6%), reflecting common guest stay durations or potential owner blocking patterns.
- A notable 5.3% of properties secure long booking periods (181+ days booked per year), highlighting successful long-term rental strategies or significant owner usage.
Ararat Township Airbnb Minimum Stay Requirements Analysis
Distribution of Listings by Minimum Night Requirement
1 Night
4 listings
21.1% of total
2 Nights
4 listings
21.1% of total
3 Nights
2 listings
10.5% of total
30+ Nights
9 listings
47.4% of total
Key Insights
- The most prevalent minimum stay requirement in Ararat Township is 30+ Nights, adopted by 47.4% of listings. This highlights the market's preference for longer commitments.
- A significant segment (47.4%) caters to monthly stays (30+ nights) in Ararat Township, pointing to opportunities in the extended-stay market.
Recommendations
- Align with the market by considering a 30+ Nights minimum stay, as 47.4% of Ararat Township hosts use this setting.
- If feasible, allowing 1-night stays, especially midweek or during low season, could capture last-minute bookings, as only 21.1% currently do.
- Explore offering discounts for stays of 30+ nights to attract the 47.4% of the market seeking extended stays.
- Adjust minimum nights based on seasonality – potentially shorter during low season and longer during peak demand periods in Ararat Township.
Ararat Township Airbnb Cancellation Policy Trends Analysis (2026)
Limited
6 listings
31.6% of total
Flexible
4 listings
21.1% of total
Moderate
2 listings
10.5% of total
Firm
6 listings
31.6% of total
Strict
1 listings
5.3% of total
Cancellation Policy Insights for Ararat Township
- The prevailing Airbnb cancellation policy trend in Ararat Township is Limited, used by 31.6% of listings.
- There's a relatively balanced mix between guest-friendly (31.6%) and stricter (36.9%) policies, offering choices for different guest needs.
- Strict cancellation policies are quite rare (5.3%), potentially making listings with this policy less competitive unless justified by high demand or property type.
Recommendations for Hosts
- Consider adopting a Limited policy to align with the 31.6% market standard in Ararat Township.
- Using a Strict policy might deter some guests, as only 5.3% of listings use it. Evaluate if potential revenue protection outweighs possible lower booking rates.
- Regularly review your cancellation policy against competitors and market demand shifts in Ararat Township.
Ararat Township STR Booking Lead Time Analysis (2026)
Average Booking Lead Time by Month
Booking Lead Time Insights for Ararat Township
- The overall average booking lead time for vacation rentals in Ararat Township is 50 days.
- Guests book furthest in advance for stays during September (average 111 days), likely coinciding with peak travel demand or local events.
- The shortest booking windows occur for stays in April (average 24 days), indicating more last-minute travel plans during this time.
- Seasonally, Fall (80 days avg.) sees the longest lead times, while Spring (29 days avg.) has the shortest, reflecting typical travel planning cycles.
Recommendations for Hosts
- Use the overall average lead time (50 days) as a baseline for your pricing and availability strategy in Ararat Township.
- For September stays, consider implementing length-of-stay discounts or slightly higher rates for bookings made less than 111 days out to capitalize on advance planning.
- Target marketing efforts for the Fall season well in advance (at least 80 days) to capture early planners.
- Monitor your own booking lead times against these Ararat Township averages to identify opportunities for dynamic pricing adjustments.
Popular & Essential Airbnb Amenities in Ararat Township (2026)
Amenity Prevalence
Amenity Insights for Ararat Township
- Essential amenities in Ararat Township that guests expect include: Free parking on premises, Dishes and silverware, Wifi, Heating. Lacking these (any) could significantly impact bookings.
- Popular amenities like Microwave, Bed linens, Essentials are common but not universal. Offering these can provide a competitive edge.
Recommendations for Hosts
- Ensure your listing includes all essential amenities for Ararat Township: Free parking on premises, Dishes and silverware, Wifi, Heating.
- Consider adding popular differentiators like Microwave or Bed linens to increase appeal.
- Highlight unique or less common amenities you offer (e.g., hot tub, dedicated workspace, EV charger) in your listing description and photos.
- Regularly check competitor amenities in Ararat Township to stay competitive.
Ararat Township Airbnb Guest Demographics & Profile Analysis (2026)
Guest Profile Summary for Ararat Township
- The typical guest profile for Airbnb in Ararat Township consists of primarily domestic travelers (96%), often arriving from nearby New York, typically belonging to the Post-2000s (Gen Z/Alpha) group (50%), primarily speaking English or Spanish.
- Domestic travelers account for 95.9% of guests.
- Key international markets include United States (95.9%) and Canada (1.2%).
- Top languages spoken are English (61.1%) followed by Spanish (20%).
- A significant demographic segment is the Post-2000s (Gen Z/Alpha) group, representing 50% of guests.
Recommendations for Hosts
- Target domestic marketing efforts towards travelers from New York and Philadelphia.
- Tailor amenities and listing descriptions to appeal to the dominant Post-2000s (Gen Z/Alpha) demographic (e.g., highlight fast WiFi, smart home features, local guides).
- Highlight unique local experiences or amenities relevant to the primary guest profile.
- Consider seasonal promotions aligned with peak travel times for key origin markets.
Nearby Short-Term Rental Market Comparison
How does the Ararat Township Airbnb market stack up against its neighbors? Compare key performance metrics like average monthly revenue, ADR, and occupancy rates in surrounding areas to understand the broader regional STR landscape.
| Market | Active Properties | Monthly Revenue | Daily Rate | Avg. Occupancy |
|---|---|---|---|---|
| Freeland | 11 | $8,436 | $684.29 | 42% |
| Berlin Township | 15 | $7,208 | $729.10 | 35% |
| Polk Township | 15 | $6,974 | $520.26 | 38% |
| Town of Kingston | 10 | $6,470 | $473.76 | 49% |
| Frankford Township | 11 | $6,329 | $505.19 | 41% |
| Spring Lake Heights | 16 | $5,785 | $725.20 | 40% |
| Stroud Township | 137 | $5,728 | $478.40 | 40% |
| Town of Monroe | 22 | $5,690 | $720.52 | 37% |
| Hilltown Township | 11 | $5,557 | $578.96 | 40% |
| Town of Torrey | 34 | $5,535 | $437.35 | 50% |