Akron Airbnb Market Analysis 2026: Short Term Rental Data & Vacation Rental Statistics in Pennsylvania, United States
Is Airbnb profitable in Akron in 2026? Explore comprehensive Airbnb analytics for Akron, Pennsylvania, United States to uncover income potential. This 2026 STR market report for Akron, based on AirROI data from February 2025 to January 2026, reveals key trends in the niche market of 20 active listings.
Whether you're considering an Airbnb investment in Akron, optimizing your existing vacation rental, or exploring rental arbitrage opportunities, understanding the Akron Airbnb data is crucial. Leveraging the low regulation environment is key to maximizing your short term rental income potential. Let's dive into the specifics.
Key Akron Airbnb Performance Metrics Overview
Monthly Airbnb Revenue Variations & Income Potential in Akron (2026)
Understanding the monthly revenue variations for Airbnb listings in Akron is key to maximizing your short term rental income potential. Seasonality significantly impacts earnings. Our analysis, based on data from the past 12 months, shows that the peak revenue month for STRs in Akron is typically December, while March often presents the lowest earnings, highlighting opportunities for strategic pricing adjustments during shoulder and low seasons. Explore the typical Airbnb income in Akron across different performance tiers:
- Best-in-class properties (Top 10%) achieve $2,352+ monthly, often utilizing dynamic pricing and superior guest experiences.
- Strong performing properties (Top 25%) earn $1,897 or more, indicating effective management and desirable locations/amenities.
- Typical properties (Median) generate around $1,126 per month, representing the average market performance.
- Entry-level properties (Bottom 25%) see earnings around $618, often with potential for optimization.
Average Monthly Airbnb Earnings Trend in Akron
Akron Airbnb Occupancy Rate Trends (2026)
Maximize your bookings by understanding the Akron STR occupancy trends. Seasonal demand shifts significantly influence how often properties are booked. Typically, Decembersees the highest demand (peak season occupancy), while March experiences the lowest (low season). Effective strategies, like adjusting minimum stays or offering promotions, can boost occupancy during slower periods. Here's how different property tiers perform in Akron:
- Best-in-class properties (Top 10%) achieve 80%+ occupancy, indicating high desirability and potentially optimized availability.
- Strong performing properties (Top 25%) maintain 64% or higher occupancy, suggesting good market fit and guest satisfaction.
- Typical properties (Median) have an occupancy rate around 34%.
- Entry-level properties (Bottom 25%) average 18% occupancy, potentially facing higher vacancy.
Average Monthly Occupancy Rate Trend in Akron
Average Daily Rate (ADR) Airbnb Trends in Akron (2026)
Effective short term rental pricing strategy in Akron involves understanding monthly ADR fluctuations. The Average Daily Rate (ADR) for Airbnb in Akron typically peaks in January and dips lowest during March. Leveraging Airbnb dynamic pricing tools or strategies based on this seasonality can significantly boost revenue. Here's a look at the typical nightly rates achieved:
- Best-in-class properties (Top 10%) command rates of $133+ per night, often due to premium features or locations.
- Strong performing properties (Top 25%) achieve nightly rates of $118 or more.
- Typical properties (Median) charge around $104 per night.
- Entry-level properties (Bottom 25%) earn around $85 per night.
Average Daily Rate (ADR) Trend by Month in Akron
Get Live Akron Market Intelligence 👇

Explore Real-time Analytics
Airbnb Seasonality Analysis & Trends in Akron (2026)
Peak Season (December, July, November)
- Revenue averages $1,682 per month
- Occupancy rates average 52.7%
- Daily rates average $108
Shoulder Season
- Revenue averages $1,285 per month
- Occupancy maintains around 41.4%
- Daily rates hold near $103
Low Season (January, March, May)
- Revenue drops to average $997 per month
- Occupancy decreases to average 35.3%
- Daily rates adjust to average $106
Seasonality Insights for Akron
- The Airbnb seasonality in Akron shows highly seasonal trends requiring careful strategy. While the sections above show seasonal averages, it's also insightful to look at the extremes:
- During the high season, the absolute peak month showcases Akron's highest earning potential, with monthly revenues capable of climbing to $1,929, occupancy reaching a high of 59.7%, and ADRs peaking at $116.
- Conversely, the slowest single month of the year, typically falling within the low season, marks the market's lowest point. In this month, revenue might dip to $968, occupancy could drop to 31.9%, and ADRs may adjust down to $99.
- Understanding both the seasonal averages and these monthly peaks and troughs in revenue, occupancy, and ADR is crucial for maximizing your Airbnb profit potential in Akron.
Seasonal Strategies for Maximizing Profit
- Peak Season: Maximize revenue through premium pricing and potentially longer minimum stays. Ensure high availability.
- Low Season: Offer competitive pricing, special promotions (e.g., extended stay discounts), and flexible cancellation policies. Target off-season travelers like remote workers or budget-conscious guests.
- Shoulder Seasons: Implement dynamic pricing that balances peak and low rates. Target weekend travelers or specific events. Offer slightly more flexible terms than peak season.
- Regularly analyze your own performance against these Akron seasonality benchmarks and adjust your pricing and availability strategy accordingly.
Best Areas for Airbnb Investment in Akron (2026)
Exploring the top neighborhoods for short-term rentals in Akron? This section highlights key areas, outlining why they are attractive for hosts and guests, along with notable local attractions. Consider these locations based on your target guest profile and investment strategy.
| Neighborhood / Area | Why Host Here? (Target Guests & Appeal) | Key Attractions & Landmarks |
|---|---|---|
| Downtown Akron | The city center with a variety of attractions, dining, and entertainment options. A prime location for visitors attending events or exploring the local culture. | Akron Art Museum, Lock 3 Park, Goodyear Theater, The Akron Civic Theatre, Perkins Park |
| Highland Square | A vibrant neighborhood known for its eclectic mix of shops, restaurants, and arts. Ideal for those seeking a lively community atmosphere with easy access to parks and entertainment. | Highland Square Theatre, Summit Lake Park, Local breweries, Art galleries, Unique boutiques |
| Kenmore | A suburban area with a family-friendly charm. Great for guests looking for a quieter, home-like experience while still being close to Akron. | Kenmore Boulevard shops, Schools, Community parks, Kenmore Community Center |
| Fairlawn | An upscale suburban area with shopping and dining amenities. Attractive for business travelers and families looking for a comfortable stay. | Fairlawn Town Centre, Shopping malls, Restaurants, Acorn Alley |
| North Hill | A diverse neighborhood with a rich cultural history. Perfect for those wanting to experience local life and heritage in Akron. | Cascade Valley Metro Park, Historic sites, Local eateries, Community events |
| Bath | A picturesque suburb with beautiful parks and natural scenery. An excellent location for nature lovers and those seeking peace and quiet. | Cuyahoga Valley National Park, Bath Nature Preserve, Local trails, Historic town center |
| University Park | Located near the University of Akron, this area attracts students, families, and visitors to campus events and activities. | The University of Akron, InfoCision Stadium, Akron Children's Museum, Parks and recreational areas |
| Montrose | An area known for its shopping and dining options, suitable for visitors looking to explore a range of retail experiences. | Montrose Shopping Park, Restaurants, Entertainment venues, Theater and cinemas |
Understanding Airbnb License Requirements & STR Laws in Akron (2026)
While Akron, Pennsylvania, United States currently shows low STR regulations, specific Airbnb license requirements might still exist or change. Always verify the latest short term rental regulations and Airbnb license requirements directly with local government authorities for Akron to ensure full compliance before hosting.
(Source: AirROI data, 2026, finding no licensed listings among those analyzed)
Top Performing Airbnb Properties in Akron (2026)
Benchmark your potential! Explore examples of top-performing Airbnb properties in Akronbased on Trailing Twelve Month (TTM) revenue. Analyze their characteristics, revenue, occupancy rate, and ADR to understand what drives success in this market.

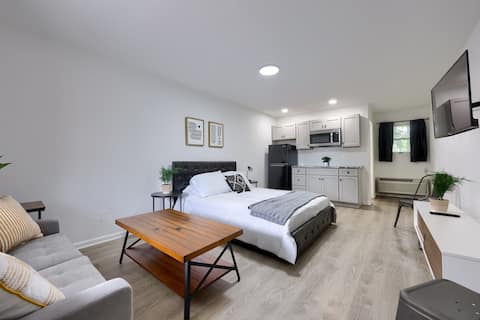
Comfy apartment in daylight basement
Entire Place • 1 bedroom

Meadowlark Cottage (previously the farmette)
Entire Place • 1 bedroom
Holly House B & B, Akron PA
Private Room • N/A
Boutique Motel in Akron
Private Room • 1 bedroom

Newly Renovated and Furnished! 2 BR House in Akron
Entire Place • 2 bedrooms

Boutique Motel in Akron
Entire Place • 1 bedroom
Note: Performance varies based on location, size, amenities, seasonality, and management quality. Data reflects the past 12 months.
Top Performing Airbnb Hosts in Akron (2026)
Learn from the best! This table showcases top-performing Airbnb hosts in Akron based on the number of properties managed and estimated total revenue over the past year. Analyze their scale and performance metrics.
| Host Name | Properties | Grossing Revenue | Stay Reviews | Avg Rating |
|---|---|---|---|---|
| Brian | 14 | $84,170 | 69 | 4.53/5.0 |
| Judy | 1 | $25,156 | 205 | 4.94/5.0 |
| Heather | 1 | $20,915 | 280 | 4.91/5.0 |
| Nancy | 1 | $19,688 | 279 | 4.89/5.0 |
| Hesham | 2 | $3,409 | 5 | 4.75/5.0 |
| Naomi | 1 | $2,318 | 56 | 4.89/5.0 |
Analyzing the strategies of top hosts, such as their property selection, pricing, and guest communication, can offer valuable lessons for optimizing your own Airbnb operations in Akron.
Dive Deeper: Advanced Akron STR Market Data (2026)
Ready to unlock more insights? AirROI provides access to advanced metrics and comprehensive Airbnb data for Akron. Explore detailed analytics beyond this report to refine your investment strategy, optimize pricing, and maximize your vacation rental profits.
Explore Advanced MetricsAkron Short-Term Rental Market Composition (2026): Property & Room Types
Room Type Distribution
Property Type Distribution
Market Composition Insights for Akron
- The Akron Airbnb market composition is heavily skewed towards Entire Home/Apt listings, which make up 80% of the 20 active rentals. This indicates strong guest preference for privacy and space.
- Looking at the property type distribution in Akron, Apartment/Condo properties are the most common (65%), reflecting the local real estate landscape.
- The presence of 15% Hotel/Boutique listings indicates integration with traditional hospitality.
Akron Airbnb Room Capacity Analysis (2026): Bedroom Distribution
Distribution of Listings by Number of Bedrooms
Room Capacity Insights for Akron
- The dominant room capacity in Akron is 1 bedroom listings, making up 80% of the market. This suggests a strong demand for properties suitable for couples or solo travelers.
- Together, 1 bedroom and 3 bedrooms properties represent 85.0% of the active Airbnb listings in Akron, indicating a high concentration in these sizes.
- With over half the market (80%) consisting of studios or 1-bedroom units, Akron is particularly well-suited for individuals or couples.
- Listings with 3+ bedrooms (5.0%) represent a smaller niche, potentially indicating an underserved market for larger group accommodations in Akron.
Akron Vacation Rental Guest Capacity Trends (2026)
Distribution of Listings by Guest Capacity
Guest Capacity Insights for Akron
- The most common guest capacity trend in Akron vacation rentals is listings accommodating 2 guests (80%). This suggests the primary traveler segment is likely couples or solo travelers.
- Properties designed for 2 guests and 6 guests dominate the Akron STR market, accounting for 90.0% of listings.
- A significant 80.0% of listings cater specifically to 1-2 guests, highlighting strong demand from couples and solo travelers in Akron.
- On average, properties in Akron are equipped to host 2.4 guests.
Akron Airbnb Booking Patterns (2026): Available vs. Booked Days
Available Days Distribution
Booked Days Distribution
Booking Pattern Insights for Akron
- The most common availability pattern in Akron falls within the 271-366 days range, representing 70% of listings. This suggests many properties have significant open periods on their calendars.
- Approximately 85.0% of listings show high availability (181+ days open annually), indicating potential for increased bookings or specific owner usage patterns.
- For booked days, the 1-30 days range is most frequent in Akron (30%), reflecting common guest stay durations or potential owner blocking patterns.
- A notable 15.0% of properties secure long booking periods (181+ days booked per year), highlighting successful long-term rental strategies or significant owner usage.
Akron Airbnb Minimum Stay Requirements Analysis
Distribution of Listings by Minimum Night Requirement
1 Night
1 listings
5% of total
2 Nights
4 listings
20% of total
3 Nights
10 listings
50% of total
4-6 Nights
2 listings
10% of total
30+ Nights
3 listings
15% of total
Key Insights
- The most prevalent minimum stay requirement in Akron is 3 Nights, adopted by 50% of listings. This highlights the market's preference for longer commitments.
- A significant segment (15%) caters to monthly stays (30+ nights) in Akron, pointing to opportunities in the extended-stay market.
Recommendations
- Align with the market by considering a 3 Nights minimum stay, as 50% of Akron hosts use this setting.
- If feasible, allowing 1-night stays, especially midweek or during low season, could capture last-minute bookings, as only 5% currently do.
- Explore offering discounts for stays of 30+ nights to attract the 15% of the market seeking extended stays.
- Adjust minimum nights based on seasonality – potentially shorter during low season and longer during peak demand periods in Akron.
Akron Airbnb Cancellation Policy Trends Analysis (2026)
Flexible
5 listings
25% of total
Moderate
3 listings
15% of total
Firm
12 listings
60% of total
Cancellation Policy Insights for Akron
- The prevailing Airbnb cancellation policy trend in Akron is Firm, used by 60% of listings.
- A majority (60.0%) of hosts in Akron utilize Firm or Strict policies, indicating a market where hosts prioritize booking security.
Recommendations for Hosts
- Consider adopting a Firm policy to align with the 60% market standard in Akron.
- Regularly review your cancellation policy against competitors and market demand shifts in Akron.
Akron STR Booking Lead Time Analysis (2026)
Average Booking Lead Time by Month
Booking Lead Time Insights for Akron
- The overall average booking lead time for vacation rentals in Akron is 12 days.
- Guests book furthest in advance for stays during October (average 62 days), likely coinciding with peak travel demand or local events.
- The shortest booking windows occur for stays in March (average 8 days), indicating more last-minute travel plans during this time.
- Seasonally, Fall (34 days avg.) sees the longest lead times, while Spring (14 days avg.) has the shortest, reflecting typical travel planning cycles.
Recommendations for Hosts
- Use the overall average lead time (12 days) as a baseline for your pricing and availability strategy in Akron.
- For October stays, consider implementing length-of-stay discounts or slightly higher rates for bookings made less than 62 days out to capitalize on advance planning.
- Target marketing efforts for the Fall season well in advance (at least 34 days) to capture early planners.
- Monitor your own booking lead times against these Akron averages to identify opportunities for dynamic pricing adjustments.
Popular & Essential Airbnb Amenities in Akron (2026)
Amenity Prevalence
Amenity Insights for Akron
- Essential amenities in Akron that guests expect include: Wifi, Smoke alarm, Carbon monoxide alarm, TV, Free parking on premises, Kitchen. Lacking these (any) could significantly impact bookings.
- Popular amenities like Fire extinguisher, Air conditioning, Washer are common but not universal. Offering these can provide a competitive edge.
Recommendations for Hosts
- Ensure your listing includes all essential amenities for Akron: Wifi, Smoke alarm, Carbon monoxide alarm, TV, Free parking on premises, Kitchen.
- Prioritize adding missing essentials: Kitchen.
- Consider adding popular differentiators like Fire extinguisher or Air conditioning to increase appeal.
- Highlight unique or less common amenities you offer (e.g., hot tub, dedicated workspace, EV charger) in your listing description and photos.
- Regularly check competitor amenities in Akron to stay competitive.
Akron Airbnb Guest Demographics & Profile Analysis (2026)
Guest Profile Summary for Akron
- The typical guest profile for Airbnb in Akron consists of primarily domestic travelers (97%), often arriving from nearby Philadelphia, typically belonging to the Post-2000s (Gen Z/Alpha) group (50%), primarily speaking English or Spanish.
- Domestic travelers account for 97.3% of guests.
- Key international markets include United States (97.3%) and Canada (2.7%).
- Top languages spoken are English (71.1%) followed by Spanish (13.2%).
- A significant demographic segment is the Post-2000s (Gen Z/Alpha) group, representing 50% of guests.
Recommendations for Hosts
- Target domestic marketing efforts towards travelers from Philadelphia and Chambersburg.
- Tailor amenities and listing descriptions to appeal to the dominant Post-2000s (Gen Z/Alpha) demographic (e.g., highlight fast WiFi, smart home features, local guides).
- Highlight unique local experiences or amenities relevant to the primary guest profile.
- Consider seasonal promotions aligned with peak travel times for key origin markets.
Nearby Short-Term Rental Market Comparison
How does the Akron Airbnb market stack up against its neighbors? Compare key performance metrics like average monthly revenue, ADR, and occupancy rates in surrounding areas to understand the broader regional STR landscape.
| Market | Active Properties | Monthly Revenue | Daily Rate | Avg. Occupancy |
|---|---|---|---|---|
| Freeland | 11 | $8,436 | $684.29 | 42% |
| Berlin Township | 15 | $7,208 | $729.10 | 35% |
| Polk Township | 15 | $6,974 | $520.26 | 38% |
| Lemont | 21 | $6,940 | $873.93 | 37% |
| College Township | 83 | $6,551 | $848.63 | 36% |
| Centreville | 17 | $6,298 | $565.66 | 45% |
| State College | 192 | $6,081 | $712.29 | 40% |
| Shannondale | 45 | $5,808 | $337.30 | 54% |
| Stroud Township | 137 | $5,728 | $478.40 | 40% |
| Hilltown Township | 11 | $5,557 | $578.96 | 40% |