West Linn Airbnb Market Analysis 2026: Short Term Rental Data & Vacation Rental Statistics in Oregon, United States
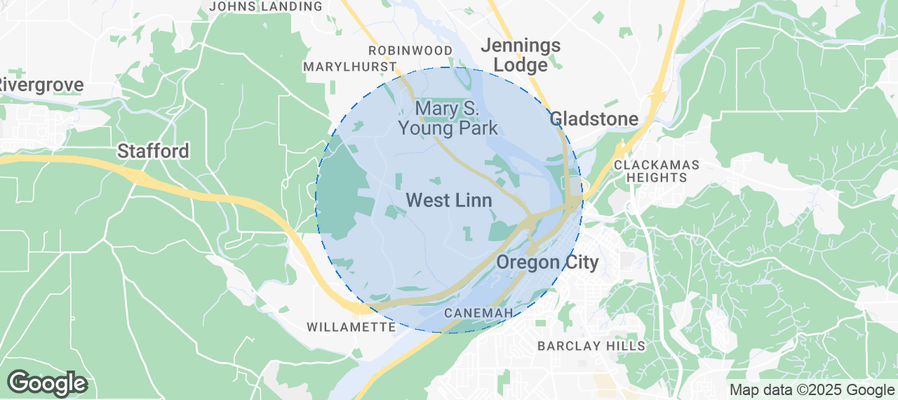
Is Airbnb profitable in West Linn in 2026? Explore comprehensive Airbnb analytics for West Linn, Oregon, United States to uncover income potential. This 2026 STR market report for West Linn, based on AirROI data from February 2025 to January 2026, reveals key trends in the niche market of 47 active listings.
Whether you're considering an Airbnb investment in West Linn, optimizing your existing vacation rental, or exploring rental arbitrage opportunities, understanding the West Linn Airbnb data is crucial. Leveraging the low regulation environment is key to maximizing your short term rental income potential. Let's dive into the specifics.
Key West Linn Airbnb Performance Metrics Overview
Monthly Airbnb Revenue Variations & Income Potential in West Linn (2026)
Understanding the monthly revenue variations for Airbnb listings in West Linn is key to maximizing your short term rental income potential. Seasonality significantly impacts earnings. Our analysis, based on data from the past 12 months, shows that the peak revenue month for STRs in West Linn is typically July, while February often presents the lowest earnings, highlighting opportunities for strategic pricing adjustments during shoulder and low seasons. Explore the typical Airbnb income in West Linn across different performance tiers:
- Best-in-class properties (Top 10%) achieve $6,339+ monthly, often utilizing dynamic pricing and superior guest experiences.
- Strong performing properties (Top 25%) earn $4,338 or more, indicating effective management and desirable locations/amenities.
- Typical properties (Median) generate around $2,764 per month, representing the average market performance.
- Entry-level properties (Bottom 25%) see earnings around $1,545, often with potential for optimization.
Average Monthly Airbnb Earnings Trend in West Linn
West Linn Airbnb Occupancy Rate Trends (2026)
Maximize your bookings by understanding the West Linn STR occupancy trends. Seasonal demand shifts significantly influence how often properties are booked. Typically, Junesees the highest demand (peak season occupancy), while January experiences the lowest (low season). Effective strategies, like adjusting minimum stays or offering promotions, can boost occupancy during slower periods. Here's how different property tiers perform in West Linn:
- Best-in-class properties (Top 10%) achieve 85%+ occupancy, indicating high desirability and potentially optimized availability.
- Strong performing properties (Top 25%) maintain 70% or higher occupancy, suggesting good market fit and guest satisfaction.
- Typical properties (Median) have an occupancy rate around 47%.
- Entry-level properties (Bottom 25%) average 24% occupancy, potentially facing higher vacancy.
Average Monthly Occupancy Rate Trend in West Linn
Average Daily Rate (ADR) Airbnb Trends in West Linn (2026)
Effective short term rental pricing strategy in West Linn involves understanding monthly ADR fluctuations. The Average Daily Rate (ADR) for Airbnb in West Linn typically peaks in December and dips lowest during April. Leveraging Airbnb dynamic pricing tools or strategies based on this seasonality can significantly boost revenue. Here's a look at the typical nightly rates achieved:
- Best-in-class properties (Top 10%) command rates of $424+ per night, often due to premium features or locations.
- Strong performing properties (Top 25%) achieve nightly rates of $276 or more.
- Typical properties (Median) charge around $181 per night.
- Entry-level properties (Bottom 25%) earn around $126 per night.
Average Daily Rate (ADR) Trend by Month in West Linn
Get Live West Linn Market Intelligence 👇
Explore Real-time Analytics
Airbnb Seasonality Analysis & Trends in West Linn (2026)
Peak Season (July, August, June)
- Revenue averages $4,404 per month
- Occupancy rates average 58.5%
- Daily rates average $219
Shoulder Season
- Revenue averages $3,314 per month
- Occupancy maintains around 48.1%
- Daily rates hold near $239
Low Season (January, February, March)
- Revenue drops to average $2,038 per month
- Occupancy decreases to average 41.1%
- Daily rates adjust to average $213
Seasonality Insights for West Linn
- The Airbnb seasonality in West Linn shows highly seasonal trends requiring careful strategy. While the sections above show seasonal averages, it's also insightful to look at the extremes:
- During the high season, the absolute peak month showcases West Linn's highest earning potential, with monthly revenues capable of climbing to $4,644, occupancy reaching a high of 61.6%, and ADRs peaking at $268.
- Conversely, the slowest single month of the year, typically falling within the low season, marks the market's lowest point. In this month, revenue might dip to $1,801, occupancy could drop to 38.1%, and ADRs may adjust down to $191.
- Understanding both the seasonal averages and these monthly peaks and troughs in revenue, occupancy, and ADR is crucial for maximizing your Airbnb profit potential in West Linn.
Seasonal Strategies for Maximizing Profit
- Peak Season: Maximize revenue through premium pricing and potentially longer minimum stays. Ensure high availability.
- Low Season: Offer competitive pricing, special promotions (e.g., extended stay discounts), and flexible cancellation policies. Target off-season travelers like remote workers or budget-conscious guests.
- Shoulder Seasons: Implement dynamic pricing that balances peak and low rates. Target weekend travelers or specific events. Offer slightly more flexible terms than peak season.
- Regularly analyze your own performance against these West Linn seasonality benchmarks and adjust your pricing and availability strategy accordingly.
Best Areas for Airbnb Investment in West Linn (2026)
Exploring the top neighborhoods for short-term rentals in West Linn? This section highlights key areas, outlining why they are attractive for hosts and guests, along with notable local attractions. Consider these locations based on your target guest profile and investment strategy.
| Neighborhood / Area | Why Host Here? (Target Guests & Appeal) | Key Attractions & Landmarks |
|---|---|---|
| Willamette Falls | A historical and scenic waterfall area attracting nature lovers and those interested in local history. Makes for a picturesque stay with outdoor activities nearby. | Willamette Falls, Oregon City Arch Bridge, End of the Oregon Trail Interpretive Center, Clackamas County Historical Society Museum, McLoughlin House |
| Downtown West Linn | The heart of West Linn with a charming small-town feel, close to shops and restaurants. Ideal for visitors wanting to experience local culture and community. | West Linn Historic Registry, Mary S. Young Park, Shopping at local boutiques, Parks and recreational areas, Riverview Cemetery |
| Tualatin River | Beautiful riverside area perfect for outdoor enthusiasts, offering access to trails and parks. Great for visitors seeking active lifestyles. | Tualatin River National Wildlife Refuge, Tualatin Community Park, Kayaking and fishing opportunities, Nature trails, Wildlife viewing |
| West Linn Park | Family-friendly parks that offer a peaceful retreat and recreational activities. Attracts families and groups looking for outdoor fun. | West Linn City Park, Playgrounds and sports facilities, Scenic picnic areas, Community events, Walking and biking trails |
| Sunnyside | A suburban area that combines convenience with access to nature. Ideal for families visiting the area and looking for a comfortable stay. | Nearby shopping centers, Sunnyside Nature Park, Local restaurants and cafes, Access to main highways, Family-oriented activities |
| King City | A neighboring community that offers a quiet, residential feel. Great for travelers looking for a peaceful environment close to urban amenities. | King City Parks, Walking paths, Community events, Local farmers markets, Quiet residential areas |
| Oakhurst | A serene area that offers natural beauty and a laid-back atmosphere, appealing to visitors looking for a relaxing getaway. | Oakhurst Park, Nature trails, Scenic views, Outdoor recreation, Picnic areas |
| Lake Oswego | Nearby Lake Oswego is a luxurious area that boasts beautiful waterfront views and high-end amenities, attracting affluent travelers. | Lake Oswego waterfront, Local shops and restaurants, Lewis and Clark State Recreation Site, Lake Oswego Golf Course, Art galleries and cultural events |
Understanding Airbnb License Requirements & STR Laws in West Linn (2026)
While West Linn, Oregon, United States currently shows low STR regulations, specific Airbnb license requirements might still exist or change. Always verify the latest short term rental regulations and Airbnb license requirements directly with local government authorities for West Linn to ensure full compliance before hosting.
(Source: AirROI data, 2026, finding no licensed listings among those analyzed)
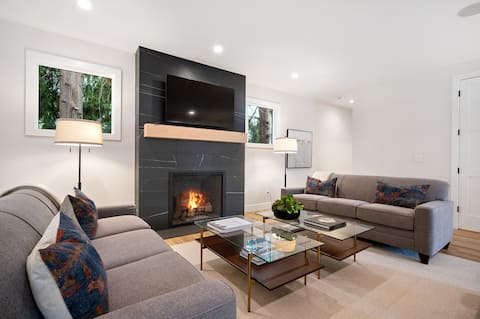
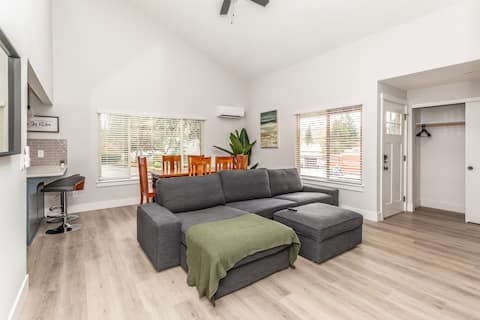
Top Performing Airbnb Properties in West Linn (2026)
Benchmark your potential! Explore examples of top-performing Airbnb properties in West Linnbased on Trailing Twelve Month (TTM) revenue. Analyze their characteristics, revenue, occupancy rate, and ADR to understand what drives success in this market.

Charming Retreat, Game Rooms, Pool Table, Foosball
Entire Place • 6 bedrooms
Luxury 4BR Retreat with Hot Tub & Sauna, Walkable
Entire Place • 4 bedrooms

Modern Lux Duplex Cozy 6bd Oasis
Entire Place • 6 bedrooms

Renovated Retreat, Gorgeous Huge Deck, Ping Pong
Entire Place • 4 bedrooms
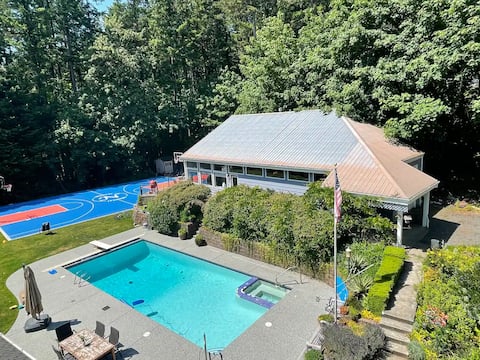
Poolside Retreat with Hot Tub, Sports Court & Pets
Entire Place • 3 bedrooms
Cozy Modern Family 3Bd Oasis
Entire Place • 3 bedrooms
Note: Performance varies based on location, size, amenities, seasonality, and management quality. Data reflects the past 12 months.
Top Performing Airbnb Hosts in West Linn (2026)
Learn from the best! This table showcases top-performing Airbnb hosts in West Linn based on the number of properties managed and estimated total revenue over the past year. Analyze their scale and performance metrics.
| Host Name | Properties | Grossing Revenue | Stay Reviews | Avg Rating |
|---|---|---|---|---|
| Oasis | 6 | $293,828 | 376 | 4.72/5.0 |
| ITrip Vacations | 3 | $199,964 | 105 | 4.67/5.0 |
| Donald | 2 | $133,753 | 50 | 4.94/5.0 |
| Sarah | 1 | $62,507 | 27 | 4.96/5.0 |
| Rácháel | 3 | $49,762 | 290 | 4.85/5.0 |
| Dustin | 1 | $49,479 | 125 | 4.97/5.0 |
| Minh | 1 | $42,184 | 17 | 5.00/5.0 |
| Don | 1 | $40,350 | 17 | 5.00/5.0 |
| Danzengduoji | 1 | $39,415 | 73 | 4.88/5.0 |
| Kristy | 1 | $39,209 | 256 | 5.00/5.0 |
Analyzing the strategies of top hosts, such as their property selection, pricing, and guest communication, can offer valuable lessons for optimizing your own Airbnb operations in West Linn.
Dive Deeper: Advanced West Linn STR Market Data (2026)
Ready to unlock more insights? AirROI provides access to advanced metrics and comprehensive Airbnb data for West Linn. Explore detailed analytics beyond this report to refine your investment strategy, optimize pricing, and maximize your vacation rental profits.
Explore Advanced MetricsWest Linn Short-Term Rental Market Composition (2026): Property & Room Types
Room Type Distribution
Property Type Distribution
Market Composition Insights for West Linn
- The West Linn Airbnb market composition is heavily skewed towards Entire Home/Apt listings, which make up 100% of the 47 active rentals. This indicates strong guest preference for privacy and space.
- Looking at the property type distribution in West Linn, House properties are the most common (53.2%), reflecting the local real estate landscape.
- Houses represent a significant 53.2% portion, catering likely to families or larger groups.
- The presence of 10.6% Hotel/Boutique listings indicates integration with traditional hospitality.
- Smaller segments like outdoor/unique (combined 2.1%) offer potential for unique stay experiences.
West Linn Airbnb Room Capacity Analysis (2026): Bedroom Distribution
Distribution of Listings by Number of Bedrooms
Room Capacity Insights for West Linn
- The dominant room capacity in West Linn is 3 bedrooms listings, making up 23.4% of the market. This suggests a strong demand for properties suitable for families or small groups.
- Together, 3 bedrooms and 1 bedroom properties represent 46.8% of the active Airbnb listings in West Linn, indicating a high concentration in these sizes.
- A significant 44.6% of listings offer 3+ bedrooms, catering to larger groups and families seeking more space in West Linn.
West Linn Vacation Rental Guest Capacity Trends (2026)
Distribution of Listings by Guest Capacity
Guest Capacity Insights for West Linn
- The most common guest capacity trend in West Linn vacation rentals is listings accommodating 4 guests (23.4%). This suggests the primary traveler segment is likely small families or groups.
- Properties designed for 4 guests and 8+ guests dominate the West Linn STR market, accounting for 46.8% of listings.
- 53.2% of properties accommodate 6+ guests, serving the market segment for larger families or group travel in West Linn.
- On average, properties in West Linn are equipped to host 5.3 guests.
West Linn Airbnb Booking Patterns (2026): Available vs. Booked Days
Available Days Distribution
Booked Days Distribution
Booking Pattern Insights for West Linn
- The most common availability pattern in West Linn falls within the 181-270 days range, representing 38.3% of listings. This suggests many properties have significant open periods on their calendars.
- Approximately 70.2% of listings show high availability (181+ days open annually), indicating potential for increased bookings or specific owner usage patterns.
- For booked days, the 91-180 days range is most frequent in West Linn (38.3%), reflecting common guest stay durations or potential owner blocking patterns.
- A notable 29.8% of properties secure long booking periods (181+ days booked per year), highlighting successful long-term rental strategies or significant owner usage.
West Linn Airbnb Minimum Stay Requirements Analysis
Distribution of Listings by Minimum Night Requirement
1 Night
10 listings
21.3% of total
2 Nights
12 listings
25.5% of total
3 Nights
5 listings
10.6% of total
4-6 Nights
3 listings
6.4% of total
7-29 Nights
2 listings
4.3% of total
30+ Nights
15 listings
31.9% of total
Key Insights
- The most prevalent minimum stay requirement in West Linn is 30+ Nights, adopted by 31.9% of listings. This highlights the market's preference for longer commitments.
- A significant segment (31.9%) caters to monthly stays (30+ nights) in West Linn, pointing to opportunities in the extended-stay market.
Recommendations
- Align with the market by considering a 30+ Nights minimum stay, as 31.9% of West Linn hosts use this setting.
- If feasible, allowing 1-night stays, especially midweek or during low season, could capture last-minute bookings, as only 21.3% currently do.
- Explore offering discounts for stays of 30+ nights to attract the 31.9% of the market seeking extended stays.
- Adjust minimum nights based on seasonality – potentially shorter during low season and longer during peak demand periods in West Linn.
West Linn Airbnb Cancellation Policy Trends Analysis (2026)
Flexible
9 listings
19.1% of total
Moderate
14 listings
29.8% of total
Firm
17 listings
36.2% of total
Strict
7 listings
14.9% of total
Cancellation Policy Insights for West Linn
- The prevailing Airbnb cancellation policy trend in West Linn is Firm, used by 36.2% of listings.
- A majority (51.1%) of hosts in West Linn utilize Firm or Strict policies, indicating a market where hosts prioritize booking security.
Recommendations for Hosts
- Consider adopting a Firm policy to align with the 36.2% market standard in West Linn.
- Using a Strict policy might deter some guests, as only 14.9% of listings use it. Evaluate if potential revenue protection outweighs possible lower booking rates.
- Regularly review your cancellation policy against competitors and market demand shifts in West Linn.
West Linn STR Booking Lead Time Analysis (2026)
Average Booking Lead Time by Month
Booking Lead Time Insights for West Linn
- The overall average booking lead time for vacation rentals in West Linn is 42 days.
- Guests book furthest in advance for stays during August (average 64 days), likely coinciding with peak travel demand or local events.
- The shortest booking windows occur for stays in January (average 17 days), indicating more last-minute travel plans during this time.
- Seasonally, Summer (57 days avg.) sees the longest lead times, while Winter (26 days avg.) has the shortest, reflecting typical travel planning cycles.
Recommendations for Hosts
- Use the overall average lead time (42 days) as a baseline for your pricing and availability strategy in West Linn.
- For August stays, consider implementing length-of-stay discounts or slightly higher rates for bookings made less than 64 days out to capitalize on advance planning.
- Target marketing efforts for the Summer season well in advance (at least 57 days) to capture early planners.
- Monitor your own booking lead times against these West Linn averages to identify opportunities for dynamic pricing adjustments.
Popular & Essential Airbnb Amenities in West Linn (2026)
Amenity Prevalence
Amenity Insights for West Linn
- Essential amenities in West Linn that guests expect include: Wifi, Heating, TV, Smoke alarm, Hot water. Lacking these (any) could significantly impact bookings.
- Popular amenities like Coffee maker, Hangers, Free parking on premises are common but not universal. Offering these can provide a competitive edge.
Recommendations for Hosts
- Ensure your listing includes all essential amenities for West Linn: Wifi, Heating, TV, Smoke alarm, Hot water.
- Prioritize adding missing essentials: TV, Smoke alarm, Hot water.
- Consider adding popular differentiators like Coffee maker or Hangers to increase appeal.
- Highlight unique or less common amenities you offer (e.g., hot tub, dedicated workspace, EV charger) in your listing description and photos.
- Regularly check competitor amenities in West Linn to stay competitive.
West Linn Airbnb Guest Demographics & Profile Analysis (2026)
Guest Profile Summary for West Linn
- The typical guest profile for Airbnb in West Linn consists of primarily domestic travelers (94%), often arriving from nearby Seattle, typically belonging to the Post-2000s (Gen Z/Alpha) group (50%), primarily speaking English or Spanish.
- Domestic travelers account for 94.1% of guests.
- Key international markets include United States (94.1%) and Canada (1.5%).
- Top languages spoken are English (69.2%) followed by Spanish (14.1%).
- A significant demographic segment is the Post-2000s (Gen Z/Alpha) group, representing 50% of guests.
Recommendations for Hosts
- Target domestic marketing efforts towards travelers from Seattle and Portland.
- Tailor amenities and listing descriptions to appeal to the dominant Post-2000s (Gen Z/Alpha) demographic (e.g., highlight fast WiFi, smart home features, local guides).
- Highlight unique local experiences or amenities relevant to the primary guest profile.
- Consider seasonal promotions aligned with peak travel times for key origin markets.
Nearby Short-Term Rental Market Comparison
How does the West Linn Airbnb market stack up against its neighbors? Compare key performance metrics like average monthly revenue, ADR, and occupancy rates in surrounding areas to understand the broader regional STR landscape.
| Market | Active Properties | Monthly Revenue | Daily Rate | Avg. Occupancy |
|---|---|---|---|---|
| Arch Cape | 78 | $7,909 | $512.29 | 53% |
| Manzanita | 288 | $5,262 | $395.19 | 43% |
| Cannon Beach | 226 | $5,178 | $436.27 | 46% |
| Dundee | 71 | $4,771 | $426.97 | 35% |
| Warrenton | 60 | $4,241 | $385.97 | 43% |
| Nehalem | 100 | $4,215 | $369.69 | 42% |
| Cloverdale | 77 | $4,140 | $360.93 | 44% |
| Mount Hood Village | 80 | $4,076 | $327.33 | 43% |
| Clackamas County | 19 | $3,781 | $324.73 | 45% |
| Oceanside | 128 | $3,764 | $321.25 | 42% |