Warrenton Airbnb Market Analysis 2026: Short Term Rental Data & Vacation Rental Statistics in Oregon, United States
Is Airbnb profitable in Warrenton in 2026? Explore comprehensive Airbnb analytics for Warrenton, Oregon, United States to uncover income potential. This 2026 STR market report for Warrenton, based on AirROI data from February 2025 to January 2026, reveals key trends in the niche market of 60 active listings.
Whether you're considering an Airbnb investment in Warrenton, optimizing your existing vacation rental, or exploring rental arbitrage opportunities, understanding the Warrenton Airbnb data is crucial. Leveraging the low regulation environment is key to maximizing your short term rental income potential. Let's dive into the specifics.
Key Warrenton Airbnb Performance Metrics Overview
Monthly Airbnb Revenue Variations & Income Potential in Warrenton (2026)
Understanding the monthly revenue variations for Airbnb listings in Warrenton is key to maximizing your short term rental income potential. Seasonality significantly impacts earnings. Our analysis, based on data from the past 12 months, shows that the peak revenue month for STRs in Warrenton is typically August, while February often presents the lowest earnings, highlighting opportunities for strategic pricing adjustments during shoulder and low seasons. Explore the typical Airbnb income in Warrenton across different performance tiers:
- Best-in-class properties (Top 10%) achieve $11,624+ monthly, often utilizing dynamic pricing and superior guest experiences.
- Strong performing properties (Top 25%) earn $6,913 or more, indicating effective management and desirable locations/amenities.
- Typical properties (Median) generate around $4,181 per month, representing the average market performance.
- Entry-level properties (Bottom 25%) see earnings around $2,123, often with potential for optimization.
Average Monthly Airbnb Earnings Trend in Warrenton
Warrenton Airbnb Occupancy Rate Trends (2026)
Maximize your bookings by understanding the Warrenton STR occupancy trends. Seasonal demand shifts significantly influence how often properties are booked. Typically, Augustsees the highest demand (peak season occupancy), while February experiences the lowest (low season). Effective strategies, like adjusting minimum stays or offering promotions, can boost occupancy during slower periods. Here's how different property tiers perform in Warrenton:
- Best-in-class properties (Top 10%) achieve 82%+ occupancy, indicating high desirability and potentially optimized availability.
- Strong performing properties (Top 25%) maintain 63% or higher occupancy, suggesting good market fit and guest satisfaction.
- Typical properties (Median) have an occupancy rate around 44%.
- Entry-level properties (Bottom 25%) average 22% occupancy, potentially facing higher vacancy.
Average Monthly Occupancy Rate Trend in Warrenton
Average Daily Rate (ADR) Airbnb Trends in Warrenton (2026)
Effective short term rental pricing strategy in Warrenton involves understanding monthly ADR fluctuations. The Average Daily Rate (ADR) for Airbnb in Warrenton typically peaks in July and dips lowest during February. Leveraging Airbnb dynamic pricing tools or strategies based on this seasonality can significantly boost revenue. Here's a look at the typical nightly rates achieved:
- Best-in-class properties (Top 10%) command rates of $696+ per night, often due to premium features or locations.
- Strong performing properties (Top 25%) achieve nightly rates of $489 or more.
- Typical properties (Median) charge around $316 per night.
- Entry-level properties (Bottom 25%) earn around $211 per night.
Average Daily Rate (ADR) Trend by Month in Warrenton
Get Live Warrenton Market Intelligence 👇

Explore Real-time Analytics
Airbnb Seasonality Analysis & Trends in Warrenton (2026)
Peak Season (August, July, June)
- Revenue averages $8,595 per month
- Occupancy rates average 60.2%
- Daily rates average $436
Shoulder Season
- Revenue averages $4,649 per month
- Occupancy maintains around 42.0%
- Daily rates hold near $353
Low Season (January, February, March)
- Revenue drops to average $3,304 per month
- Occupancy decreases to average 35.1%
- Daily rates adjust to average $324
Seasonality Insights for Warrenton
- The Airbnb seasonality in Warrenton shows highly seasonal trends requiring careful strategy. While the sections above show seasonal averages, it's also insightful to look at the extremes:
- During the high season, the absolute peak month showcases Warrenton's highest earning potential, with monthly revenues capable of climbing to $9,944, occupancy reaching a high of 66.0%, and ADRs peaking at $456.
- Conversely, the slowest single month of the year, typically falling within the low season, marks the market's lowest point. In this month, revenue might dip to $2,593, occupancy could drop to 33.0%, and ADRs may adjust down to $312.
- Understanding both the seasonal averages and these monthly peaks and troughs in revenue, occupancy, and ADR is crucial for maximizing your Airbnb profit potential in Warrenton.
Seasonal Strategies for Maximizing Profit
- Peak Season: Maximize revenue through premium pricing and potentially longer minimum stays. Ensure high availability.
- Low Season: Offer competitive pricing, special promotions (e.g., extended stay discounts), and flexible cancellation policies. Target off-season travelers like remote workers or budget-conscious guests.
- Shoulder Seasons: Implement dynamic pricing that balances peak and low rates. Target weekend travelers or specific events. Offer slightly more flexible terms than peak season.
- Regularly analyze your own performance against these Warrenton seasonality benchmarks and adjust your pricing and availability strategy accordingly.
Best Areas for Airbnb Investment in Warrenton (2026)
Exploring the top neighborhoods for short-term rentals in Warrenton? This section highlights key areas, outlining why they are attractive for hosts and guests, along with notable local attractions. Consider these locations based on your target guest profile and investment strategy.
| Neighborhood / Area | Why Host Here? (Target Guests & Appeal) | Key Attractions & Landmarks |
|---|---|---|
| Warrenton Waterfront | Scenic views and proximity to the Columbia River. Ideal for guests wanting to enjoy fishing, boating, and the tranquility of nature. | Warrenton Marina, Dunes National Recreation Area, Columbia River, Fort Stevens State Park, Nearby Astoria |
| Gearhart | Quaint coastal town known for its relaxed atmosphere and beautiful sandy beaches. Attractive for families and couples looking for a peaceful getaway. | Gearhart Beach, Gearhart Golf Links, Warrenton State Park, Surf Pines, Pacific Way Bakery and Cafe |
| Seaside | Bustling oceanfront destination renowned for its boardwalk and family-friendly attractions. Great for tourists looking for activities and entertainment. | Seaside Aquarium, Promenade in Seaside, Turnaround at the beach, Seaside Carousel Mall, Tillamook Head |
| Astoria | Historic town with rich maritime history and vibrant arts scene. Draws tourists interested in culture, dining, and coastal experiences. | Astoria Column, Columbia River Maritime Museum, Historic Downtown Astoria, Oregon Film Museum, Riverwalk |
| Fort Stevens State Park | Popular camping and recreation area with rich history and gorgeous landscapes. Attracts nature lovers and outdoor enthusiasts. | Fort Stevens, Beaches, Campgrounds, Historic Battery Russell, Wildlife viewing |
| Clatsop County | Larger county area that encompasses beaches, forests, and historic sites. Offers diverse activities for various interests. | Ecola State Park, Lewis and Clark National Historical Park, Coastal hiking trails, Indian Beach, Haystack Rock |
| Cannon Beach | Famous for its stunning beaches and iconic Haystack Rock. Popular with tourists seeking picturesque view and relaxation. | Haystack Rock, Ecola State Park, Cannon Beach Museum, Cannon Beach Arts Association, Coastal Walking Paths |
| Nehalem Bay State Park | Scenic park offering beautiful views of the bay and access to outdoor recreation. Great for visitors who enjoy camping and wildlife. | Nehalem Bay, Camping and hiking, Bird watching, Beach access, Kayaking |
Understanding Airbnb License Requirements & STR Laws in Warrenton (2026)
While Warrenton, Oregon, United States currently shows low STR regulations, specific Airbnb license requirements might still exist or change. Always verify the latest short term rental regulations and Airbnb license requirements directly with local government authorities for Warrenton to ensure full compliance before hosting.
(Source: AirROI data, 2026, based on 2% licensed listings)
Top Performing Airbnb Properties in Warrenton (2026)
Benchmark your potential! Explore examples of top-performing Airbnb properties in Warrentonbased on Trailing Twelve Month (TTM) revenue. Analyze their characteristics, revenue, occupancy rate, and ADR to understand what drives success in this market.
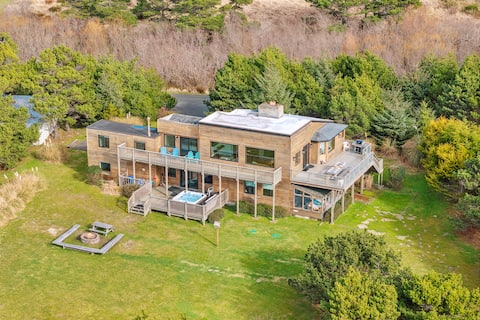
4-Acre BEACH Farmhouse: Hot Tub/Firepit/Slp 12
Entire Place • 4 bedrooms
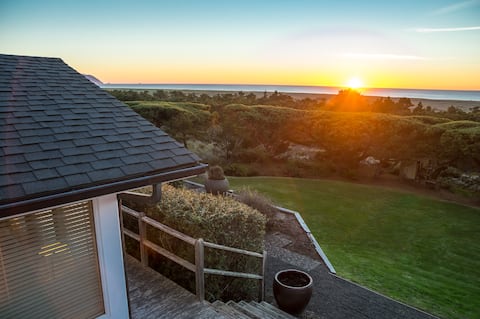
Bliss:}A+Views~HotTub~FirePit~PingPong~Bike~DogOK
Entire Place • 4 bedrooms
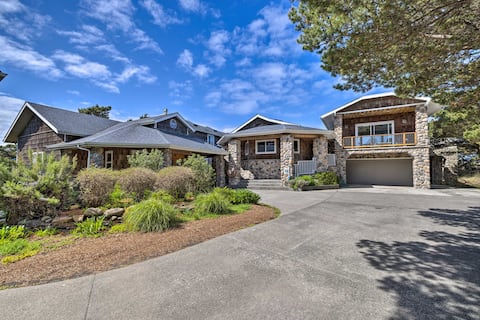
Coastal Oregon Retreat w/ Grill: 11 Mi to Astoria!
Entire Place • 6 bedrooms

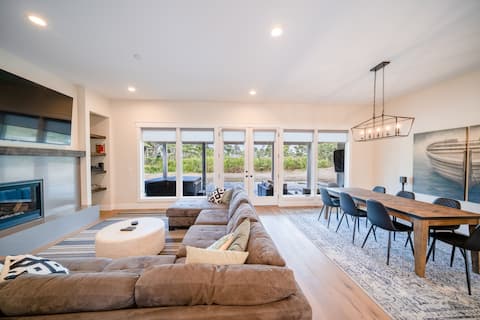
HOT TUB, Watch Cargo Ships, Rec room, River/Ocean.
Entire Place • 4 bedrooms
Gearhart Getaway: Hot Tub + Walk to the Beach
Entire Place • 4 bedrooms
Private Gated Community of Surfpines
Entire Place • 5 bedrooms
Note: Performance varies based on location, size, amenities, seasonality, and management quality. Data reflects the past 12 months.
Top Performing Airbnb Hosts in Warrenton (2026)
Learn from the best! This table showcases top-performing Airbnb hosts in Warrenton based on the number of properties managed and estimated total revenue over the past year. Analyze their scale and performance metrics.
| Host Name | Properties | Grossing Revenue | Stay Reviews | Avg Rating |
|---|---|---|---|---|
| Evolve | 9 | $491,359 | 190 | 4.75/5.0 |
| Jennifer | 1 | $206,824 | 149 | 4.95/5.0 |
| Malia | 1 | $182,756 | 289 | 4.97/5.0 |
| Erin | 2 | $135,313 | 56 | 4.83/5.0 |
| Jack And Mary | 1 | $121,050 | 38 | 4.97/5.0 |
| Cascadia Getaways | 1 | $116,583 | 116 | 4.91/5.0 |
| Oregon Beach Vacations | 1 | $113,321 | 10 | 4.40/5.0 |
| Monica | 2 | $109,699 | 898 | 4.96/5.0 |
| Angie | 1 | $108,136 | 296 | 4.97/5.0 |
| Ronald Paul | 1 | $104,299 | 113 | 4.97/5.0 |
Analyzing the strategies of top hosts, such as their property selection, pricing, and guest communication, can offer valuable lessons for optimizing your own Airbnb operations in Warrenton.
Dive Deeper: Advanced Warrenton STR Market Data (2026)
Ready to unlock more insights? AirROI provides access to advanced metrics and comprehensive Airbnb data for Warrenton. Explore detailed analytics beyond this report to refine your investment strategy, optimize pricing, and maximize your vacation rental profits.
Explore Advanced MetricsWarrenton Short-Term Rental Market Composition (2026): Property & Room Types
Room Type Distribution
Property Type Distribution
Market Composition Insights for Warrenton
- The Warrenton Airbnb market composition is heavily skewed towards Entire Home/Apt listings, which make up 90% of the 60 active rentals. This indicates strong guest preference for privacy and space.
- Looking at the property type distribution in Warrenton, House properties are the most common (81.7%), reflecting the local real estate landscape.
- Houses represent a significant 81.7% portion, catering likely to families or larger groups.
- The presence of 11.7% Hotel/Boutique listings indicates integration with traditional hospitality.
- Smaller segments like apartment/condo, others (combined 6.6%) offer potential for unique stay experiences.
Warrenton Airbnb Room Capacity Analysis (2026): Bedroom Distribution
Distribution of Listings by Number of Bedrooms
Room Capacity Insights for Warrenton
- The dominant room capacity in Warrenton is 3 bedrooms listings, making up 28.3% of the market. This suggests a strong demand for properties suitable for families or small groups.
- Together, 3 bedrooms and 4 bedrooms properties represent 55.0% of the active Airbnb listings in Warrenton, indicating a high concentration in these sizes.
- A significant 61.7% of listings offer 3+ bedrooms, catering to larger groups and families seeking more space in Warrenton.
Warrenton Vacation Rental Guest Capacity Trends (2026)
Distribution of Listings by Guest Capacity
Guest Capacity Insights for Warrenton
- The most common guest capacity trend in Warrenton vacation rentals is listings accommodating 8+ guests (46.7%). This suggests the primary traveler segment is likely larger groups.
- Properties designed for 8+ guests and 6 guests dominate the Warrenton STR market, accounting for 75.0% of listings.
- 76.7% of properties accommodate 6+ guests, serving the market segment for larger families or group travel in Warrenton.
- On average, properties in Warrenton are equipped to host 6.3 guests.
Warrenton Airbnb Booking Patterns (2026): Available vs. Booked Days
Available Days Distribution
Booked Days Distribution
Booking Pattern Insights for Warrenton
- The most common availability pattern in Warrenton falls within the 271-366 days range, representing 41.7% of listings. This suggests many properties have significant open periods on their calendars.
- Approximately 73.4% of listings show high availability (181+ days open annually), indicating potential for increased bookings or specific owner usage patterns.
- For booked days, the 91-180 days range is most frequent in Warrenton (33.3%), reflecting common guest stay durations or potential owner blocking patterns.
- A notable 30.0% of properties secure long booking periods (181+ days booked per year), highlighting successful long-term rental strategies or significant owner usage.
Warrenton Airbnb Minimum Stay Requirements Analysis
Distribution of Listings by Minimum Night Requirement
1 Night
6 listings
10% of total
2 Nights
23 listings
38.3% of total
3 Nights
1 listings
1.7% of total
4-6 Nights
2 listings
3.3% of total
7-29 Nights
1 listings
1.7% of total
30+ Nights
27 listings
45% of total
Key Insights
- The most prevalent minimum stay requirement in Warrenton is 30+ Nights, adopted by 45% of listings. This highlights the market's preference for longer commitments.
- A significant segment (45%) caters to monthly stays (30+ nights) in Warrenton, pointing to opportunities in the extended-stay market.
Recommendations
- Align with the market by considering a 30+ Nights minimum stay, as 45% of Warrenton hosts use this setting.
- If feasible, allowing 1-night stays, especially midweek or during low season, could capture last-minute bookings, as only 10% currently do.
- A 2-night minimum appears standard (38.3%). Consider this for weekends or peak periods.
- Explore offering discounts for stays of 30+ nights to attract the 45% of the market seeking extended stays.
- Adjust minimum nights based on seasonality – potentially shorter during low season and longer during peak demand periods in Warrenton.
Warrenton Airbnb Cancellation Policy Trends Analysis (2026)
Super Strict 60 Days
1 listings
1.7% of total
Super Strict 30 Days
8 listings
13.3% of total
Limited
1 listings
1.7% of total
Flexible
3 listings
5% of total
Moderate
14 listings
23.3% of total
Firm
18 listings
30% of total
Strict
15 listings
25% of total
Cancellation Policy Insights for Warrenton
- The prevailing Airbnb cancellation policy trend in Warrenton is Firm, used by 30% of listings.
- A majority (55.0%) of hosts in Warrenton utilize Firm or Strict policies, indicating a market where hosts prioritize booking security.
Recommendations for Hosts
- Consider adopting a Firm policy to align with the 30% market standard in Warrenton.
- Regularly review your cancellation policy against competitors and market demand shifts in Warrenton.
Warrenton STR Booking Lead Time Analysis (2026)
Average Booking Lead Time by Month
Booking Lead Time Insights for Warrenton
- The overall average booking lead time for vacation rentals in Warrenton is 64 days.
- Guests book furthest in advance for stays during August (average 97 days), likely coinciding with peak travel demand or local events.
- The shortest booking windows occur for stays in January (average 26 days), indicating more last-minute travel plans during this time.
- Seasonally, Summer (79 days avg.) sees the longest lead times, while Winter (39 days avg.) has the shortest, reflecting typical travel planning cycles.
Recommendations for Hosts
- Use the overall average lead time (64 days) as a baseline for your pricing and availability strategy in Warrenton.
- For August stays, consider implementing length-of-stay discounts or slightly higher rates for bookings made less than 97 days out to capitalize on advance planning.
- Target marketing efforts for the Summer season well in advance (at least 79 days) to capture early planners.
- Monitor your own booking lead times against these Warrenton averages to identify opportunities for dynamic pricing adjustments.
Popular & Essential Airbnb Amenities in Warrenton (2026)
Amenity Prevalence
Amenity Insights for Warrenton
- Essential amenities in Warrenton that guests expect include: Smoke alarm, Free parking on premises, Heating, Wifi, Essentials, Carbon monoxide alarm, Coffee maker, Microwave, TV. Lacking these (any) could significantly impact bookings.
- Popular amenities like Hangers are common but not universal. Offering these can provide a competitive edge.
Recommendations for Hosts
- Ensure your listing includes all essential amenities for Warrenton: Smoke alarm, Free parking on premises, Heating, Wifi, Essentials, Carbon monoxide alarm, Coffee maker, Microwave, TV.
- Prioritize adding missing essentials: Wifi, Essentials, Carbon monoxide alarm, Coffee maker, Microwave, TV.
- Consider adding popular differentiators like Hangers to increase appeal.
- Highlight unique or less common amenities you offer (e.g., hot tub, dedicated workspace, EV charger) in your listing description and photos.
- Regularly check competitor amenities in Warrenton to stay competitive.
Warrenton Airbnb Guest Demographics & Profile Analysis (2026)
Guest Profile Summary for Warrenton
- The typical guest profile for Airbnb in Warrenton consists of primarily domestic travelers (98%), often arriving from nearby Portland, typically belonging to the Post-2000s (Gen Z/Alpha) group (50%), primarily speaking English or Spanish.
- Domestic travelers account for 97.6% of guests.
- Key international markets include United States (97.6%) and Canada (1.4%).
- Top languages spoken are English (78.5%) followed by Spanish (12.2%).
- A significant demographic segment is the Post-2000s (Gen Z/Alpha) group, representing 50% of guests.
Recommendations for Hosts
- Target domestic marketing efforts towards travelers from Portland and Seattle.
- Tailor amenities and listing descriptions to appeal to the dominant Post-2000s (Gen Z/Alpha) demographic (e.g., highlight fast WiFi, smart home features, local guides).
- Highlight unique local experiences or amenities relevant to the primary guest profile.
- Consider seasonal promotions aligned with peak travel times for key origin markets.
Nearby Short-Term Rental Market Comparison
How does the Warrenton Airbnb market stack up against its neighbors? Compare key performance metrics like average monthly revenue, ADR, and occupancy rates in surrounding areas to understand the broader regional STR landscape.
| Market | Active Properties | Monthly Revenue | Daily Rate | Avg. Occupancy |
|---|---|---|---|---|
| Arch Cape | 78 | $7,909 | $512.29 | 53% |
| Erlands Point-Kitsap Lake | 12 | $5,285 | $366.41 | 47% |
| Manzanita | 288 | $5,262 | $395.19 | 43% |
| Cannon Beach | 226 | $5,178 | $436.27 | 46% |
| Olalla | 13 | $4,868 | $334.79 | 49% |
| Dundee | 71 | $4,771 | $426.97 | 35% |
| Woodinville | 35 | $4,409 | $340.44 | 51% |
| Moclips | 108 | $4,391 | $433.53 | 39% |
| Amanda Park | 11 | $4,328 | $447.54 | 40% |
| Nehalem | 100 | $4,215 | $369.69 | 42% |