Pendleton Airbnb Market Analysis 2026: Short Term Rental Data & Vacation Rental Statistics in Oregon, United States
Is Airbnb profitable in Pendleton in 2026? Explore comprehensive Airbnb analytics for Pendleton, Oregon, United States to uncover income potential. This 2026 STR market report for Pendleton, based on AirROI data from February 2025 to January 2026, reveals key trends in the niche market of 80 active listings.
Whether you're considering an Airbnb investment in Pendleton, optimizing your existing vacation rental, or exploring rental arbitrage opportunities, understanding the Pendleton Airbnb data is crucial. Leveraging the low regulation environment is key to maximizing your short term rental income potential. Let's dive into the specifics.
Key Pendleton Airbnb Performance Metrics Overview
Monthly Airbnb Revenue Variations & Income Potential in Pendleton (2026)
Understanding the monthly revenue variations for Airbnb listings in Pendleton is key to maximizing your short term rental income potential. Seasonality significantly impacts earnings. Our analysis, based on data from the past 12 months, shows that the peak revenue month for STRs in Pendleton is typically June, while February often presents the lowest earnings, highlighting opportunities for strategic pricing adjustments during shoulder and low seasons. Explore the typical Airbnb income in Pendleton across different performance tiers:
- Best-in-class properties (Top 10%) achieve $4,322+ monthly, often utilizing dynamic pricing and superior guest experiences.
- Strong performing properties (Top 25%) earn $2,950 or more, indicating effective management and desirable locations/amenities.
- Typical properties (Median) generate around $1,893 per month, representing the average market performance.
- Entry-level properties (Bottom 25%) see earnings around $1,010, often with potential for optimization.
Average Monthly Airbnb Earnings Trend in Pendleton
Pendleton Airbnb Occupancy Rate Trends (2026)
Maximize your bookings by understanding the Pendleton STR occupancy trends. Seasonal demand shifts significantly influence how often properties are booked. Typically, Junesees the highest demand (peak season occupancy), while February experiences the lowest (low season). Effective strategies, like adjusting minimum stays or offering promotions, can boost occupancy during slower periods. Here's how different property tiers perform in Pendleton:
- Best-in-class properties (Top 10%) achieve 73%+ occupancy, indicating high desirability and potentially optimized availability.
- Strong performing properties (Top 25%) maintain 57% or higher occupancy, suggesting good market fit and guest satisfaction.
- Typical properties (Median) have an occupancy rate around 40%.
- Entry-level properties (Bottom 25%) average 21% occupancy, potentially facing higher vacancy.
Average Monthly Occupancy Rate Trend in Pendleton
Average Daily Rate (ADR) Airbnb Trends in Pendleton (2026)
Effective short term rental pricing strategy in Pendleton involves understanding monthly ADR fluctuations. The Average Daily Rate (ADR) for Airbnb in Pendleton typically peaks in September and dips lowest during January. Leveraging Airbnb dynamic pricing tools or strategies based on this seasonality can significantly boost revenue. Here's a look at the typical nightly rates achieved:
- Best-in-class properties (Top 10%) command rates of $363+ per night, often due to premium features or locations.
- Strong performing properties (Top 25%) achieve nightly rates of $221 or more.
- Typical properties (Median) charge around $145 per night.
- Entry-level properties (Bottom 25%) earn around $118 per night.
Average Daily Rate (ADR) Trend by Month in Pendleton
Get Live Pendleton Market Intelligence 👇

Explore Real-time Analytics
Airbnb Seasonality Analysis & Trends in Pendleton (2026)
Peak Season (June, September, July)
- Revenue averages $3,007 per month
- Occupancy rates average 49.0%
- Daily rates average $202
Shoulder Season
- Revenue averages $2,178 per month
- Occupancy maintains around 42.4%
- Daily rates hold near $186
Low Season (January, February, December)
- Revenue drops to average $1,423 per month
- Occupancy decreases to average 29.4%
- Daily rates adjust to average $182
Seasonality Insights for Pendleton
- The Airbnb seasonality in Pendleton shows highly seasonal trends requiring careful strategy. While the sections above show seasonal averages, it's also insightful to look at the extremes:
- During the high season, the absolute peak month showcases Pendleton's highest earning potential, with monthly revenues capable of climbing to $3,112, occupancy reaching a high of 51.2%, and ADRs peaking at $208.
- Conversely, the slowest single month of the year, typically falling within the low season, marks the market's lowest point. In this month, revenue might dip to $1,235, occupancy could drop to 27.2%, and ADRs may adjust down to $180.
- Understanding both the seasonal averages and these monthly peaks and troughs in revenue, occupancy, and ADR is crucial for maximizing your Airbnb profit potential in Pendleton.
Seasonal Strategies for Maximizing Profit
- Peak Season: Maximize revenue through premium pricing and potentially longer minimum stays. Ensure high availability.
- Low Season: Offer competitive pricing, special promotions (e.g., extended stay discounts), and flexible cancellation policies. Target off-season travelers like remote workers or budget-conscious guests.
- Shoulder Seasons: Implement dynamic pricing that balances peak and low rates. Target weekend travelers or specific events. Offer slightly more flexible terms than peak season.
- Regularly analyze your own performance against these Pendleton seasonality benchmarks and adjust your pricing and availability strategy accordingly.
Best Areas for Airbnb Investment in Pendleton (2026)
Exploring the top neighborhoods for short-term rentals in Pendleton? This section highlights key areas, outlining why they are attractive for hosts and guests, along with notable local attractions. Consider these locations based on your target guest profile and investment strategy.
| Neighborhood / Area | Why Host Here? (Target Guests & Appeal) | Key Attractions & Landmarks |
|---|---|---|
| Downtown Pendleton | The heart of Pendleton, known for its historic buildings and vibrant atmosphere. Offers guests access to local shops, restaurants, and cultural experiences, making it ideal for visitors seeking convenience and local flavor. | Pendleton Round-Up, Pendleton Woolen Mills, Heritage Station Museum, Stafford Hansell Field, Main Street, Rugged Country Outfitters |
| Old Town | A charming area that reflects Pendleton's rich history and western culture. Perfect for guests looking for a unique and authentic experience, with local attractions and historical sites. | Pendleton Underground Tours, Blue Mountain Whiskey Festival, Old Town Park, The Hamley Steakhouse and Saloon, Burley Field, Umatilla River |
| Westgate | A family-friendly neighborhood with access to parks and recreational activities. Suitable for families visiting Pendleton with nearby amenities and outdoor spaces. | Roy Raley Park, Pioneer Park, Pendleton Bike Park, Umatilla River Walk, Children's Museum, Pendleton Swimming Pool |
| North Hill | Located near nature trails and scenic views, appealing to outdoor enthusiasts. Great for visitors looking to explore the natural beauty of the area. | Cayuse Prairie, McKay Reservoir, Wildhorse Resort, Golf Courses, Hiking Trails, Bird Watching |
| East Pendleton | A quieter area with suburban amenities, suitable for longer stays and business travelers seeking comfortable accommodations away from the hustle and bustle. | East Oregonian Newspaper, Pendleton Golf Club, Cameron Park, Nearby Shopping Centers, Local Cafés, Fast Food Outlets |
| South Hill | A tranquil neighborhood known for its spacious homes and gardens. Attracts guests looking for peaceful stays while still being close to downtown attractions. | Pendleton Country Club, Local Parks, Scenic Drives, Wildlife Viewing, Horseback Riding, Shopping in Downtown |
| Mission | A unique area that offers a blend of local culture and community events. Ideal for guests looking to experience Pendleton's diverse community. | Mission Market, Local Events, Cultural Festivals, Community Parks, Food Trucks, Nearby Vineyards |
| Fairview | A suburban area with family-friendly activities and close to schools, parks, and shopping amenities, catering to families visiting Pendleton. | Fairview Park, Local Schools, Shopping Districts, Community Centers, Children's Playgrounds, Family Restaurants |
Understanding Airbnb License Requirements & STR Laws in Pendleton (2026)
While Pendleton, Oregon, United States currently shows low STR regulations, specific Airbnb license requirements might still exist or change. Always verify the latest short term rental regulations and Airbnb license requirements directly with local government authorities for Pendleton to ensure full compliance before hosting.
(Source: AirROI data, 2026, finding no licensed listings among those analyzed)
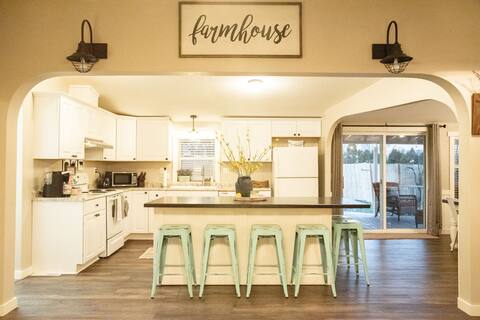
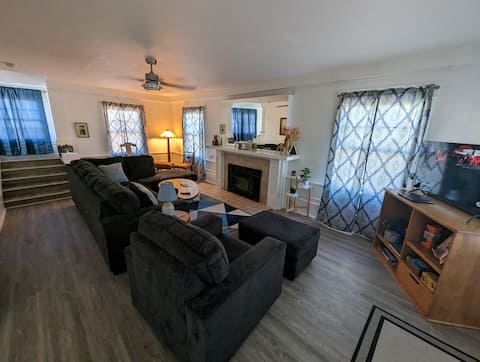
Top Performing Airbnb Properties in Pendleton (2026)
Benchmark your potential! Explore examples of top-performing Airbnb properties in Pendletonbased on Trailing Twelve Month (TTM) revenue. Analyze their characteristics, revenue, occupancy rate, and ADR to understand what drives success in this market.

Mimi’s Hive - Spacious 6 bedroom 5 bath
Entire Place • 6 bedrooms
The Gathering Place
Entire Place • 3 bedrooms

Downtown Pendleton: Walk to Round Up!
Entire Place • 4 bedrooms
4 Bedroom Pendleton Craftsman
Entire Place • 4 bedrooms

Gather Here-Pendleton, OR
Entire Place • 5 bedrooms

BackFire Lodge (Rental for entire space)
Private Room • 4 bedrooms
Note: Performance varies based on location, size, amenities, seasonality, and management quality. Data reflects the past 12 months.
Top Performing Airbnb Hosts in Pendleton (2026)
Learn from the best! This table showcases top-performing Airbnb hosts in Pendleton based on the number of properties managed and estimated total revenue over the past year. Analyze their scale and performance metrics.
| Host Name | Properties | Grossing Revenue | Stay Reviews | Avg Rating |
|---|---|---|---|---|
| Cindy | 10 | $235,981 | 1236 | 4.94/5.0 |
| Diana | 8 | $146,855 | 1615 | 4.88/5.0 |
| Erin | 5 | $79,181 | 160 | 4.98/5.0 |
| Kelsie | 4 | $79,140 | 217 | 4.79/5.0 |
| Paula | 3 | $70,642 | 71 | 4.79/5.0 |
| Ronna | 3 | $69,591 | 427 | 4.86/5.0 |
| Rebekah | 1 | $58,870 | 41 | 4.98/5.0 |
| Nick | 1 | $54,246 | 73 | 4.86/5.0 |
| Alden | 1 | $51,623 | 71 | 4.92/5.0 |
| Taighler | 2 | $51,445 | 46 | 4.97/5.0 |
Analyzing the strategies of top hosts, such as their property selection, pricing, and guest communication, can offer valuable lessons for optimizing your own Airbnb operations in Pendleton.
Dive Deeper: Advanced Pendleton STR Market Data (2026)
Ready to unlock more insights? AirROI provides access to advanced metrics and comprehensive Airbnb data for Pendleton. Explore detailed analytics beyond this report to refine your investment strategy, optimize pricing, and maximize your vacation rental profits.
Explore Advanced MetricsPendleton Short-Term Rental Market Composition (2026): Property & Room Types
Room Type Distribution
Property Type Distribution
Market Composition Insights for Pendleton
- The Pendleton Airbnb market composition is heavily skewed towards Entire Home/Apt listings, which make up 87.5% of the 80 active rentals. This indicates strong guest preference for privacy and space.
- Looking at the property type distribution in Pendleton, House properties are the most common (65%), reflecting the local real estate landscape.
- Houses represent a significant 65% portion, catering likely to families or larger groups.
- The presence of 8.8% Hotel/Boutique listings indicates integration with traditional hospitality.
- Smaller segments like others, unique stays, outdoor/unique (combined 5.1%) offer potential for unique stay experiences.
Pendleton Airbnb Room Capacity Analysis (2026): Bedroom Distribution
Distribution of Listings by Number of Bedrooms
Room Capacity Insights for Pendleton
- The dominant room capacity in Pendleton is 2 bedrooms listings, making up 33.8% of the market. This suggests a strong demand for properties suitable for couples or solo travelers.
- Together, 2 bedrooms and 3 bedrooms properties represent 58.8% of the active Airbnb listings in Pendleton, indicating a high concentration in these sizes.
- A significant 38.8% of listings offer 3+ bedrooms, catering to larger groups and families seeking more space in Pendleton.
Pendleton Vacation Rental Guest Capacity Trends (2026)
Distribution of Listings by Guest Capacity
Guest Capacity Insights for Pendleton
- The most common guest capacity trend in Pendleton vacation rentals is listings accommodating 6 guests (28.7%). This suggests the primary traveler segment is likely larger groups.
- Properties designed for 6 guests and 2 guests dominate the Pendleton STR market, accounting for 48.7% of listings.
- 51.2% of properties accommodate 6+ guests, serving the market segment for larger families or group travel in Pendleton.
- On average, properties in Pendleton are equipped to host 4.8 guests.
Pendleton Airbnb Booking Patterns (2026): Available vs. Booked Days
Available Days Distribution
Booked Days Distribution
Booking Pattern Insights for Pendleton
- The most common availability pattern in Pendleton falls within the 271-366 days range, representing 38.8% of listings. This suggests many properties have significant open periods on their calendars.
- Approximately 76.3% of listings show high availability (181+ days open annually), indicating potential for increased bookings or specific owner usage patterns.
- For booked days, the 91-180 days range is most frequent in Pendleton (38.8%), reflecting common guest stay durations or potential owner blocking patterns.
- A notable 23.8% of properties secure long booking periods (181+ days booked per year), highlighting successful long-term rental strategies or significant owner usage.
Pendleton Airbnb Minimum Stay Requirements Analysis
Distribution of Listings by Minimum Night Requirement
1 Night
45 listings
56.3% of total
2 Nights
15 listings
18.8% of total
7-29 Nights
2 listings
2.5% of total
30+ Nights
18 listings
22.5% of total
Key Insights
- The most prevalent minimum stay requirement in Pendleton is 1 Night, adopted by 56.3% of listings. This highlights the market's preference for shorter, flexible bookings.
- A strong majority (75.1%) of the Pendleton Airbnb data shows acceptance of very short stays (1-2 nights), indicating a dynamic, high-turnover market.
- A significant segment (22.5%) caters to monthly stays (30+ nights) in Pendleton, pointing to opportunities in the extended-stay market.
Recommendations
- Align with the market by considering a 1 Night minimum stay, as 56.3% of Pendleton hosts use this setting.
- Explore offering discounts for stays of 30+ nights to attract the 22.5% of the market seeking extended stays.
- Adjust minimum nights based on seasonality – potentially shorter during low season and longer during peak demand periods in Pendleton.
Pendleton Airbnb Cancellation Policy Trends Analysis (2026)
Limited
1 listings
1.3% of total
Flexible
21 listings
26.3% of total
Moderate
38 listings
47.5% of total
Firm
18 listings
22.5% of total
Strict
2 listings
2.5% of total
Cancellation Policy Insights for Pendleton
- The prevailing Airbnb cancellation policy trend in Pendleton is Moderate, used by 47.5% of listings.
- The market strongly favors guest-friendly terms, with 73.8% of listings offering Flexible or Moderate policies. This suggests guests in Pendleton may expect booking flexibility.
- Strict cancellation policies are quite rare (2.5%), potentially making listings with this policy less competitive unless justified by high demand or property type.
Recommendations for Hosts
- Consider adopting a Moderate policy to align with the 47.5% market standard in Pendleton.
- Using a Strict policy might deter some guests, as only 2.5% of listings use it. Evaluate if potential revenue protection outweighs possible lower booking rates.
- Regularly review your cancellation policy against competitors and market demand shifts in Pendleton.
Pendleton STR Booking Lead Time Analysis (2026)
Average Booking Lead Time by Month
Booking Lead Time Insights for Pendleton
- The overall average booking lead time for vacation rentals in Pendleton is 41 days.
- Guests book furthest in advance for stays during September (average 99 days), likely coinciding with peak travel demand or local events.
- The shortest booking windows occur for stays in February (average 11 days), indicating more last-minute travel plans during this time.
- Seasonally, Summer (57 days avg.) sees the longest lead times, while Winter (14 days avg.) has the shortest, reflecting typical travel planning cycles.
Recommendations for Hosts
- Use the overall average lead time (41 days) as a baseline for your pricing and availability strategy in Pendleton.
- For September stays, consider implementing length-of-stay discounts or slightly higher rates for bookings made less than 99 days out to capitalize on advance planning.
- During February, focus on last-minute booking availability and promotions, as guests book with very short notice (11 days avg.).
- Target marketing efforts for the Summer season well in advance (at least 57 days) to capture early planners.
- Monitor your own booking lead times against these Pendleton averages to identify opportunities for dynamic pricing adjustments.
Popular & Essential Airbnb Amenities in Pendleton (2026)
Amenity Prevalence
Amenity Insights for Pendleton
- Essential amenities in Pendleton that guests expect include: Smoke alarm, Wifi, Air conditioning. Lacking these (any) could significantly impact bookings.
- Popular amenities like Free parking on premises, Hot water, TV are common but not universal. Offering these can provide a competitive edge.
Recommendations for Hosts
- Ensure your listing includes all essential amenities for Pendleton: Smoke alarm, Wifi, Air conditioning.
- Prioritize adding missing essentials: Air conditioning.
- Consider adding popular differentiators like Free parking on premises or Hot water to increase appeal.
- Highlight unique or less common amenities you offer (e.g., hot tub, dedicated workspace, EV charger) in your listing description and photos.
- Regularly check competitor amenities in Pendleton to stay competitive.
Pendleton Airbnb Guest Demographics & Profile Analysis (2026)
Guest Profile Summary for Pendleton
- The typical guest profile for Airbnb in Pendleton consists of primarily domestic travelers (98%), often arriving from nearby Portland, typically belonging to the Post-2000s (Gen Z/Alpha) group (50%), primarily speaking English or Spanish.
- Domestic travelers account for 98.2% of guests.
- Key international markets include United States (98.2%) and Canada (0.5%).
- Top languages spoken are English (79.6%) followed by Spanish (9.3%).
- A significant demographic segment is the Post-2000s (Gen Z/Alpha) group, representing 50% of guests.
Recommendations for Hosts
- Target domestic marketing efforts towards travelers from Portland and Boise.
- Tailor amenities and listing descriptions to appeal to the dominant Post-2000s (Gen Z/Alpha) demographic (e.g., highlight fast WiFi, smart home features, local guides).
- Highlight unique local experiences or amenities relevant to the primary guest profile.
- Consider seasonal promotions aligned with peak travel times for key origin markets.
Nearby Short-Term Rental Market Comparison
How does the Pendleton Airbnb market stack up against its neighbors? Compare key performance metrics like average monthly revenue, ADR, and occupancy rates in surrounding areas to understand the broader regional STR landscape.
| Market | Active Properties | Monthly Revenue | Daily Rate | Avg. Occupancy |
|---|---|---|---|---|
| Walla Walla | 242 | $3,215 | $320.67 | 40% |
| Benton City | 20 | $3,206 | $321.46 | 41% |
| College Place | 61 | $2,803 | $261.62 | 41% |
| Pullman | 112 | $2,653 | $285.44 | 38% |
| La Grande | 81 | $2,590 | $172.69 | 50% |
| Desert Aire | 40 | $2,408 | $335.89 | 35% |
| Milton-Freewater | 24 | $2,194 | $235.84 | 41% |
| Baker City | 95 | $2,144 | $180.77 | 46% |
| Clarkston | 37 | $2,122 | $159.43 | 46% |
| Prosser | 34 | $2,097 | $214.07 | 40% |