Newport Airbnb Market Analysis 2026: Short Term Rental Data & Vacation Rental Statistics in Oregon, United States
Is Airbnb profitable in Newport in 2026? Explore comprehensive Airbnb analytics for Newport, Oregon, United States to uncover income potential. This 2026 STR market report for Newport, based on AirROI data from February 2025 to January 2026, reveals key trends in the market of 255 active listings.
Whether you're considering an Airbnb investment in Newport, optimizing your existing vacation rental, or exploring rental arbitrage opportunities, understanding the Newport Airbnb data is crucial. Leveraging the low regulation environment is key to maximizing your short term rental income potential. Let's dive into the specifics.
Key Newport Airbnb Performance Metrics Overview
Monthly Airbnb Revenue Variations & Income Potential in Newport (2026)
Understanding the monthly revenue variations for Airbnb listings in Newport is key to maximizing your short term rental income potential. Seasonality significantly impacts earnings. Our analysis, based on data from the past 12 months, shows that the peak revenue month for STRs in Newport is typically July, while February often presents the lowest earnings, highlighting opportunities for strategic pricing adjustments during shoulder and low seasons. Explore the typical Airbnb income in Newport across different performance tiers:
- Best-in-class properties (Top 10%) achieve $8,185+ monthly, often utilizing dynamic pricing and superior guest experiences.
- Strong performing properties (Top 25%) earn $5,469 or more, indicating effective management and desirable locations/amenities.
- Typical properties (Median) generate around $3,374 per month, representing the average market performance.
- Entry-level properties (Bottom 25%) see earnings around $1,991, often with potential for optimization.
Average Monthly Airbnb Earnings Trend in Newport
Newport Airbnb Occupancy Rate Trends (2026)
Maximize your bookings by understanding the Newport STR occupancy trends. Seasonal demand shifts significantly influence how often properties are booked. Typically, Augustsees the highest demand (peak season occupancy), while January experiences the lowest (low season). Effective strategies, like adjusting minimum stays or offering promotions, can boost occupancy during slower periods. Here's how different property tiers perform in Newport:
- Best-in-class properties (Top 10%) achieve 77%+ occupancy, indicating high desirability and potentially optimized availability.
- Strong performing properties (Top 25%) maintain 64% or higher occupancy, suggesting good market fit and guest satisfaction.
- Typical properties (Median) have an occupancy rate around 45%.
- Entry-level properties (Bottom 25%) average 24% occupancy, potentially facing higher vacancy.
Average Monthly Occupancy Rate Trend in Newport
Average Daily Rate (ADR) Airbnb Trends in Newport (2026)
Effective short term rental pricing strategy in Newport involves understanding monthly ADR fluctuations. The Average Daily Rate (ADR) for Airbnb in Newport typically peaks in July and dips lowest during February. Leveraging Airbnb dynamic pricing tools or strategies based on this seasonality can significantly boost revenue. Here's a look at the typical nightly rates achieved:
- Best-in-class properties (Top 10%) command rates of $488+ per night, often due to premium features or locations.
- Strong performing properties (Top 25%) achieve nightly rates of $340 or more.
- Typical properties (Median) charge around $248 per night.
- Entry-level properties (Bottom 25%) earn around $184 per night.
Average Daily Rate (ADR) Trend by Month in Newport
Get Live Newport Market Intelligence 👇

Explore Real-time Analytics
Airbnb Seasonality Analysis & Trends in Newport (2026)
Peak Season (July, August, June)
- Revenue averages $7,069 per month
- Occupancy rates average 60.3%
- Daily rates average $365
Shoulder Season
- Revenue averages $3,734 per month
- Occupancy maintains around 42.4%
- Daily rates hold near $279
Low Season (January, February, April)
- Revenue drops to average $2,532 per month
- Occupancy decreases to average 35.0%
- Daily rates adjust to average $249
Seasonality Insights for Newport
- The Airbnb seasonality in Newport shows highly seasonal trends requiring careful strategy. While the sections above show seasonal averages, it's also insightful to look at the extremes:
- During the high season, the absolute peak month showcases Newport's highest earning potential, with monthly revenues capable of climbing to $7,845, occupancy reaching a high of 63.3%, and ADRs peaking at $382.
- Conversely, the slowest single month of the year, typically falling within the low season, marks the market's lowest point. In this month, revenue might dip to $2,311, occupancy could drop to 28.3%, and ADRs may adjust down to $235.
- Understanding both the seasonal averages and these monthly peaks and troughs in revenue, occupancy, and ADR is crucial for maximizing your Airbnb profit potential in Newport.
Seasonal Strategies for Maximizing Profit
- Peak Season: Maximize revenue through premium pricing and potentially longer minimum stays. Ensure high availability.
- Low Season: Offer competitive pricing, special promotions (e.g., extended stay discounts), and flexible cancellation policies. Target off-season travelers like remote workers or budget-conscious guests.
- Shoulder Seasons: Implement dynamic pricing that balances peak and low rates. Target weekend travelers or specific events. Offer slightly more flexible terms than peak season.
- Regularly analyze your own performance against these Newport seasonality benchmarks and adjust your pricing and availability strategy accordingly.
Best Areas for Airbnb Investment in Newport (2026)
Exploring the top neighborhoods for short-term rentals in Newport? This section highlights key areas, outlining why they are attractive for hosts and guests, along with notable local attractions. Consider these locations based on your target guest profile and investment strategy.
| Neighborhood / Area | Why Host Here? (Target Guests & Appeal) | Key Attractions & Landmarks |
|---|---|---|
| Yaquina Head | A beautiful coastal area featuring stunning views, the iconic Yaquina Head Lighthouse, and great opportunities for watching marine wildlife. Perfect for guests seeking a scenic experience of the Oregon Coast. | Yaquina Head Lighthouse, Yaquina Bay State Recreation Site, Beverly Beach State Park, Marine Science Center |
| Newport Historic Bayfront | A vibrant waterfront area known for its shops, restaurants, and access to sea life. Ideal for those wanting to experience the local culture and history of Newport. | Historic Fishermen's Wharf, Oregon Coast Aquarium, The Wax Works, Local seafood restaurants |
| South Beach | Known for its expansive beaches and access to both natural and recreational activities. A popular destination for families and outdoor enthusiasts looking for a beach getaway. | South Beach State Park, Beach access, Walking and biking paths along the coast |
| Agate Beach | A quieter, scenic beach area that offers a relaxing atmosphere away from the crowds, attracting those who desire peace and natural beauty while still being close to Newport's amenities. | Agate Beach State Recreation Site, Beachcombing, Scenic viewpoints |
| Devils Punch Bowl State Natural Area | A unique geological formation that draws visitors for its stunning views and tidal pools. Great for nature lovers and outdoor enthusiasts seeking a unique coastal experience. | Devils Punch Bowl, Tide pooling, Oregon Coast Scenic Byway |
| Yaquina Bay | A picturesque bay area perfect for boating and sightseeing. Guests can enjoy a variety of water activities and stunning coastal views. | Yaquina Bay Bridge, Boat tours, Fishing and crabbing |
| Oregon Coast Aquarium | A top attraction in Newport, the aquarium draws both tourists and locals, making nearby lodging highly desirable for visitors wanting easy access to this and other attractions. | Oregon Coast Aquarium, Marine exhibits, Kids splash zone |
| Siletz Bay | A peaceful bay area with beautiful views and a serene environment, ideal for guests looking to relax and enjoy the water-based scenery and activities. | Siletz Bay National Wildlife Refuge, Kayaking, Wildlife viewing |
Understanding Airbnb License Requirements & STR Laws in Newport (2026)
While Newport, Oregon, United States currently shows low STR regulations, specific Airbnb license requirements might still exist or change. Always verify the latest short term rental regulations and Airbnb license requirements directly with local government authorities for Newport to ensure full compliance before hosting.
(Source: AirROI data, 2026, finding no licensed listings among those analyzed)
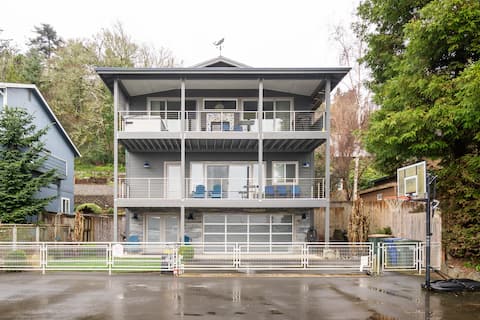
Top Performing Airbnb Properties in Newport (2026)
Benchmark your potential! Explore examples of top-performing Airbnb properties in Newportbased on Trailing Twelve Month (TTM) revenue. Analyze their characteristics, revenue, occupancy rate, and ADR to understand what drives success in this market.
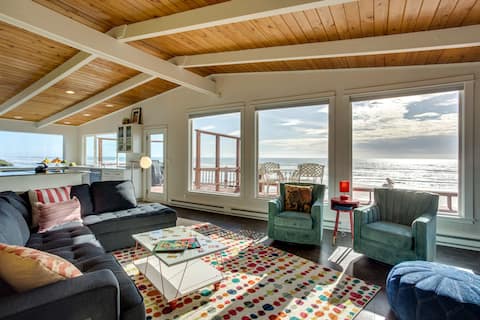
Ocean Front, Hot Tub,Dog Friendly! ~ Dancing Seal
Entire Place • 5 bedrooms
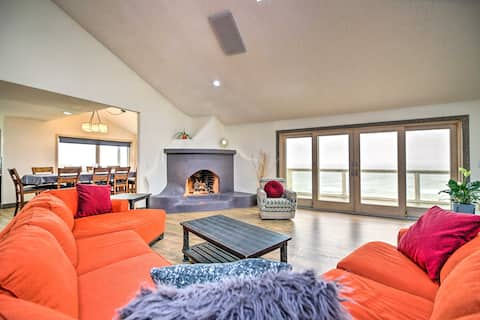
Luxurious Newport Estate w/ Spa & Lighthouse Views
Entire Place • 7 bedrooms
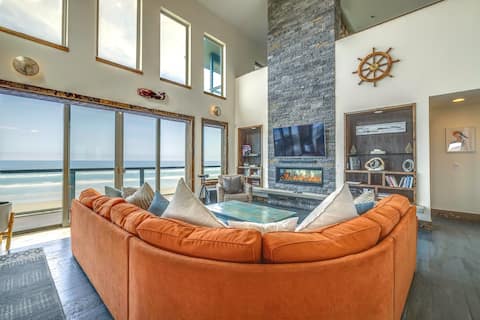
Oceanfront Home w/ Hot Tub, Sauna, 8 Mi to Newport
Entire Place • 4 bedrooms

Ocean Front! Hot Tub & Dog Friendly~Second Story
Entire Place • 5 bedrooms
Walk to the Historic Bayfront from an Ultra-Spacious Home
Entire Place • 4 bedrooms

Newport Oregon Beach House
Entire Place • 5 bedrooms
Note: Performance varies based on location, size, amenities, seasonality, and management quality. Data reflects the past 12 months.
Top Performing Airbnb Hosts in Newport (2026)
Learn from the best! This table showcases top-performing Airbnb hosts in Newport based on the number of properties managed and estimated total revenue over the past year. Analyze their scale and performance metrics.
| Host Name | Properties | Grossing Revenue | Stay Reviews | Avg Rating |
|---|---|---|---|---|
| Sweet Homes | 25 | $1,414,124 | 852 | 4.76/5.0 |
| Meredith | 17 | $1,059,840 | 977 | 4.63/5.0 |
| Vacasa Oregon | 31 | $637,670 | 2408 | 4.52/5.0 |
| Evolve | 5 | $585,561 | 327 | 4.82/5.0 |
| Vacasa Oregon | 13 | $349,960 | 1472 | 4.57/5.0 |
| Lauri | 6 | $285,061 | 717 | 4.76/5.0 |
| Peggy | 11 | $258,364 | 833 | 4.72/5.0 |
| Richard | 2 | $257,705 | 699 | 4.86/5.0 |
| Oregon Beach Vacations | 7 | $248,686 | 102 | 4.10/5.0 |
| Leslie And Anthony | 7 | $234,793 | 3553 | 4.85/5.0 |
Analyzing the strategies of top hosts, such as their property selection, pricing, and guest communication, can offer valuable lessons for optimizing your own Airbnb operations in Newport.
Dive Deeper: Advanced Newport STR Market Data (2026)
Ready to unlock more insights? AirROI provides access to advanced metrics and comprehensive Airbnb data for Newport. Explore detailed analytics beyond this report to refine your investment strategy, optimize pricing, and maximize your vacation rental profits.
Explore Advanced MetricsNewport Short-Term Rental Market Composition (2026): Property & Room Types
Room Type Distribution
Property Type Distribution
Market Composition Insights for Newport
- The Newport Airbnb market composition is heavily skewed towards Entire Home/Apt listings, which make up 84.7% of the 255 active rentals. This indicates strong guest preference for privacy and space.
- Looking at the property type distribution in Newport, House properties are the most common (55.3%), reflecting the local real estate landscape.
- Houses represent a significant 55.3% portion, catering likely to families or larger groups.
- The presence of 13.7% Hotel/Boutique listings indicates integration with traditional hospitality.
- Smaller segments like others, outdoor/unique (combined 4.4%) offer potential for unique stay experiences.
Newport Airbnb Room Capacity Analysis (2026): Bedroom Distribution
Distribution of Listings by Number of Bedrooms
Room Capacity Insights for Newport
- The dominant room capacity in Newport is 1 bedroom listings, making up 33.7% of the market. This suggests a strong demand for properties suitable for couples or solo travelers.
- Together, 1 bedroom and 2 bedrooms properties represent 57.6% of the active Airbnb listings in Newport, indicating a high concentration in these sizes.
- A significant 34.5% of listings offer 3+ bedrooms, catering to larger groups and families seeking more space in Newport.
Newport Vacation Rental Guest Capacity Trends (2026)
Distribution of Listings by Guest Capacity
Guest Capacity Insights for Newport
- The most common guest capacity trend in Newport vacation rentals is listings accommodating 4 guests (29.8%). This suggests the primary traveler segment is likely small families or groups.
- Properties designed for 4 guests and 8+ guests dominate the Newport STR market, accounting for 51.8% of listings.
- 43.2% of properties accommodate 6+ guests, serving the market segment for larger families or group travel in Newport.
- On average, properties in Newport are equipped to host 4.8 guests.
Newport Airbnb Booking Patterns (2026): Available vs. Booked Days
Available Days Distribution
Booked Days Distribution
Booking Pattern Insights for Newport
- The most common availability pattern in Newport falls within the 271-366 days range, representing 34.9% of listings. This suggests many properties have significant open periods on their calendars.
- Approximately 69.8% of listings show high availability (181+ days open annually), indicating potential for increased bookings or specific owner usage patterns.
- For booked days, the 91-180 days range is most frequent in Newport (34.9%), reflecting common guest stay durations or potential owner blocking patterns.
- A notable 30.2% of properties secure long booking periods (181+ days booked per year), highlighting successful long-term rental strategies or significant owner usage.
Newport Airbnb Minimum Stay Requirements Analysis
Distribution of Listings by Minimum Night Requirement
1 Night
66 listings
25.9% of total
2 Nights
71 listings
27.8% of total
3 Nights
5 listings
2% of total
4-6 Nights
3 listings
1.2% of total
7-29 Nights
9 listings
3.5% of total
30+ Nights
101 listings
39.6% of total
Key Insights
- The most prevalent minimum stay requirement in Newport is 30+ Nights, adopted by 39.6% of listings. This highlights the market's preference for longer commitments.
- A significant segment (39.6%) caters to monthly stays (30+ nights) in Newport, pointing to opportunities in the extended-stay market.
Recommendations
- Align with the market by considering a 30+ Nights minimum stay, as 39.6% of Newport hosts use this setting.
- If feasible, allowing 1-night stays, especially midweek or during low season, could capture last-minute bookings, as only 25.9% currently do.
- Explore offering discounts for stays of 30+ nights to attract the 39.6% of the market seeking extended stays.
- Adjust minimum nights based on seasonality – potentially shorter during low season and longer during peak demand periods in Newport.
Newport Airbnb Cancellation Policy Trends Analysis (2026)
Super Strict 60 Days
26 listings
10.2% of total
Limited
2 listings
0.8% of total
Super Strict 30 Days
35 listings
13.7% of total
Flexible
31 listings
12.2% of total
Moderate
74 listings
29% of total
Firm
66 listings
25.9% of total
Strict
21 listings
8.2% of total
Cancellation Policy Insights for Newport
- The prevailing Airbnb cancellation policy trend in Newport is Moderate, used by 29% of listings.
- There's a relatively balanced mix between guest-friendly (41.2%) and stricter (34.1%) policies, offering choices for different guest needs.
- Strict cancellation policies are quite rare (8.2%), potentially making listings with this policy less competitive unless justified by high demand or property type.
Recommendations for Hosts
- Consider adopting a Moderate policy to align with the 29% market standard in Newport.
- Using a Strict policy might deter some guests, as only 8.2% of listings use it. Evaluate if potential revenue protection outweighs possible lower booking rates.
- Regularly review your cancellation policy against competitors and market demand shifts in Newport.
Newport STR Booking Lead Time Analysis (2026)
Average Booking Lead Time by Month
Booking Lead Time Insights for Newport
- The overall average booking lead time for vacation rentals in Newport is 58 days.
- Guests book furthest in advance for stays during July (average 88 days), likely coinciding with peak travel demand or local events.
- The shortest booking windows occur for stays in January (average 34 days), indicating more last-minute travel plans during this time.
- Seasonally, Summer (81 days avg.) sees the longest lead times, while Winter (42 days avg.) has the shortest, reflecting typical travel planning cycles.
Recommendations for Hosts
- Use the overall average lead time (58 days) as a baseline for your pricing and availability strategy in Newport.
- For July stays, consider implementing length-of-stay discounts or slightly higher rates for bookings made less than 88 days out to capitalize on advance planning.
- Target marketing efforts for the Summer season well in advance (at least 81 days) to capture early planners.
- Monitor your own booking lead times against these Newport averages to identify opportunities for dynamic pricing adjustments.
Popular & Essential Airbnb Amenities in Newport (2026)
Amenity Prevalence
Amenity Insights for Newport
- Essential amenities in Newport that guests expect include: Smoke alarm, Wifi, TV. Lacking these (any) could significantly impact bookings.
- Popular amenities like Free parking on premises, Heating, Carbon monoxide alarm are common but not universal. Offering these can provide a competitive edge.
Recommendations for Hosts
- Ensure your listing includes all essential amenities for Newport: Smoke alarm, Wifi, TV.
- Prioritize adding missing essentials: Wifi, TV.
- Consider adding popular differentiators like Free parking on premises or Heating to increase appeal.
- Highlight unique or less common amenities you offer (e.g., hot tub, dedicated workspace, EV charger) in your listing description and photos.
- Regularly check competitor amenities in Newport to stay competitive.
Newport Airbnb Guest Demographics & Profile Analysis (2026)
Guest Profile Summary for Newport
- The typical guest profile for Airbnb in Newport consists of primarily domestic travelers (98%), often arriving from nearby Portland, typically belonging to the Post-2000s (Gen Z/Alpha) group (50%), primarily speaking English or Spanish.
- Domestic travelers account for 98.4% of guests.
- Key international markets include United States (98.4%) and Canada (0.4%).
- Top languages spoken are English (75.9%) followed by Spanish (10.5%).
- A significant demographic segment is the Post-2000s (Gen Z/Alpha) group, representing 50% of guests.
Recommendations for Hosts
- Target domestic marketing efforts towards travelers from Portland and Eugene.
- Tailor amenities and listing descriptions to appeal to the dominant Post-2000s (Gen Z/Alpha) demographic (e.g., highlight fast WiFi, smart home features, local guides).
- Highlight unique local experiences or amenities relevant to the primary guest profile.
- Consider seasonal promotions aligned with peak travel times for key origin markets.
Nearby Short-Term Rental Market Comparison
How does the Newport Airbnb market stack up against its neighbors? Compare key performance metrics like average monthly revenue, ADR, and occupancy rates in surrounding areas to understand the broader regional STR landscape.
| Market | Active Properties | Monthly Revenue | Daily Rate | Avg. Occupancy |
|---|---|---|---|---|
| Arch Cape | 78 | $7,909 | $512.29 | 53% |
| South Beach | 10 | $6,948 | $417.34 | 51% |
| Manzanita | 288 | $5,262 | $395.19 | 43% |
| Cannon Beach | 226 | $5,178 | $436.27 | 46% |
| Seal Rock | 39 | $4,852 | $371.44 | 47% |
| Bandon | 158 | $4,810 | $403.75 | 41% |
| Dundee | 71 | $4,771 | $426.97 | 35% |
| Lincoln County | 10 | $4,478 | $377.82 | 41% |
| Yachats | 183 | $4,296 | $287.72 | 48% |
| Nehalem | 100 | $4,215 | $369.69 | 42% |