Lakeview Airbnb Market Analysis 2025: Short Term Rental Data & Vacation Rental Statistics in Oregon, United States
Is Airbnb profitable in Lakeview in 2025? Explore comprehensive Airbnb analytics for Lakeview, Oregon, United States to uncover income potential. This 2025 STR market report for Lakeview, based on AirROI data from August 2024 to July 2025, reveals key trends in the niche market of 19 active listings.
Whether you're considering an Airbnb investment in Lakeview, optimizing your existing vacation rental, or exploring rental arbitrage opportunities, understanding the Lakeview Airbnb data is crucial. Leveraging the low regulation environment is key to maximizing your short term rental income potential. Let's dive into the specifics.
Key Lakeview Airbnb Performance Metrics Overview
Monthly Airbnb Revenue Variations & Income Potential in Lakeview (2025)
Understanding the monthly revenue variations for Airbnb listings in Lakeview is key to maximizing your short term rental income potential. Seasonality significantly impacts earnings. Our analysis, based on data from the past 12 months, shows that the peak revenue month for STRs in Lakeview is typically August, while January often presents the lowest earnings, highlighting opportunities for strategic pricing adjustments during shoulder and low seasons. Explore the typical Airbnb income in Lakeview across different performance tiers:
- Best-in-class properties (Top 10%) achieve $3,319+ monthly, often utilizing dynamic pricing and superior guest experiences.
- Strong performing properties (Top 25%) earn $2,475 or more, indicating effective management and desirable locations/amenities.
- Typical properties (Median) generate around $1,614 per month, representing the average market performance.
- Entry-level properties (Bottom 25%) see earnings around $920, often with potential for optimization.
Average Monthly Airbnb Earnings Trend in Lakeview
Lakeview Airbnb Occupancy Rate Trends (2025)
Maximize your bookings by understanding the Lakeview STR occupancy trends. Seasonal demand shifts significantly influence how often properties are booked. Typically, Augustsees the highest demand (peak season occupancy), while January experiences the lowest (low season). Effective strategies, like adjusting minimum stays or offering promotions, can boost occupancy during slower periods. Here's how different property tiers perform in Lakeview:
- Best-in-class properties (Top 10%) achieve 69%+ occupancy, indicating high desirability and potentially optimized availability.
- Strong performing properties (Top 25%) maintain 54% or higher occupancy, suggesting good market fit and guest satisfaction.
- Typical properties (Median) have an occupancy rate around 37%.
- Entry-level properties (Bottom 25%) average 21% occupancy, potentially facing higher vacancy.
Average Monthly Occupancy Rate Trend in Lakeview
Average Daily Rate (ADR) Airbnb Trends in Lakeview (2025)
Effective short term rental pricing strategy in Lakeview involves understanding monthly ADR fluctuations. The Average Daily Rate (ADR) for Airbnb in Lakeview typically peaks in June and dips lowest during February. Leveraging Airbnb dynamic pricing tools or strategies based on this seasonality can significantly boost revenue. Here's a look at the typical nightly rates achieved:
- Best-in-class properties (Top 10%) command rates of $177+ per night, often due to premium features or locations.
- Strong performing properties (Top 25%) achieve nightly rates of $153 or more.
- Typical properties (Median) charge around $132 per night.
- Entry-level properties (Bottom 25%) earn around $116 per night.
Average Daily Rate (ADR) Trend by Month in Lakeview
Get Live Lakeview Market Intelligence 👇

Explore Real-time Analytics
Airbnb Seasonality Analysis & Trends in Lakeview (2025)
Peak Season (August, June, May)
- Revenue averages $2,814 per month
- Occupancy rates average 56.5%
- Daily rates average $157
Shoulder Season
- Revenue averages $1,701 per month
- Occupancy maintains around 38.5%
- Daily rates hold near $148
Low Season (January, February, December)
- Revenue drops to average $1,058 per month
- Occupancy decreases to average 23.3%
- Daily rates adjust to average $136
Seasonality Insights for Lakeview
- The Airbnb seasonality in Lakeview shows highly seasonal trends requiring careful strategy. While the sections above show seasonal averages, it's also insightful to look at the extremes:
- During the high season, the absolute peak month showcases Lakeview's highest earning potential, with monthly revenues capable of climbing to $3,272, occupancy reaching a high of 61.5%, and ADRs peaking at $172.
- Conversely, the slowest single month of the year, typically falling within the low season, marks the market's lowest point. In this month, revenue might dip to $978, occupancy could drop to 16.8%, and ADRs may adjust down to $135.
- Understanding both the seasonal averages and these monthly peaks and troughs in revenue, occupancy, and ADR is crucial for maximizing your Airbnb profit potential in Lakeview.
Seasonal Strategies for Maximizing Profit
- Peak Season: Maximize revenue through premium pricing and potentially longer minimum stays. Ensure high availability.
- Low Season: Offer competitive pricing, special promotions (e.g., extended stay discounts), and flexible cancellation policies. Target off-season travelers like remote workers or budget-conscious guests.
- Shoulder Seasons: Implement dynamic pricing that balances peak and low rates. Target weekend travelers or specific events. Offer slightly more flexible terms than peak season.
- Regularly analyze your own performance against these Lakeview seasonality benchmarks and adjust your pricing and availability strategy accordingly.
Best Areas for Airbnb Investment in Lakeview (2025)
Exploring the top neighborhoods for short-term rentals in Lakeview? This section highlights key areas, outlining why they are attractive for hosts and guests, along with notable local attractions. Consider these locations based on your target guest profile and investment strategy.
| Neighborhood / Area | Why Host Here? (Target Guests & Appeal) | Key Attractions & Landmarks |
|---|---|---|
| Downtown Lakeview | The central hub of Lakeview, offering access to shops, restaurants, and cultural attractions. Ideal for travelers looking to explore the local scene. | Lake County Museum, Lakeview Golf Course, Riverside Park, Historic Main Street, Lakeview Municipal Pool |
| Lakeview Reservoir Area | A picturesque spot perfect for nature lovers and water sports enthusiasts. Great for outdoor activities such as fishing and boating, attracting visitors year-round. | Lakeview Reservoir, Fishing spots, Boating, Picnic areas, Walking trails |
| Summer Lake | A serene getaway known for beautiful landscapes and wildlife. Perfect for guests interested in a peaceful retreat and outdoor adventures. | Summer Lake Wildlife Area, Bird watching, Hiking trails, Horseback riding, Camping |
| Hart Mountain Hot Springs | A unique natural hot springs location offering relaxation and wellness. Great for those looking to unwind in nature. | Hart Mountain Hot Springs, Scenic drives, Wildlife watching, Hiking, Star gazing |
| Pikney Flat Area | A secluded area providing a quiet environment for retreats and family gatherings. Attracts guests looking for tranquility and nature. | Picnic spots, Hiking trails, Scenic vistas, Wildlife trails, Nature photography |
| Gearhart Mountain | An outdoor lover's paradise with hiking and picturesque views. Ideal for eco-tourism and adventurous stays. | Mount Gearhart hiking trails, Wildlife viewing, Photography, Camping, Scenic overlooks |
| Silver Lake | A small, charming town offering a relaxed atmosphere. It is great for travelers looking for a local experience away from the hustle and bustle. | Silver Lake Park, Local shops, Family-friendly activities, Fishing, Biking trails |
| Christmas Valley | A unique desert landscape attracting visitors seeking adventure and exploration. Perfect for tourists drawn to the rugged outdoors. | Oregon Desert Trails, Wildlife viewing, Star gazing, Scenic drives, Photography opportunities |
Understanding Airbnb License Requirements & STR Laws in Lakeview (2025)
While Lakeview, Oregon, United States currently shows low STR regulations, specific Airbnb license requirements might still exist or change. Always verify the latest short term rental regulations and Airbnb license requirements directly with local government authorities for Lakeview to ensure full compliance before hosting.
(Source: AirROI data, 2025, finding no licensed listings among those analyzed)
Top Performing Airbnb Properties in Lakeview (2025)
Benchmark your potential! Explore examples of top-performing Airbnb properties in Lakeviewbased on Trailing Twelve Month (TTM) revenue. Analyze their characteristics, revenue, occupancy rate, and ADR to understand what drives success in this market.

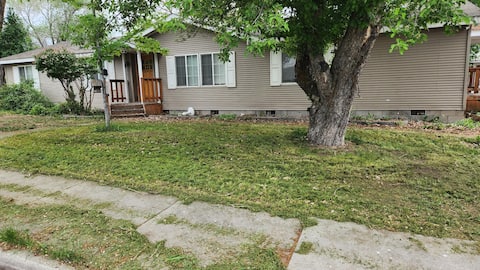
Relaxing country side getaway
Entire Place • 4 bedrooms
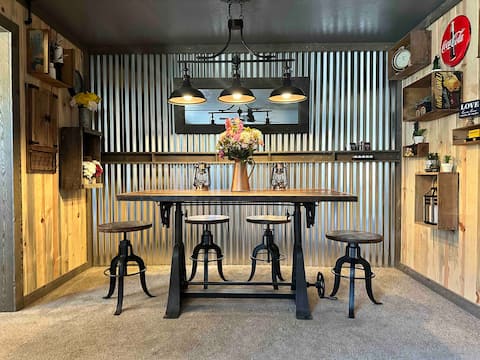
The Comfy Cowboy House
Entire Place • 2 bedrooms
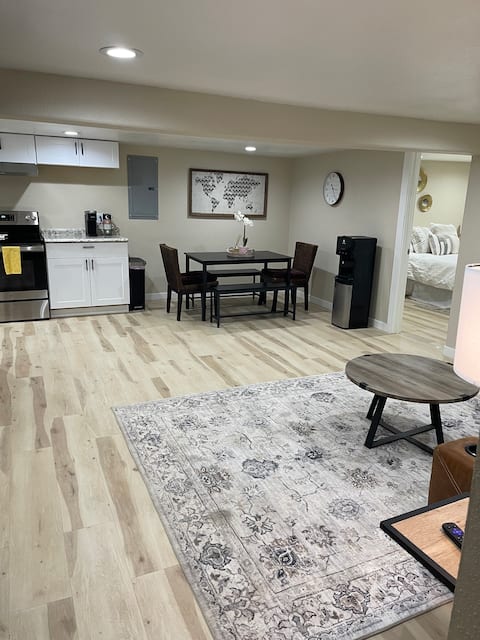
Mainstreet Stay
Entire Place • 2 bedrooms
Lakeview Lodge
Entire Place • 4 bedrooms
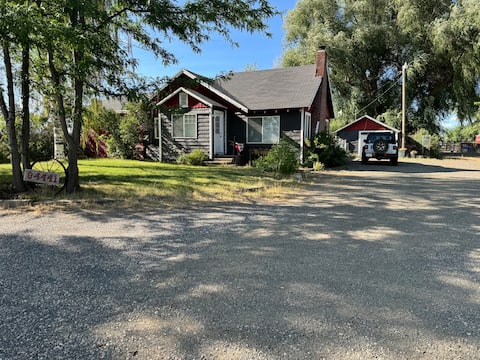
Toodies Farm. Quiet, private country side retreat
Entire Place • 2 bedrooms
Stoffel Airbnb Entire House (sleeps 5+)
Entire Place • 3 bedrooms
Note: Performance varies based on location, size, amenities, seasonality, and management quality. Data reflects the past 12 months.
Top Performing Airbnb Hosts in Lakeview (2025)
Learn from the best! This table showcases top-performing Airbnb hosts in Lakeview based on the number of properties managed and estimated total revenue over the past year. Analyze their scale and performance metrics.
| Host Name | Properties | Grossing Revenue | Stay Reviews | Avg Rating |
|---|---|---|---|---|
| Henry | 3 | $71,167 | 167 | 4.82/5.0 |
| Garrett | 2 | $39,767 | 73 | 4.91/5.0 |
| Diana | 1 | $33,904 | 60 | 4.97/5.0 |
| Cam | 2 | $29,140 | 215 | 4.92/5.0 |
| Frank | 1 | $28,326 | 3 | 5.00/5.0 |
| Sheila | 1 | $23,424 | 11 | 5.00/5.0 |
| Sharon | 1 | $18,962 | 129 | 4.71/5.0 |
| Nicole | 1 | $16,460 | 22 | 4.95/5.0 |
| Andrea | 1 | $15,670 | 98 | 4.89/5.0 |
| Patricia | 3 | $15,504 | 339 | 4.98/5.0 |
Analyzing the strategies of top hosts, such as their property selection, pricing, and guest communication, can offer valuable lessons for optimizing your own Airbnb operations in Lakeview.
Dive Deeper: Advanced Lakeview STR Market Data (2025)
Ready to unlock more insights? AirROI provides access to advanced metrics and comprehensive Airbnb data for Lakeview. Explore detailed analytics beyond this report to refine your investment strategy, optimize pricing, and maximize your vacation rental profits.
Explore Advanced MetricsLakeview Short-Term Rental Market Composition (2025): Property & Room Types
Room Type Distribution
Property Type Distribution
Market Composition Insights for Lakeview
- The Lakeview Airbnb market composition is heavily skewed towards Entire Home/Apt listings, which make up 100% of the 19 active rentals. This indicates strong guest preference for privacy and space.
- Looking at the property type distribution in Lakeview, House properties are the most common (52.6%), reflecting the local real estate landscape.
- Houses represent a significant 52.6% portion, catering likely to families or larger groups.
Lakeview Airbnb Room Capacity Analysis (2025): Bedroom Distribution
Distribution of Listings by Number of Bedrooms
Room Capacity Insights for Lakeview
- The dominant room capacity in Lakeview is 2 bedrooms listings, making up 36.8% of the market. This suggests a strong demand for properties suitable for couples or solo travelers.
- Together, 2 bedrooms and 1 bedroom properties represent 68.4% of the active Airbnb listings in Lakeview, indicating a high concentration in these sizes.
- A significant 31.6% of listings offer 3+ bedrooms, catering to larger groups and families seeking more space in Lakeview.
Lakeview Vacation Rental Guest Capacity Trends (2025)
Distribution of Listings by Guest Capacity
Guest Capacity Insights for Lakeview
- The most common guest capacity trend in Lakeview vacation rentals is listings accommodating 4 guests (26.3%). This suggests the primary traveler segment is likely small families or groups.
- Properties designed for 4 guests and 6 guests dominate the Lakeview STR market, accounting for 47.4% of listings.
- 42.2% of properties accommodate 6+ guests, serving the market segment for larger families or group travel in Lakeview.
- On average, properties in Lakeview are equipped to host 4.9 guests.
Lakeview Airbnb Booking Patterns (2025): Available vs. Booked Days
Available Days Distribution
Booked Days Distribution
Booking Pattern Insights for Lakeview
- The most common availability pattern in Lakeview falls within the 181-270 days range, representing 52.6% of listings. This suggests many properties have significant open periods on their calendars.
- Approximately 84.2% of listings show high availability (181+ days open annually), indicating potential for increased bookings or specific owner usage patterns.
- For booked days, the 91-180 days range is most frequent in Lakeview (57.9%), reflecting common guest stay durations or potential owner blocking patterns.
- A notable 15.8% of properties secure long booking periods (181+ days booked per year), highlighting successful long-term rental strategies or significant owner usage.
Lakeview Airbnb Minimum Stay Requirements Analysis
Distribution of Listings by Minimum Night Requirement
1 Night
11 listings
57.9% of total
2 Nights
8 listings
42.1% of total
Key Insights
- The most prevalent minimum stay requirement in Lakeview is 1 Night, adopted by 57.9% of listings. This highlights the market's preference for shorter, flexible bookings.
- A strong majority (100.0%) of the Lakeview Airbnb data shows acceptance of very short stays (1-2 nights), indicating a dynamic, high-turnover market.
Recommendations
- Align with the market by considering a 1 Night minimum stay, as 57.9% of Lakeview hosts use this setting.
- Adjust minimum nights based on seasonality – potentially shorter during low season and longer during peak demand periods in Lakeview.
Lakeview Airbnb Cancellation Policy Trends Analysis (2025)
Flexible
9 listings
47.4% of total
Moderate
9 listings
47.4% of total
Firm
1 listings
5.3% of total
Cancellation Policy Insights for Lakeview
- The prevailing Airbnb cancellation policy trend in Lakeview is Flexible, used by 47.4% of listings.
- The market strongly favors guest-friendly terms, with 94.8% of listings offering Flexible or Moderate policies. This suggests guests in Lakeview may expect booking flexibility.
Recommendations for Hosts
- Consider adopting a Flexible policy to align with the 47.4% market standard in Lakeview.
- Regularly review your cancellation policy against competitors and market demand shifts in Lakeview.
Lakeview STR Booking Lead Time Analysis (2025)
Average Booking Lead Time by Month
Booking Lead Time Insights for Lakeview
- The overall average booking lead time for vacation rentals in Lakeview is 27 days.
- Guests book furthest in advance for stays during August (average 48 days), likely coinciding with peak travel demand or local events.
- The shortest booking windows occur for stays in February (average 6 days), indicating more last-minute travel plans during this time.
- Seasonally, Summer (43 days avg.) sees the longest lead times, while Winter (10 days avg.) has the shortest, reflecting typical travel planning cycles.
Recommendations for Hosts
- Use the overall average lead time (27 days) as a baseline for your pricing and availability strategy in Lakeview.
- For August stays, consider implementing length-of-stay discounts or slightly higher rates for bookings made less than 48 days out to capitalize on advance planning.
- During February, focus on last-minute booking availability and promotions, as guests book with very short notice (6 days avg.).
- Target marketing efforts for the Summer season well in advance (at least 43 days) to capture early planners.
- Monitor your own booking lead times against these Lakeview averages to identify opportunities for dynamic pricing adjustments.
Popular & Essential Airbnb Amenities in Lakeview (2025)
Amenity Prevalence
Amenity Insights for Lakeview
- Essential amenities in Lakeview that guests expect include: Smoke alarm, Free parking on premises. Lacking these (any) could significantly impact bookings.
- Popular amenities like Kitchen, TV, Heating are common but not universal. Offering these can provide a competitive edge.
- Warning: Wifi is not universally provided but is considered essential globally. Ensure reliable Wifi is offered.
Recommendations for Hosts
- Ensure your listing includes all essential amenities for Lakeview: Smoke alarm, Free parking on premises.
- Consider adding popular differentiators like Kitchen or TV to increase appeal.
- Highlight unique or less common amenities you offer (e.g., hot tub, dedicated workspace, EV charger) in your listing description and photos.
- Regularly check competitor amenities in Lakeview to stay competitive.
Lakeview Airbnb Guest Demographics & Profile Analysis (2025)
Guest Profile Summary for Lakeview
- The typical guest profile for Airbnb in Lakeview consists of primarily domestic travelers (99%), often arriving from nearby Bend, typically belonging to the Post-2000s (Gen Z/Alpha) group (50%), primarily speaking English or Spanish.
- Domestic travelers account for 99.4% of guests.
- Key international markets include United States (99.4%) and United Kingdom (0.6%).
- Top languages spoken are English (79.8%) followed by Spanish (7.1%).
- A significant demographic segment is the Post-2000s (Gen Z/Alpha) group, representing 50% of guests.
Recommendations for Hosts
- Target domestic marketing efforts towards travelers from Bend and Portland.
- Tailor amenities and listing descriptions to appeal to the dominant Post-2000s (Gen Z/Alpha) demographic (e.g., highlight fast WiFi, smart home features, local guides).
- Highlight unique local experiences or amenities relevant to the primary guest profile.
- Consider seasonal promotions aligned with peak travel times for key origin markets.
Nearby Short-Term Rental Market Comparison
How does the Lakeview Airbnb market stack up against its neighbors? Compare key performance metrics like average monthly revenue, ADR, and occupancy rates in surrounding areas to understand the broader regional STR landscape.
| Market | Active Properties | Monthly Revenue | Daily Rate | Avg. Occupancy |
|---|---|---|---|---|
| Fort Klamath | 10 | $3,145 | $292.43 | 47% |
| Sunriver | 1,253 | $2,891 | $380.98 | 31% |
| Crescent | 51 | $2,561 | $262.98 | 40% |
| La Pine | 77 | $2,157 | $195.24 | 44% |
| Chiloquin | 60 | $1,914 | $194.10 | 42% |
| Hines | 19 | $1,845 | $122.99 | 50% |
| Alturas | 15 | $1,734 | $136.42 | 49% |
| Fall River Mills | 11 | $1,681 | $188.64 | 39% |
| Altamont | 24 | $1,661 | $159.06 | 51% |
| Klamath Falls | 191 | $1,552 | $186.98 | 41% |