Harbor Airbnb Market Analysis 2026: Short Term Rental Data & Vacation Rental Statistics in Oregon, United States
Is Airbnb profitable in Harbor in 2026? Explore comprehensive Airbnb analytics for Harbor, Oregon, United States to uncover income potential. This 2026 STR market report for Harbor, based on AirROI data from February 2025 to January 2026, reveals key trends in the niche market of 29 active listings.
Whether you're considering an Airbnb investment in Harbor, optimizing your existing vacation rental, or exploring rental arbitrage opportunities, understanding the Harbor Airbnb data is crucial. Understanding the local regulations is key to maximizing your short term rental income potential. Let's dive into the specifics.
Key Harbor Airbnb Performance Metrics Overview
Monthly Airbnb Revenue Variations & Income Potential in Harbor (2026)
Understanding the monthly revenue variations for Airbnb listings in Harbor is key to maximizing your short term rental income potential. Seasonality significantly impacts earnings. Our analysis, based on data from the past 12 months, shows that the peak revenue month for STRs in Harbor is typically July, while January often presents the lowest earnings, highlighting opportunities for strategic pricing adjustments during shoulder and low seasons. Explore the typical Airbnb income in Harbor across different performance tiers:
- Best-in-class properties (Top 10%) achieve $8,168+ monthly, often utilizing dynamic pricing and superior guest experiences.
- Strong performing properties (Top 25%) earn $5,861 or more, indicating effective management and desirable locations/amenities.
- Typical properties (Median) generate around $3,529 per month, representing the average market performance.
- Entry-level properties (Bottom 25%) see earnings around $2,119, often with potential for optimization.
Average Monthly Airbnb Earnings Trend in Harbor
Harbor Airbnb Occupancy Rate Trends (2026)
Maximize your bookings by understanding the Harbor STR occupancy trends. Seasonal demand shifts significantly influence how often properties are booked. Typically, Julysees the highest demand (peak season occupancy), while January experiences the lowest (low season). Effective strategies, like adjusting minimum stays or offering promotions, can boost occupancy during slower periods. Here's how different property tiers perform in Harbor:
- Best-in-class properties (Top 10%) achieve 76%+ occupancy, indicating high desirability and potentially optimized availability.
- Strong performing properties (Top 25%) maintain 67% or higher occupancy, suggesting good market fit and guest satisfaction.
- Typical properties (Median) have an occupancy rate around 52%.
- Entry-level properties (Bottom 25%) average 32% occupancy, potentially facing higher vacancy.
Average Monthly Occupancy Rate Trend in Harbor
Average Daily Rate (ADR) Airbnb Trends in Harbor (2026)
Effective short term rental pricing strategy in Harbor involves understanding monthly ADR fluctuations. The Average Daily Rate (ADR) for Airbnb in Harbor typically peaks in September and dips lowest during February. Leveraging Airbnb dynamic pricing tools or strategies based on this seasonality can significantly boost revenue. Here's a look at the typical nightly rates achieved:
- Best-in-class properties (Top 10%) command rates of $408+ per night, often due to premium features or locations.
- Strong performing properties (Top 25%) achieve nightly rates of $307 or more.
- Typical properties (Median) charge around $234 per night.
- Entry-level properties (Bottom 25%) earn around $172 per night.
Average Daily Rate (ADR) Trend by Month in Harbor
Get Live Harbor Market Intelligence 👇

Explore Real-time Analytics
Airbnb Seasonality Analysis & Trends in Harbor (2026)
Peak Season (July, August, June)
- Revenue averages $6,438 per month
- Occupancy rates average 66.0%
- Daily rates average $273
Shoulder Season
- Revenue averages $3,935 per month
- Occupancy maintains around 50.5%
- Daily rates hold near $243
Low Season (January, November, December)
- Revenue drops to average $2,330 per month
- Occupancy decreases to average 30.4%
- Daily rates adjust to average $256
Seasonality Insights for Harbor
- The Airbnb seasonality in Harbor shows highly seasonal trends requiring careful strategy. While the sections above show seasonal averages, it's also insightful to look at the extremes:
- During the high season, the absolute peak month showcases Harbor's highest earning potential, with monthly revenues capable of climbing to $6,888, occupancy reaching a high of 70.2%, and ADRs peaking at $281.
- Conversely, the slowest single month of the year, typically falling within the low season, marks the market's lowest point. In this month, revenue might dip to $1,901, occupancy could drop to 24.8%, and ADRs may adjust down to $221.
- Understanding both the seasonal averages and these monthly peaks and troughs in revenue, occupancy, and ADR is crucial for maximizing your Airbnb profit potential in Harbor.
Seasonal Strategies for Maximizing Profit
- Peak Season: Maximize revenue through premium pricing and potentially longer minimum stays. Ensure high availability.
- Low Season: Offer competitive pricing, special promotions (e.g., extended stay discounts), and flexible cancellation policies. Target off-season travelers like remote workers or budget-conscious guests.
- Shoulder Seasons: Implement dynamic pricing that balances peak and low rates. Target weekend travelers or specific events. Offer slightly more flexible terms than peak season.
- Regularly analyze your own performance against these Harbor seasonality benchmarks and adjust your pricing and availability strategy accordingly.
Best Areas for Airbnb Investment in Harbor (2026)
Exploring the top neighborhoods for short-term rentals in Harbor? This section highlights key areas, outlining why they are attractive for hosts and guests, along with notable local attractions. Consider these locations based on your target guest profile and investment strategy.
| Neighborhood / Area | Why Host Here? (Target Guests & Appeal) | Key Attractions & Landmarks |
|---|---|---|
| Old Town | Charming waterfront area with historic buildings and a picturesque harbor. Popular among visitors for its local shops, restaurants, and proximity to outdoor activities. | Humboldt Harbor, Historic Old Town, Local Art Galleries, Harbor Walk, Nearby Beaches |
| South Beach | Beautiful beaches and vibrant nightlife make this area attractive to tourists. Great for summer rentals, with water sports and dining options. | South Beach Park, Beachfront Boardwalk, Local Seafood Restaurants, Water Activities, Sunny Lifestyle |
| Boardman State Park | Natural beauty and outdoor activities draw visitors for camping and hiking. Perfect for those seeking adventure and tranquility. | Hiking Trails, Picnic Areas, Coastal Views, Wildlife Watching, Scenic Drives |
| Gold Beach | Known for its stunning beaches and access to the Rogue River. Attracts nature lovers and those looking to escape into nature. | Rogue River, Gold Beach, Beachcombing, Fishing, Nearby Wildlife Refuges |
| Brookings | Quaint coastal town with a beautiful harbor and laid-back atmosphere. Ideal for visitors looking to relax, fish, and enjoy nature. | Harbor Beach, Azalea Park, Hiking Trails, Fishing Spots, Beautiful Gardens |
| Pistol River | Scenic views and outdoor activities appeal to nature enthusiasts. Known for its beach and rugged coastline. | Pistol River State Scenic Viewpoint, Beach Access, Wind Surfing, Scenic Coastline, Wildlife Watching |
| Crescent City | Historic lighthouse and coastal scenery make this area attractive. It's a gateway for visitors to explore the Redwoods National Park. | Battery Point Lighthouse, Jedediah Smith Redwoods, Crescent Beach, Local Museums, Kayaking |
| Curry County | A diverse area that combines coastal beauty with historical elements. Popular for its outdoor activities and scenic drives. | Cape Blanco Lighthouse, Pelican State Beach, Golfing, Hiking Trails, Historical Sites |
Understanding Airbnb License Requirements & STR Laws in Harbor (2026)
With 17% of listings showing registration in 2026, understanding potential Airbnb license requirements is crucial in Harbor. Always verify the latest short term rental regulations and Airbnb license requirements directly with local government authorities for Harbor to ensure full compliance before hosting.
(Source: AirROI data, 2026, based on 17% licensed listings)
Top Performing Airbnb Properties in Harbor (2026)
Benchmark your potential! Explore examples of top-performing Airbnb properties in Harborbased on Trailing Twelve Month (TTM) revenue. Analyze their characteristics, revenue, occupancy rate, and ADR to understand what drives success in this market.
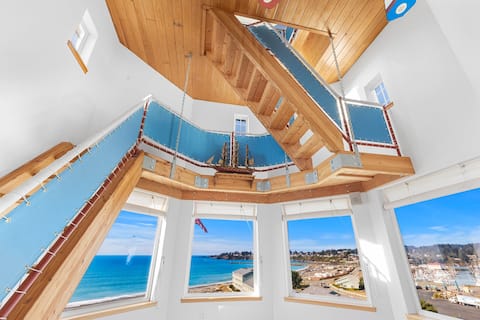
Stay in a working lighthouse!
Entire Place • 3 bedrooms

Pelican Path - Relax to the sounds of the Ocean
Entire Place • 3 bedrooms

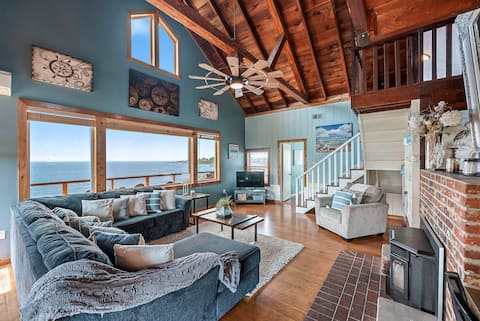
Coastal home w/ ocean views & fireplace
Entire Place • 5 bedrooms
Sunset Cabin w/Amazing Sea Views & Stairs to Beach
Entire Place • 2 bedrooms

🐳🧜🏽♀️Sea La’VIEWS OceanRiverHarborVIEWS *w/HotTub!
Entire Place • 3 bedrooms

Chetco Riverview! Rejuvenating Hot Tub! King Bed!
Entire Place • 2 bedrooms
Note: Performance varies based on location, size, amenities, seasonality, and management quality. Data reflects the past 12 months.
Top Performing Airbnb Hosts in Harbor (2026)
Learn from the best! This table showcases top-performing Airbnb hosts in Harbor based on the number of properties managed and estimated total revenue over the past year. Analyze their scale and performance metrics.
| Host Name | Properties | Grossing Revenue | Stay Reviews | Avg Rating |
|---|---|---|---|---|
| Shannon | 4 | $191,539 | 1019 | 4.97/5.0 |
| Bobbi | 3 | $138,781 | 294 | 4.91/5.0 |
| Premier Ocean | 4 | $112,883 | 131 | 4.52/5.0 |
| Katie | 1 | $101,555 | 83 | 4.96/5.0 |
| Lianne | 1 | $88,430 | 36 | 4.72/5.0 |
| Alice | 1 | $80,010 | 6 | 4.67/5.0 |
| David Charles | 1 | $61,069 | 62 | 5.00/5.0 |
| John | 1 | $55,591 | 137 | 4.86/5.0 |
| Debbie | 1 | $50,585 | 231 | 4.94/5.0 |
| Rachel And Bryon | 1 | $49,344 | 124 | 4.88/5.0 |
Analyzing the strategies of top hosts, such as their property selection, pricing, and guest communication, can offer valuable lessons for optimizing your own Airbnb operations in Harbor.
Dive Deeper: Advanced Harbor STR Market Data (2026)
Ready to unlock more insights? AirROI provides access to advanced metrics and comprehensive Airbnb data for Harbor. Explore detailed analytics beyond this report to refine your investment strategy, optimize pricing, and maximize your vacation rental profits.
Explore Advanced MetricsHarbor Short-Term Rental Market Composition (2026): Property & Room Types
Room Type Distribution
Property Type Distribution
Market Composition Insights for Harbor
- The Harbor Airbnb market composition is heavily skewed towards Entire Home/Apt listings, which make up 100% of the 29 active rentals. This indicates strong guest preference for privacy and space.
- Looking at the property type distribution in Harbor, House properties are the most common (69%), reflecting the local real estate landscape.
- Houses represent a significant 69% portion, catering likely to families or larger groups.
- The presence of 10.3% Hotel/Boutique listings indicates integration with traditional hospitality.
Harbor Airbnb Room Capacity Analysis (2026): Bedroom Distribution
Distribution of Listings by Number of Bedrooms
Room Capacity Insights for Harbor
- The dominant room capacity in Harbor is 2 bedrooms listings, making up 31% of the market. This suggests a strong demand for properties suitable for couples or solo travelers.
- Together, 2 bedrooms and 3 bedrooms properties represent 58.6% of the active Airbnb listings in Harbor, indicating a high concentration in these sizes.
- A significant 41.3% of listings offer 3+ bedrooms, catering to larger groups and families seeking more space in Harbor.
Harbor Vacation Rental Guest Capacity Trends (2026)
Distribution of Listings by Guest Capacity
Guest Capacity Insights for Harbor
- The most common guest capacity trend in Harbor vacation rentals is listings accommodating 8+ guests (31%). This suggests the primary traveler segment is likely larger groups.
- Properties designed for 8+ guests and 6 guests dominate the Harbor STR market, accounting for 62.0% of listings.
- 68.9% of properties accommodate 6+ guests, serving the market segment for larger families or group travel in Harbor.
- On average, properties in Harbor are equipped to host 5.6 guests.
Harbor Airbnb Booking Patterns (2026): Available vs. Booked Days
Available Days Distribution
Booked Days Distribution
Booking Pattern Insights for Harbor
- The most common availability pattern in Harbor falls within the 91-180 days range, representing 41.4% of listings. This suggests many properties have significant open periods on their calendars.
- Approximately 55.2% of listings show high availability (181+ days open annually), indicating potential for increased bookings or specific owner usage patterns.
- For booked days, the 181-270 days range is most frequent in Harbor (41.4%), reflecting common guest stay durations or potential owner blocking patterns.
- A notable 44.8% of properties secure long booking periods (181+ days booked per year), highlighting successful long-term rental strategies or significant owner usage.
Harbor Airbnb Minimum Stay Requirements Analysis
Distribution of Listings by Minimum Night Requirement
1 Night
9 listings
31% of total
2 Nights
8 listings
27.6% of total
3 Nights
2 listings
6.9% of total
7-29 Nights
1 listings
3.4% of total
30+ Nights
9 listings
31% of total
Key Insights
- The most prevalent minimum stay requirement in Harbor is 1 Night, adopted by 31% of listings. This highlights the market's preference for shorter, flexible bookings.
- A significant segment (31%) caters to monthly stays (30+ nights) in Harbor, pointing to opportunities in the extended-stay market.
Recommendations
- Align with the market by considering a 1 Night minimum stay, as 31% of Harbor hosts use this setting.
- Explore offering discounts for stays of 30+ nights to attract the 31% of the market seeking extended stays.
- Adjust minimum nights based on seasonality – potentially shorter during low season and longer during peak demand periods in Harbor.
Harbor Airbnb Cancellation Policy Trends Analysis (2026)
Limited
2 listings
6.9% of total
Flexible
3 listings
10.3% of total
Moderate
8 listings
27.6% of total
Firm
12 listings
41.4% of total
Strict
4 listings
13.8% of total
Cancellation Policy Insights for Harbor
- The prevailing Airbnb cancellation policy trend in Harbor is Firm, used by 41.4% of listings.
- A majority (55.2%) of hosts in Harbor utilize Firm or Strict policies, indicating a market where hosts prioritize booking security.
Recommendations for Hosts
- Consider adopting a Firm policy to align with the 41.4% market standard in Harbor.
- Using a Strict policy might deter some guests, as only 13.8% of listings use it. Evaluate if potential revenue protection outweighs possible lower booking rates.
- Regularly review your cancellation policy against competitors and market demand shifts in Harbor.
Harbor STR Booking Lead Time Analysis (2026)
Average Booking Lead Time by Month
Booking Lead Time Insights for Harbor
- The overall average booking lead time for vacation rentals in Harbor is 61 days.
- Guests book furthest in advance for stays during July (average 108 days), likely coinciding with peak travel demand or local events.
- The shortest booking windows occur for stays in March (average 37 days), indicating more last-minute travel plans during this time.
- Seasonally, Summer (88 days avg.) sees the longest lead times, while Winter (45 days avg.) has the shortest, reflecting typical travel planning cycles.
Recommendations for Hosts
- Use the overall average lead time (61 days) as a baseline for your pricing and availability strategy in Harbor.
- For July stays, consider implementing length-of-stay discounts or slightly higher rates for bookings made less than 108 days out to capitalize on advance planning.
- Target marketing efforts for the Summer season well in advance (at least 88 days) to capture early planners.
- Monitor your own booking lead times against these Harbor averages to identify opportunities for dynamic pricing adjustments.
Popular & Essential Airbnb Amenities in Harbor (2026)
Amenity Prevalence
Amenity Insights for Harbor
- Essential amenities in Harbor that guests expect include: TV, Hot water, Smoke alarm, Heating, Microwave, Bed linens, Wifi, Free parking on premises, Kitchen, Cooking basics. Lacking these (any) could significantly impact bookings.
Recommendations for Hosts
- Ensure your listing includes all essential amenities for Harbor: TV, Hot water, Smoke alarm, Heating, Microwave, Bed linens, Wifi, Free parking on premises, Kitchen, Cooking basics.
- Prioritize adding missing essentials: Kitchen, Cooking basics.
- Highlight unique or less common amenities you offer (e.g., hot tub, dedicated workspace, EV charger) in your listing description and photos.
- Regularly check competitor amenities in Harbor to stay competitive.
Harbor Airbnb Guest Demographics & Profile Analysis (2026)
Guest Profile Summary for Harbor
- The typical guest profile for Airbnb in Harbor consists of primarily domestic travelers (98%), often arriving from nearby Portland, typically belonging to the Post-2000s (Gen Z/Alpha) group (50%), primarily speaking English or Spanish.
- Domestic travelers account for 98.0% of guests.
- Key international markets include United States (98%) and Canada (1.3%).
- Top languages spoken are English (77.8%) followed by Spanish (11.1%).
- A significant demographic segment is the Post-2000s (Gen Z/Alpha) group, representing 50% of guests.
Recommendations for Hosts
- Target domestic marketing efforts towards travelers from Portland and Medford.
- Tailor amenities and listing descriptions to appeal to the dominant Post-2000s (Gen Z/Alpha) demographic (e.g., highlight fast WiFi, smart home features, local guides).
- Highlight unique local experiences or amenities relevant to the primary guest profile.
- Consider seasonal promotions aligned with peak travel times for key origin markets.
Nearby Short-Term Rental Market Comparison
How does the Harbor Airbnb market stack up against its neighbors? Compare key performance metrics like average monthly revenue, ADR, and occupancy rates in surrounding areas to understand the broader regional STR landscape.
| Market | Active Properties | Monthly Revenue | Daily Rate | Avg. Occupancy |
|---|---|---|---|---|
| Trinidad | 143 | $5,045 | $328.66 | 56% |
| Bandon | 158 | $4,810 | $403.75 | 41% |
| Orick | 37 | $3,818 | $302.81 | 43% |
| Smith River | 73 | $3,777 | $302.06 | 45% |
| Crescent City | 245 | $3,630 | $249.56 | 53% |
| Port Orford | 53 | $3,527 | $311.62 | 44% |
| Brookings | 135 | $3,412 | $284.11 | 45% |
| Dunes City | 34 | $3,211 | $297.23 | 41% |
| Langlois | 16 | $3,107 | $374.31 | 40% |
| Gasquet | 15 | $3,043 | $194.92 | 50% |