Government Camp Airbnb Market Analysis 2026: Short Term Rental Data & Vacation Rental Statistics in Oregon, United States
Is Airbnb profitable in Government Camp in 2026? Explore comprehensive Airbnb analytics for Government Camp, Oregon, United States to uncover income potential. This 2026 STR market report for Government Camp, based on AirROI data from February 2025 to January 2026, reveals key trends in the market of 219 active listings.
Whether you're considering an Airbnb investment in Government Camp, optimizing your existing vacation rental, or exploring rental arbitrage opportunities, understanding the Government Camp Airbnb data is crucial. Leveraging the low regulation environment is key to maximizing your short term rental income potential. Let's dive into the specifics.
Key Government Camp Airbnb Performance Metrics Overview
Monthly Airbnb Revenue Variations & Income Potential in Government Camp (2026)
Understanding the monthly revenue variations for Airbnb listings in Government Camp is key to maximizing your short term rental income potential. Seasonality significantly impacts earnings. Our analysis, based on data from the past 12 months, shows that the peak revenue month for STRs in Government Camp is typically December, while October often presents the lowest earnings, highlighting opportunities for strategic pricing adjustments during shoulder and low seasons. Explore the typical Airbnb income in Government Camp across different performance tiers:
- Best-in-class properties (Top 10%) achieve $9,170+ monthly, often utilizing dynamic pricing and superior guest experiences.
- Strong performing properties (Top 25%) earn $5,339 or more, indicating effective management and desirable locations/amenities.
- Typical properties (Median) generate around $2,892 per month, representing the average market performance.
- Entry-level properties (Bottom 25%) see earnings around $1,382, often with potential for optimization.
Average Monthly Airbnb Earnings Trend in Government Camp
Government Camp Airbnb Occupancy Rate Trends (2026)
Maximize your bookings by understanding the Government Camp STR occupancy trends. Seasonal demand shifts significantly influence how often properties are booked. Typically, Februarysees the highest demand (peak season occupancy), while September experiences the lowest (low season). Effective strategies, like adjusting minimum stays or offering promotions, can boost occupancy during slower periods. Here's how different property tiers perform in Government Camp:
- Best-in-class properties (Top 10%) achieve 65%+ occupancy, indicating high desirability and potentially optimized availability.
- Strong performing properties (Top 25%) maintain 43% or higher occupancy, suggesting good market fit and guest satisfaction.
- Typical properties (Median) have an occupancy rate around 25%.
- Entry-level properties (Bottom 25%) average 14% occupancy, potentially facing higher vacancy.
Average Monthly Occupancy Rate Trend in Government Camp
Average Daily Rate (ADR) Airbnb Trends in Government Camp (2026)
Effective short term rental pricing strategy in Government Camp involves understanding monthly ADR fluctuations. The Average Daily Rate (ADR) for Airbnb in Government Camp typically peaks in December and dips lowest during April. Leveraging Airbnb dynamic pricing tools or strategies based on this seasonality can significantly boost revenue. Here's a look at the typical nightly rates achieved:
- Best-in-class properties (Top 10%) command rates of $711+ per night, often due to premium features or locations.
- Strong performing properties (Top 25%) achieve nightly rates of $487 or more.
- Typical properties (Median) charge around $367 per night.
- Entry-level properties (Bottom 25%) earn around $286 per night.
Average Daily Rate (ADR) Trend by Month in Government Camp
Get Live Government Camp Market Intelligence 👇

Explore Real-time Analytics
Airbnb Seasonality Analysis & Trends in Government Camp (2026)
Peak Season (December, February, July)
- Revenue averages $5,371 per month
- Occupancy rates average 36.7%
- Daily rates average $468
Shoulder Season
- Revenue averages $4,424 per month
- Occupancy maintains around 31.5%
- Daily rates hold near $436
Low Season (April, September, October)
- Revenue drops to average $3,040 per month
- Occupancy decreases to average 24.5%
- Daily rates adjust to average $404
Seasonality Insights for Government Camp
- The Airbnb seasonality in Government Camp shows moderate seasonality with distinct peak and low periods. While the sections above show seasonal averages, it's also insightful to look at the extremes:
- During the high season, the absolute peak month showcases Government Camp's highest earning potential, with monthly revenues capable of climbing to $5,502, occupancy reaching a high of 43.1%, and ADRs peaking at $515.
- Conversely, the slowest single month of the year, typically falling within the low season, marks the market's lowest point. In this month, revenue might dip to $2,955, occupancy could drop to 23.9%, and ADRs may adjust down to $382.
- Understanding both the seasonal averages and these monthly peaks and troughs in revenue, occupancy, and ADR is crucial for maximizing your Airbnb profit potential in Government Camp.
Seasonal Strategies for Maximizing Profit
- Peak Season: Maximize revenue through premium pricing and potentially longer minimum stays. Ensure high availability.
- Low Season: Offer competitive pricing, special promotions (e.g., extended stay discounts), and flexible cancellation policies. Target off-season travelers like remote workers or budget-conscious guests.
- Shoulder Seasons: Implement dynamic pricing that balances peak and low rates. Target weekend travelers or specific events. Offer slightly more flexible terms than peak season.
- Regularly analyze your own performance against these Government Camp seasonality benchmarks and adjust your pricing and availability strategy accordingly.
Best Areas for Airbnb Investment in Government Camp (2026)
Exploring the top neighborhoods for short-term rentals in Government Camp? This section highlights key areas, outlining why they are attractive for hosts and guests, along with notable local attractions. Consider these locations based on your target guest profile and investment strategy.
| Neighborhood / Area | Why Host Here? (Target Guests & Appeal) | Key Attractions & Landmarks |
|---|---|---|
| Timberline Lodge | Historic lodge located on the slopes of Mount Hood, popular for skiing and winter sports. Attracts outdoor enthusiasts year-round with stunning views and year-round activities. | Timberline Ski Area, Mount Hood National Forest, Timberline Lodge, Palmer Snowfield, Mount Hood Meadows |
| Trillium Lake | Picturesque lake near Mt. Hood that offers camping, fishing, and hiking. Great for families and nature lovers, making it an appealing spot for Airbnb stays. | Trillium Lake, Mount Hood Scenic Byway, Hiking Trails, Fishing Spots, Picnic Areas |
| Government Camp | Quaint mountain village providing easy access to skiing and snowboarding. Strong demand for accommodations during winter months due to proximity to ski resorts. | Mount Hood Skibowl, Summit Ski Area, Government Camp Historical Museum, Year-round outdoor activities, Dining and shopping options |
| Mt. Hood National Forest | Stunning natural forest area featuring diverse camping and hiking opportunities. Perfect for people looking to escape to nature for a weekend or week-long getaway. | Hiking Trails, Camping Sites, Nature Viewing, Picnic Areas, Wildflower Blooms |
| Hood River | Nearby town renowned for windsurfing, hiking, and fruit orchards. Suitable for adventure seekers and those wanting to explore the Columbia River Gorge. | Columbia River Gorge, Hood River Fruit Loop, Windsurfing, Hood River Waterplay, Local Breweries |
| Sandy | Charming small town with easy access to both recreation and amenities. A mix of outdoor activities and local shopping makes it attractive for travelers. | Sandy River, Sandy Historical Museum, Local Parks, Hiking Trails, Outdoor Adventures |
| Welches | Located near the Mount Hood area, Welches offers a peaceful retreat surrounded by nature and easy access to outdoor recreational activities, appealing for family vacations. | Wildlife Viewing, Golfing, Hiking, Skiing Access, Nearby Restaurants |
| Dufur | Small rural town known for agricultural tours and scenic views. Perfect for those looking for a quiet getaway immersed in local culture and nature. | Dufur Valley, Local Farms, Cultural Tours, Fishing, Hiking Trails |
Understanding Airbnb License Requirements & STR Laws in Government Camp (2026)
While Government Camp, Oregon, United States currently shows low STR regulations, specific Airbnb license requirements might still exist or change. Always verify the latest short term rental regulations and Airbnb license requirements directly with local government authorities for Government Camp to ensure full compliance before hosting.
(Source: AirROI data, 2026, finding no licensed listings among those analyzed)
Top Performing Airbnb Properties in Government Camp (2026)
Benchmark your potential! Explore examples of top-performing Airbnb properties in Government Campbased on Trailing Twelve Month (TTM) revenue. Analyze their characteristics, revenue, occupancy rate, and ADR to understand what drives success in this market.
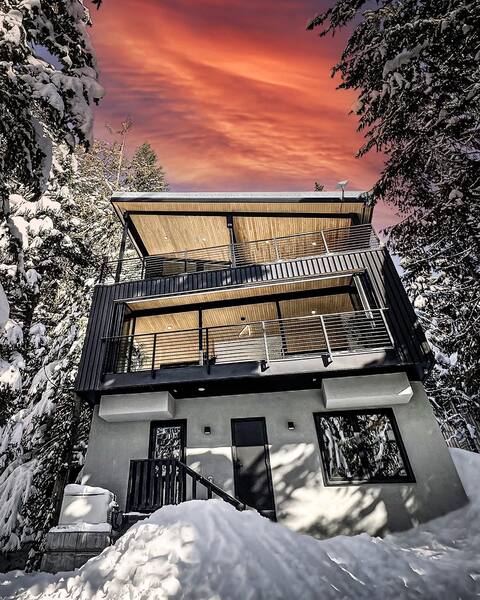
RAVN HAÜS – Oregon's Premier Alpine Retreat
Entire Place • 6 bedrooms
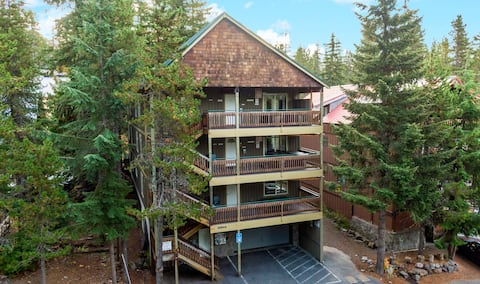
Boardwalk Lodge: Sleeps 44 maximum w/Two Hot Tubs
Entire Place • 9 bedrooms
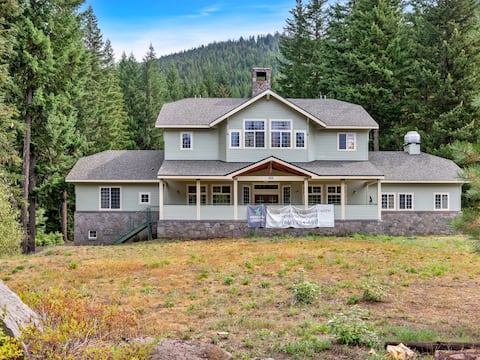
Government Camp Lodge's|Hot Tub|Room for Family
Entire Place • 12 bedrooms

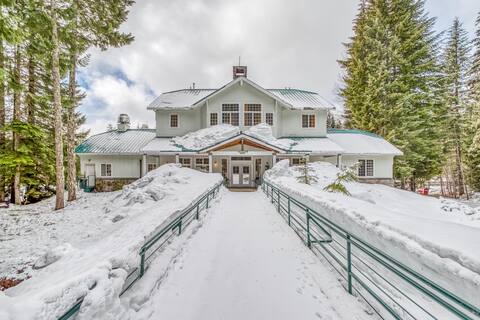
Great Blue Lodge - Scenic escape | Hot tub & sauna
Entire Place • 6 bedrooms
Government Camp, Hot Tub, Room for Whole Family!
Entire Place • 6 bedrooms

Luxury Lodge with Hot Tub & Cozy Mountain Vibes
Entire Place • 4 bedrooms
Note: Performance varies based on location, size, amenities, seasonality, and management quality. Data reflects the past 12 months.
Top Performing Airbnb Hosts in Government Camp (2026)
Learn from the best! This table showcases top-performing Airbnb hosts in Government Camp based on the number of properties managed and estimated total revenue over the past year. Analyze their scale and performance metrics.
| Host Name | Properties | Grossing Revenue | Stay Reviews | Avg Rating |
|---|---|---|---|---|
| Mt Hood | 12 | $1,084,178 | 161 | 4.56/5.0 |
| Mt Hood | 56 | $872,581 | 206 | 4.74/5.0 |
| ITrip Vacations | 8 | $539,228 | 137 | 4.76/5.0 |
| Mac | 2 | $381,103 | 145 | 4.96/5.0 |
| Carol | 8 | $379,009 | 136 | 4.56/5.0 |
| John | 1 | $246,645 | 55 | 5.00/5.0 |
| Joshua | 3 | $239,855 | 74 | 4.90/5.0 |
| Cascadia Getaways | 3 | $237,226 | 460 | 4.67/5.0 |
| Vacasa Oregon | 17 | $179,928 | 938 | 4.50/5.0 |
| Vacasa Oregon | 7 | $163,778 | 355 | 4.66/5.0 |
Analyzing the strategies of top hosts, such as their property selection, pricing, and guest communication, can offer valuable lessons for optimizing your own Airbnb operations in Government Camp.
Dive Deeper: Advanced Government Camp STR Market Data (2026)
Ready to unlock more insights? AirROI provides access to advanced metrics and comprehensive Airbnb data for Government Camp. Explore detailed analytics beyond this report to refine your investment strategy, optimize pricing, and maximize your vacation rental profits.
Explore Advanced MetricsGovernment Camp Short-Term Rental Market Composition (2026): Property & Room Types
Room Type Distribution
Property Type Distribution
Market Composition Insights for Government Camp
- The Government Camp Airbnb market composition is heavily skewed towards Entire Home/Apt listings, which make up 95% of the 219 active rentals. This indicates strong guest preference for privacy and space.
- Looking at the property type distribution in Government Camp, House properties are the most common (61.2%), reflecting the local real estate landscape.
- Houses represent a significant 61.2% portion, catering likely to families or larger groups.
- Smaller segments like hotel/boutique (combined 0.5%) offer potential for unique stay experiences.
Government Camp Airbnb Room Capacity Analysis (2026): Bedroom Distribution
Distribution of Listings by Number of Bedrooms
Room Capacity Insights for Government Camp
- The dominant room capacity in Government Camp is 3 bedrooms listings, making up 41.1% of the market. This suggests a strong demand for properties suitable for families or small groups.
- Together, 3 bedrooms and 2 bedrooms properties represent 66.2% of the active Airbnb listings in Government Camp, indicating a high concentration in these sizes.
- A significant 65.3% of listings offer 3+ bedrooms, catering to larger groups and families seeking more space in Government Camp.
Government Camp Vacation Rental Guest Capacity Trends (2026)
Distribution of Listings by Guest Capacity
Guest Capacity Insights for Government Camp
- The most common guest capacity trend in Government Camp vacation rentals is listings accommodating 8+ guests (59.4%). This suggests the primary traveler segment is likely larger groups.
- Properties designed for 8+ guests and 6 guests dominate the Government Camp STR market, accounting for 71.7% of listings.
- 81.3% of properties accommodate 6+ guests, serving the market segment for larger families or group travel in Government Camp.
- On average, properties in Government Camp are equipped to host 6.8 guests.
Government Camp Airbnb Booking Patterns (2026): Available vs. Booked Days
Available Days Distribution
Booked Days Distribution
Booking Pattern Insights for Government Camp
- The most common availability pattern in Government Camp falls within the 271-366 days range, representing 70.3% of listings. This suggests many properties have significant open periods on their calendars.
- Approximately 92.2% of listings show high availability (181+ days open annually), indicating potential for increased bookings or specific owner usage patterns.
- For booked days, the 31-90 days range is most frequent in Government Camp (40.2%), reflecting common guest stay durations or potential owner blocking patterns.
- A notable 8.7% of properties secure long booking periods (181+ days booked per year), highlighting successful long-term rental strategies or significant owner usage.
Government Camp Airbnb Minimum Stay Requirements Analysis
Distribution of Listings by Minimum Night Requirement
1 Night
18 listings
8.2% of total
2 Nights
95 listings
43.4% of total
3 Nights
4 listings
1.8% of total
4-6 Nights
3 listings
1.4% of total
30+ Nights
99 listings
45.2% of total
Key Insights
- The most prevalent minimum stay requirement in Government Camp is 30+ Nights, adopted by 45.2% of listings. This highlights the market's preference for longer commitments.
- A significant segment (45.2%) caters to monthly stays (30+ nights) in Government Camp, pointing to opportunities in the extended-stay market.
Recommendations
- Align with the market by considering a 30+ Nights minimum stay, as 45.2% of Government Camp hosts use this setting.
- If feasible, allowing 1-night stays, especially midweek or during low season, could capture last-minute bookings, as only 8.2% currently do.
- A 2-night minimum appears standard (43.4%). Consider this for weekends or peak periods.
- Explore offering discounts for stays of 30+ nights to attract the 45.2% of the market seeking extended stays.
- Adjust minimum nights based on seasonality – potentially shorter during low season and longer during peak demand periods in Government Camp.
Government Camp Airbnb Cancellation Policy Trends Analysis (2026)
Limited
4 listings
1.8% of total
Super Strict 60 Days
7 listings
3.2% of total
Super Strict 30 Days
84 listings
38.4% of total
Flexible
9 listings
4.1% of total
Moderate
46 listings
21% of total
Firm
49 listings
22.4% of total
Strict
20 listings
9.1% of total
Cancellation Policy Insights for Government Camp
- The prevailing Airbnb cancellation policy trend in Government Camp is Super Strict 30 Days, used by 38.4% of listings.
- There's a relatively balanced mix between guest-friendly (25.1%) and stricter (31.5%) policies, offering choices for different guest needs.
- Strict cancellation policies are quite rare (9.1%), potentially making listings with this policy less competitive unless justified by high demand or property type.
Recommendations for Hosts
- Consider adopting a Super Strict 30 Days policy to align with the 38.4% market standard in Government Camp.
- Using a Strict policy might deter some guests, as only 9.1% of listings use it. Evaluate if potential revenue protection outweighs possible lower booking rates.
- Regularly review your cancellation policy against competitors and market demand shifts in Government Camp.
Government Camp STR Booking Lead Time Analysis (2026)
Average Booking Lead Time by Month
Booking Lead Time Insights for Government Camp
- The overall average booking lead time for vacation rentals in Government Camp is 54 days.
- Guests book furthest in advance for stays during January (average 71 days), likely coinciding with peak travel demand or local events.
- The shortest booking windows occur for stays in May (average 42 days), indicating more last-minute travel plans during this time.
- Seasonally, Winter (70 days avg.) sees the longest lead times, while Spring (44 days avg.) has the shortest, reflecting typical travel planning cycles.
Recommendations for Hosts
- Use the overall average lead time (54 days) as a baseline for your pricing and availability strategy in Government Camp.
- For January stays, consider implementing length-of-stay discounts or slightly higher rates for bookings made less than 71 days out to capitalize on advance planning.
- Target marketing efforts for the Winter season well in advance (at least 70 days) to capture early planners.
- Monitor your own booking lead times against these Government Camp averages to identify opportunities for dynamic pricing adjustments.
Popular & Essential Airbnb Amenities in Government Camp (2026)
Amenity Prevalence
Amenity Insights for Government Camp
- Essential amenities in Government Camp that guests expect include: Smoke alarm, Wifi, Carbon monoxide alarm, Refrigerator, Kitchen, Heating, Coffee maker, Dishes and silverware, Microwave, TV. Lacking these (any) could significantly impact bookings.
Recommendations for Hosts
- Ensure your listing includes all essential amenities for Government Camp: Smoke alarm, Wifi, Carbon monoxide alarm, Refrigerator, Kitchen, Heating, Coffee maker, Dishes and silverware, Microwave, TV.
- Prioritize adding missing essentials: Wifi, Carbon monoxide alarm, Refrigerator, Kitchen, Heating, Coffee maker, Dishes and silverware, Microwave, TV.
- Highlight unique or less common amenities you offer (e.g., hot tub, dedicated workspace, EV charger) in your listing description and photos.
- Regularly check competitor amenities in Government Camp to stay competitive.
Government Camp Airbnb Guest Demographics & Profile Analysis (2026)
Guest Profile Summary for Government Camp
- The typical guest profile for Airbnb in Government Camp consists of primarily domestic travelers (97%), often arriving from nearby Portland, typically belonging to the Post-2000s (Gen Z/Alpha) group (50%), primarily speaking English or Spanish.
- Domestic travelers account for 97.1% of guests.
- Key international markets include United States (97.1%) and Canada (1.1%).
- Top languages spoken are English (68.2%) followed by Spanish (12%).
- A significant demographic segment is the Post-2000s (Gen Z/Alpha) group, representing 50% of guests.
Recommendations for Hosts
- Target domestic marketing efforts towards travelers from Portland and Seattle.
- Tailor amenities and listing descriptions to appeal to the dominant Post-2000s (Gen Z/Alpha) demographic (e.g., highlight fast WiFi, smart home features, local guides).
- Highlight unique local experiences or amenities relevant to the primary guest profile.
- Consider seasonal promotions aligned with peak travel times for key origin markets.
Nearby Short-Term Rental Market Comparison
How does the Government Camp Airbnb market stack up against its neighbors? Compare key performance metrics like average monthly revenue, ADR, and occupancy rates in surrounding areas to understand the broader regional STR landscape.
| Market | Active Properties | Monthly Revenue | Daily Rate | Avg. Occupancy |
|---|---|---|---|---|
| Mount Hood Village | 80 | $4,076 | $327.33 | 43% |
| Clackamas County | 19 | $3,781 | $324.73 | 45% |
| Ashford | 322 | $3,722 | $250.01 | 52% |
| Rhododendron | 220 | $3,432 | $299.94 | 44% |
| Detroit | 14 | $3,383 | $328.81 | 39% |
| Hood River | 208 | $3,346 | $345.38 | 42% |
| McKenzie Bridge | 41 | $3,310 | $286.77 | 41% |
| Powell Butte | 48 | $3,286 | $482.47 | 32% |
| Packwood | 333 | $3,268 | $261.31 | 45% |
| Washougal | 51 | $3,173 | $275.84 | 44% |