Gleneden Beach Airbnb Market Analysis 2026: Short Term Rental Data & Vacation Rental Statistics in Oregon, United States
Is Airbnb profitable in Gleneden Beach in 2026? Explore comprehensive Airbnb analytics for Gleneden Beach, Oregon, United States to uncover income potential. This 2026 STR market report for Gleneden Beach, based on AirROI data from February 2025 to January 2026, reveals key trends in the niche market of 25 active listings.
Whether you're considering an Airbnb investment in Gleneden Beach, optimizing your existing vacation rental, or exploring rental arbitrage opportunities, understanding the Gleneden Beach Airbnb data is crucial. Leveraging the low regulation environment is key to maximizing your short term rental income potential. Let's dive into the specifics.
Key Gleneden Beach Airbnb Performance Metrics Overview
Monthly Airbnb Revenue Variations & Income Potential in Gleneden Beach (2026)
Understanding the monthly revenue variations for Airbnb listings in Gleneden Beach is key to maximizing your short term rental income potential. Seasonality significantly impacts earnings. Our analysis, based on data from the past 12 months, shows that the peak revenue month for STRs in Gleneden Beach is typically July, while November often presents the lowest earnings, highlighting opportunities for strategic pricing adjustments during shoulder and low seasons. Explore the typical Airbnb income in Gleneden Beach across different performance tiers:
- Best-in-class properties (Top 10%) achieve $7,419+ monthly, often utilizing dynamic pricing and superior guest experiences.
- Strong performing properties (Top 25%) earn $3,789 or more, indicating effective management and desirable locations/amenities.
- Typical properties (Median) generate around $2,145 per month, representing the average market performance.
- Entry-level properties (Bottom 25%) see earnings around $1,157, often with potential for optimization.
Average Monthly Airbnb Earnings Trend in Gleneden Beach
Gleneden Beach Airbnb Occupancy Rate Trends (2026)
Maximize your bookings by understanding the Gleneden Beach STR occupancy trends. Seasonal demand shifts significantly influence how often properties are booked. Typically, Julysees the highest demand (peak season occupancy), while January experiences the lowest (low season). Effective strategies, like adjusting minimum stays or offering promotions, can boost occupancy during slower periods. Here's how different property tiers perform in Gleneden Beach:
- Best-in-class properties (Top 10%) achieve 65%+ occupancy, indicating high desirability and potentially optimized availability.
- Strong performing properties (Top 25%) maintain 45% or higher occupancy, suggesting good market fit and guest satisfaction.
- Typical properties (Median) have an occupancy rate around 27%.
- Entry-level properties (Bottom 25%) average 15% occupancy, potentially facing higher vacancy.
Average Monthly Occupancy Rate Trend in Gleneden Beach
Average Daily Rate (ADR) Airbnb Trends in Gleneden Beach (2026)
Effective short term rental pricing strategy in Gleneden Beach involves understanding monthly ADR fluctuations. The Average Daily Rate (ADR) for Airbnb in Gleneden Beach typically peaks in July and dips lowest during February. Leveraging Airbnb dynamic pricing tools or strategies based on this seasonality can significantly boost revenue. Here's a look at the typical nightly rates achieved:
- Best-in-class properties (Top 10%) command rates of $501+ per night, often due to premium features or locations.
- Strong performing properties (Top 25%) achieve nightly rates of $314 or more.
- Typical properties (Median) charge around $252 per night.
- Entry-level properties (Bottom 25%) earn around $194 per night.
Average Daily Rate (ADR) Trend by Month in Gleneden Beach
Get Live Gleneden Beach Market Intelligence 👇

Explore Real-time Analytics
Airbnb Seasonality Analysis & Trends in Gleneden Beach (2026)
Peak Season (July, August, June)
- Revenue averages $5,723 per month
- Occupancy rates average 47.9%
- Daily rates average $364
Shoulder Season
- Revenue averages $2,750 per month
- Occupancy maintains around 28.6%
- Daily rates hold near $273
Low Season (January, February, November)
- Revenue drops to average $2,109 per month
- Occupancy decreases to average 24.1%
- Daily rates adjust to average $265
Seasonality Insights for Gleneden Beach
- The Airbnb seasonality in Gleneden Beach shows highly seasonal trends requiring careful strategy. While the sections above show seasonal averages, it's also insightful to look at the extremes:
- During the high season, the absolute peak month showcases Gleneden Beach's highest earning potential, with monthly revenues capable of climbing to $6,729, occupancy reaching a high of 54.8%, and ADRs peaking at $379.
- Conversely, the slowest single month of the year, typically falling within the low season, marks the market's lowest point. In this month, revenue might dip to $2,053, occupancy could drop to 22.1%, and ADRs may adjust down to $219.
- Understanding both the seasonal averages and these monthly peaks and troughs in revenue, occupancy, and ADR is crucial for maximizing your Airbnb profit potential in Gleneden Beach.
Seasonal Strategies for Maximizing Profit
- Peak Season: Maximize revenue through premium pricing and potentially longer minimum stays. Ensure high availability.
- Low Season: Offer competitive pricing, special promotions (e.g., extended stay discounts), and flexible cancellation policies. Target off-season travelers like remote workers or budget-conscious guests.
- Shoulder Seasons: Implement dynamic pricing that balances peak and low rates. Target weekend travelers or specific events. Offer slightly more flexible terms than peak season.
- Regularly analyze your own performance against these Gleneden Beach seasonality benchmarks and adjust your pricing and availability strategy accordingly.
Best Areas for Airbnb Investment in Gleneden Beach (2026)
Exploring the top neighborhoods for short-term rentals in Gleneden Beach? This section highlights key areas, outlining why they are attractive for hosts and guests, along with notable local attractions. Consider these locations based on your target guest profile and investment strategy.
| Neighborhood / Area | Why Host Here? (Target Guests & Appeal) | Key Attractions & Landmarks |
|---|---|---|
| Salishan | A beautiful coastal community known for its luxurious resort and golf course, attracting vacationers who enjoy serenity and nature. | Salishan Spa, Golf Course, Nature Trails, Beach Access |
| Lincoln City | A nearby city with a bustling beach atmosphere and various activities for visitors, making it an appealing spot for vacation rentals. | Devil's Lake State Recreation Area, Lincoln City Outlets, Chinook Winds Casino, Beaches |
| Otter Rock | A small coastal village known for its scenic views and access to Devils Punchbowl, perfect for nature lovers and families. | Devils Punch Bowl State Natural Area, Otter Crest Loop, Beaches |
| Depoe Bay | Famous for whale watching and its charming harbor, a great location for travelers seeking unique maritime experiences. | Whale Watching Tours, Depoe Bay Aquarium, Boiler Bay State Scenic Viewpoint |
| Pacific City | Known for its stunning coastal cliffs and unique sand dune formations, ideal for outdoor enthusiasts and photographers. | Cape Kiwanda State Natural Area, Sand Dunes, Beaches |
| Newport | A larger coastal town with an aquarium, shops, and restaurants, attracting more families and tourists looking for activities. | Oregon Coast Aquarium, Yaquina Head Lighthouse, Newport Historic Bayfront |
| Yachats | A picturesque coastal town known for its scenic beauty and hiking opportunities, appealing to nature lovers and quiet retreats. | Cape Perpetua Scenic Area, Yachats Ocean Road State Natural Site, Yachats River |
| Siletz Bay | A bay area that's perfect for fishing, kayaking, and outdoor activities; attractive to those looking for a peaceful getaway. | Siletz Bay National Wildlife Refuge, Fishing, Kayaking |
Understanding Airbnb License Requirements & STR Laws in Gleneden Beach (2026)
While Gleneden Beach, Oregon, United States currently shows low STR regulations, specific Airbnb license requirements might still exist or change. Always verify the latest short term rental regulations and Airbnb license requirements directly with local government authorities for Gleneden Beach to ensure full compliance before hosting.
(Source: AirROI data, 2026, finding no licensed listings among those analyzed)
Top Performing Airbnb Properties in Gleneden Beach (2026)
Benchmark your potential! Explore examples of top-performing Airbnb properties in Gleneden Beachbased on Trailing Twelve Month (TTM) revenue. Analyze their characteristics, revenue, occupancy rate, and ADR to understand what drives success in this market.
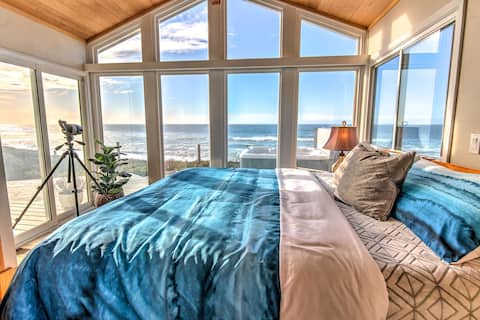
Ocean Front! Hot Tub! Dog Friendly! ~ King Neptune
Entire Place • 4 bedrooms
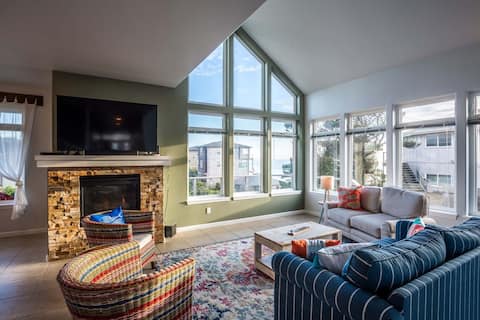
Ocean View,Sandy Beach! Hot Tub! Dog Friendly!
Entire Place • 4 bedrooms

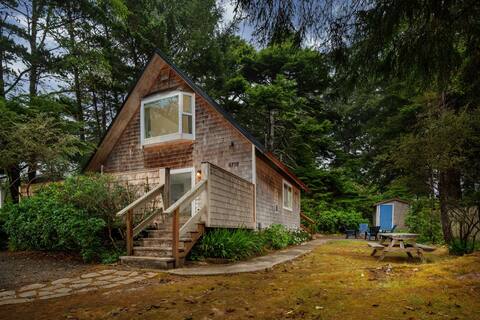
Beachfront Bungalow
Entire Place • 2 bedrooms
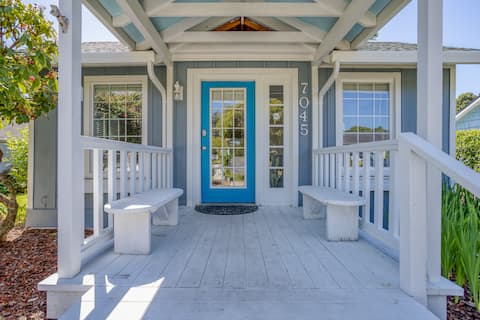
Cottage, Pet Friendly, Beach, Jacuzzi, Fire-Pit
Entire Place • 2 bedrooms
Gleneden Beach-Fire Pit-Grill-Large Fenced Yard
Entire Place • 2 bedrooms

Perfect 1BR Oceanfront | Fireplace | Balcony
Entire Place • 1 bedroom
Note: Performance varies based on location, size, amenities, seasonality, and management quality. Data reflects the past 12 months.
Top Performing Airbnb Hosts in Gleneden Beach (2026)
Learn from the best! This table showcases top-performing Airbnb hosts in Gleneden Beach based on the number of properties managed and estimated total revenue over the past year. Analyze their scale and performance metrics.
| Host Name | Properties | Grossing Revenue | Stay Reviews | Avg Rating |
|---|---|---|---|---|
| Sweet Homes | 2 | $275,474 | 158 | 4.67/5.0 |
| Vacasa Oregon | 8 | $178,804 | 813 | 4.50/5.0 |
| Lisa Janelle | 6 | $99,884 | 217 | 4.67/5.0 |
| Glenna | 1 | $83,419 | 214 | 4.95/5.0 |
| ITrip Vacations | 1 | $51,995 | 173 | 4.68/5.0 |
| Vacasa | 3 | $43,735 | 163 | 4.59/5.0 |
| Meredith | 1 | $40,039 | 94 | 4.69/5.0 |
| Vacasa Oregon | 2 | $20,611 | 123 | 4.62/5.0 |
| Vacasa Oregon | 1 | $9,283 | 156 | 4.46/5.0 |
Analyzing the strategies of top hosts, such as their property selection, pricing, and guest communication, can offer valuable lessons for optimizing your own Airbnb operations in Gleneden Beach.
Dive Deeper: Advanced Gleneden Beach STR Market Data (2026)
Ready to unlock more insights? AirROI provides access to advanced metrics and comprehensive Airbnb data for Gleneden Beach. Explore detailed analytics beyond this report to refine your investment strategy, optimize pricing, and maximize your vacation rental profits.
Explore Advanced MetricsGleneden Beach Short-Term Rental Market Composition (2026): Property & Room Types
Room Type Distribution
Property Type Distribution
Market Composition Insights for Gleneden Beach
- The Gleneden Beach Airbnb market composition is heavily skewed towards Entire Home/Apt listings, which make up 100% of the 25 active rentals. This indicates strong guest preference for privacy and space.
- Looking at the property type distribution in Gleneden Beach, House properties are the most common (72%), reflecting the local real estate landscape.
- Houses represent a significant 72% portion, catering likely to families or larger groups.
- Smaller segments like outdoor/unique (combined 4.0%) offer potential for unique stay experiences.
Gleneden Beach Airbnb Room Capacity Analysis (2026): Bedroom Distribution
Distribution of Listings by Number of Bedrooms
Room Capacity Insights for Gleneden Beach
- The dominant room capacity in Gleneden Beach is 2 bedrooms listings, making up 48% of the market. This suggests a strong demand for properties suitable for couples or solo travelers.
- Together, 2 bedrooms and 3 bedrooms properties represent 76.0% of the active Airbnb listings in Gleneden Beach, indicating a high concentration in these sizes.
- A significant 48.0% of listings offer 3+ bedrooms, catering to larger groups and families seeking more space in Gleneden Beach.
Gleneden Beach Vacation Rental Guest Capacity Trends (2026)
Distribution of Listings by Guest Capacity
Guest Capacity Insights for Gleneden Beach
- The most common guest capacity trend in Gleneden Beach vacation rentals is listings accommodating 8+ guests (40%). This suggests the primary traveler segment is likely larger groups.
- Properties designed for 8+ guests and 6 guests dominate the Gleneden Beach STR market, accounting for 76.0% of listings.
- 76.0% of properties accommodate 6+ guests, serving the market segment for larger families or group travel in Gleneden Beach.
- On average, properties in Gleneden Beach are equipped to host 6.3 guests.
Gleneden Beach Airbnb Booking Patterns (2026): Available vs. Booked Days
Available Days Distribution
Booked Days Distribution
Booking Pattern Insights for Gleneden Beach
- The most common availability pattern in Gleneden Beach falls within the 271-366 days range, representing 56% of listings. This suggests many properties have significant open periods on their calendars.
- Approximately 88.0% of listings show high availability (181+ days open annually), indicating potential for increased bookings or specific owner usage patterns.
- For booked days, the 31-90 days range is most frequent in Gleneden Beach (44%), reflecting common guest stay durations or potential owner blocking patterns.
- A notable 12.0% of properties secure long booking periods (181+ days booked per year), highlighting successful long-term rental strategies or significant owner usage.
Gleneden Beach Airbnb Minimum Stay Requirements Analysis
Distribution of Listings by Minimum Night Requirement
1 Night
1 listings
4% of total
2 Nights
13 listings
52% of total
3 Nights
6 listings
24% of total
30+ Nights
5 listings
20% of total
Key Insights
- The most prevalent minimum stay requirement in Gleneden Beach is 2 Nights, adopted by 52% of listings. This highlights the market's preference for shorter, flexible bookings.
- A significant segment (20%) caters to monthly stays (30+ nights) in Gleneden Beach, pointing to opportunities in the extended-stay market.
Recommendations
- Align with the market by considering a 2 Nights minimum stay, as 52% of Gleneden Beach hosts use this setting.
- If feasible, allowing 1-night stays, especially midweek or during low season, could capture last-minute bookings, as only 4% currently do.
- A 2-night minimum appears standard (52%). Consider this for weekends or peak periods.
- Explore offering discounts for stays of 30+ nights to attract the 20% of the market seeking extended stays.
- Adjust minimum nights based on seasonality – potentially shorter during low season and longer during peak demand periods in Gleneden Beach.
Gleneden Beach Airbnb Cancellation Policy Trends Analysis (2026)
Super Strict 30 Days
7 listings
28% of total
Super Strict 60 Days
2 listings
8% of total
Moderate
4 listings
16% of total
Firm
8 listings
32% of total
Strict
4 listings
16% of total
Cancellation Policy Insights for Gleneden Beach
- The prevailing Airbnb cancellation policy trend in Gleneden Beach is Firm, used by 32% of listings.
- There's a relatively balanced mix between guest-friendly (16.0%) and stricter (48.0%) policies, offering choices for different guest needs.
Recommendations for Hosts
- Consider adopting a Firm policy to align with the 32% market standard in Gleneden Beach.
- Regularly review your cancellation policy against competitors and market demand shifts in Gleneden Beach.
Gleneden Beach STR Booking Lead Time Analysis (2026)
Average Booking Lead Time by Month
Booking Lead Time Insights for Gleneden Beach
- The overall average booking lead time for vacation rentals in Gleneden Beach is 66 days.
- Guests book furthest in advance for stays during January (average 97 days), likely coinciding with peak travel demand or local events.
- The shortest booking windows occur for stays in June (average 54 days), indicating more last-minute travel plans during this time.
- Seasonally, Winter (77 days avg.) sees the longest lead times, while Summer (62 days avg.) has the shortest, reflecting typical travel planning cycles.
Recommendations for Hosts
- Use the overall average lead time (66 days) as a baseline for your pricing and availability strategy in Gleneden Beach.
- For January stays, consider implementing length-of-stay discounts or slightly higher rates for bookings made less than 97 days out to capitalize on advance planning.
- Target marketing efforts for the Winter season well in advance (at least 77 days) to capture early planners.
- Monitor your own booking lead times against these Gleneden Beach averages to identify opportunities for dynamic pricing adjustments.
Popular & Essential Airbnb Amenities in Gleneden Beach (2026)
Amenity Prevalence
Amenity Insights for Gleneden Beach
- Essential amenities in Gleneden Beach that guests expect include: Wifi, Heating, Free parking on premises, Smoke alarm, TV, Private entrance, Essentials, Kitchen, Refrigerator, Shampoo. Lacking these (any) could significantly impact bookings.
Recommendations for Hosts
- Ensure your listing includes all essential amenities for Gleneden Beach: Wifi, Heating, Free parking on premises, Smoke alarm, TV, Private entrance, Essentials, Kitchen, Refrigerator, Shampoo.
- Prioritize adding missing essentials: Refrigerator, Shampoo.
- Highlight unique or less common amenities you offer (e.g., hot tub, dedicated workspace, EV charger) in your listing description and photos.
- Regularly check competitor amenities in Gleneden Beach to stay competitive.
Gleneden Beach Airbnb Guest Demographics & Profile Analysis (2026)
Guest Profile Summary for Gleneden Beach
- The typical guest profile for Airbnb in Gleneden Beach consists of primarily domestic travelers (98%), often arriving from nearby Portland, typically belonging to the Post-2000s (Gen Z/Alpha) group (50%), primarily speaking English or Spanish.
- Domestic travelers account for 98.0% of guests.
- Key international markets include United States (98%) and Germany (0.7%).
- Top languages spoken are English (76.9%) followed by Spanish (7.7%).
- A significant demographic segment is the Post-2000s (Gen Z/Alpha) group, representing 50% of guests.
Recommendations for Hosts
- Target domestic marketing efforts towards travelers from Portland and Salem.
- Tailor amenities and listing descriptions to appeal to the dominant Post-2000s (Gen Z/Alpha) demographic (e.g., highlight fast WiFi, smart home features, local guides).
- Highlight unique local experiences or amenities relevant to the primary guest profile.
- Consider seasonal promotions aligned with peak travel times for key origin markets.
Nearby Short-Term Rental Market Comparison
How does the Gleneden Beach Airbnb market stack up against its neighbors? Compare key performance metrics like average monthly revenue, ADR, and occupancy rates in surrounding areas to understand the broader regional STR landscape.
| Market | Active Properties | Monthly Revenue | Daily Rate | Avg. Occupancy |
|---|---|---|---|---|
| Arch Cape | 78 | $7,909 | $512.29 | 53% |
| South Beach | 10 | $6,948 | $417.34 | 51% |
| Manzanita | 288 | $5,262 | $395.19 | 43% |
| Cannon Beach | 226 | $5,178 | $436.27 | 46% |
| Seal Rock | 39 | $4,852 | $371.44 | 47% |
| Bandon | 158 | $4,810 | $403.75 | 41% |
| Dundee | 71 | $4,771 | $426.97 | 35% |
| Lincoln County | 10 | $4,478 | $377.82 | 41% |
| Yachats | 183 | $4,296 | $287.72 | 48% |
| Nehalem | 100 | $4,215 | $369.69 | 42% |