Eugene Airbnb Market Analysis 2026: Short Term Rental Data & Vacation Rental Statistics in Oregon, United States
Is Airbnb profitable in Eugene in 2026? Explore comprehensive Airbnb analytics for Eugene, Oregon, United States to uncover income potential. This 2026 STR market report for Eugene, based on AirROI data from February 2025 to January 2026, reveals key trends in the bustling market of 1,283 active listings.
Whether you're considering an Airbnb investment in Eugene, optimizing your existing vacation rental, or exploring rental arbitrage opportunities, understanding the Eugene Airbnb data is crucial. Leveraging the low regulation environment is key to maximizing your short term rental income potential. Let's dive into the specifics.
Key Eugene Airbnb Performance Metrics Overview
Monthly Airbnb Revenue Variations & Income Potential in Eugene (2026)
Understanding the monthly revenue variations for Airbnb listings in Eugene is key to maximizing your short term rental income potential. Seasonality significantly impacts earnings. Our analysis, based on data from the past 12 months, shows that the peak revenue month for STRs in Eugene is typically June, while February often presents the lowest earnings, highlighting opportunities for strategic pricing adjustments during shoulder and low seasons. Explore the typical Airbnb income in Eugene across different performance tiers:
- Best-in-class properties (Top 10%) achieve $6,422+ monthly, often utilizing dynamic pricing and superior guest experiences.
- Strong performing properties (Top 25%) earn $3,828 or more, indicating effective management and desirable locations/amenities.
- Typical properties (Median) generate around $2,259 per month, representing the average market performance.
- Entry-level properties (Bottom 25%) see earnings around $1,231, often with potential for optimization.
Average Monthly Airbnb Earnings Trend in Eugene
Eugene Airbnb Occupancy Rate Trends (2026)
Maximize your bookings by understanding the Eugene STR occupancy trends. Seasonal demand shifts significantly influence how often properties are booked. Typically, Julysees the highest demand (peak season occupancy), while January experiences the lowest (low season). Effective strategies, like adjusting minimum stays or offering promotions, can boost occupancy during slower periods. Here's how different property tiers perform in Eugene:
- Best-in-class properties (Top 10%) achieve 81%+ occupancy, indicating high desirability and potentially optimized availability.
- Strong performing properties (Top 25%) maintain 64% or higher occupancy, suggesting good market fit and guest satisfaction.
- Typical properties (Median) have an occupancy rate around 42%.
- Entry-level properties (Bottom 25%) average 22% occupancy, potentially facing higher vacancy.
Average Monthly Occupancy Rate Trend in Eugene
Average Daily Rate (ADR) Airbnb Trends in Eugene (2026)
Effective short term rental pricing strategy in Eugene involves understanding monthly ADR fluctuations. The Average Daily Rate (ADR) for Airbnb in Eugene typically peaks in June and dips lowest during February. Leveraging Airbnb dynamic pricing tools or strategies based on this seasonality can significantly boost revenue. Here's a look at the typical nightly rates achieved:
- Best-in-class properties (Top 10%) command rates of $556+ per night, often due to premium features or locations.
- Strong performing properties (Top 25%) achieve nightly rates of $311 or more.
- Typical properties (Median) charge around $178 per night.
- Entry-level properties (Bottom 25%) earn around $114 per night.
Average Daily Rate (ADR) Trend by Month in Eugene
Get Live Eugene Market Intelligence 👇

Explore Real-time Analytics
Airbnb Seasonality Analysis & Trends in Eugene (2026)
Peak Season (June, July, September)
- Revenue averages $4,300 per month
- Occupancy rates average 52.9%
- Daily rates average $293
Shoulder Season
- Revenue averages $3,126 per month
- Occupancy maintains around 42.9%
- Daily rates hold near $275
Low Season (January, February, March)
- Revenue drops to average $2,122 per month
- Occupancy decreases to average 38.2%
- Daily rates adjust to average $253
Seasonality Insights for Eugene
- The Airbnb seasonality in Eugene shows highly seasonal trends requiring careful strategy. While the sections above show seasonal averages, it's also insightful to look at the extremes:
- During the high season, the absolute peak month showcases Eugene's highest earning potential, with monthly revenues capable of climbing to $4,875, occupancy reaching a high of 54.8%, and ADRs peaking at $307.
- Conversely, the slowest single month of the year, typically falling within the low season, marks the market's lowest point. In this month, revenue might dip to $1,920, occupancy could drop to 30.7%, and ADRs may adjust down to $247.
- Understanding both the seasonal averages and these monthly peaks and troughs in revenue, occupancy, and ADR is crucial for maximizing your Airbnb profit potential in Eugene.
Seasonal Strategies for Maximizing Profit
- Peak Season: Maximize revenue through premium pricing and potentially longer minimum stays. Ensure high availability.
- Low Season: Offer competitive pricing, special promotions (e.g., extended stay discounts), and flexible cancellation policies. Target off-season travelers like remote workers or budget-conscious guests.
- Shoulder Seasons: Implement dynamic pricing that balances peak and low rates. Target weekend travelers or specific events. Offer slightly more flexible terms than peak season.
- Regularly analyze your own performance against these Eugene seasonality benchmarks and adjust your pricing and availability strategy accordingly.
Best Areas for Airbnb Investment in Eugene (2026)
Exploring the top neighborhoods for short-term rentals in Eugene? This section highlights key areas, outlining why they are attractive for hosts and guests, along with notable local attractions. Consider these locations based on your target guest profile and investment strategy.
| Neighborhood / Area | Why Host Here? (Target Guests & Appeal) | Key Attractions & Landmarks |
|---|---|---|
| Downtown Eugene | Vibrant city center with a mix of culture, dining, and nightlife. Ideal for visitors wanting to explore local attractions and enjoy the urban environment. | Hult Center for the Performing Arts, Saturday Market, Eugene Public Library, local breweries and restaurants, University of Oregon |
| South Eugene | Known for its beautiful neighborhoods, parks, and access to hiking trails. Popular with families and those looking for a quieter, scenic escape. | Hendricks Park, Skinner Butte Park, Owen Rose Garden, Amazon Park, local coffee shops |
| Northwest Eugene | A residential area close to the Willamette River and bike paths, attracting visitors who enjoy outdoor activities and nature. | Willamette River bike paths, Cascades Raptor Center, Howard Buford Recreation Area, local markets, parks |
| University District | Home to the University of Oregon, attracting students, families, and visitors for events and college sports. | Autzen Stadium, Jordan Schnitzer Museum of Art, University of Oregon campus, local eateries, bookstores |
| River Road | Family-friendly area with access to natural beauty and parks, appealing to visitors looking for a laid-back atmosphere. | Delta Ponds, Riverbank parks, local shopping areas, trails along the river, community events |
| West Eugene | Expanding area with potential for development and close to parks and nature reserves, attractive for those looking for affordable options. | Fern Ridge Reservoir, local farm-to-table restaurants, parks and outdoor spaces, roadside markets |
| Benton County | Nearby county with charming small towns and rural landscapes, attracting visitors interested in wine country and outdoor adventures. | Oregon wine country, hiking trails, local farms, scenic drives, cultural events |
| North Eugene | Growing area with attractive housing options and close proximity to amenities, appealing to leisure travelers and families. | parks and recreation areas, shopping centers, community events, easy access to the highway, local festivals |
Understanding Airbnb License Requirements & STR Laws in Eugene (2026)
While Eugene, Oregon, United States currently shows low STR regulations, specific Airbnb license requirements might still exist or change. Always verify the latest short term rental regulations and Airbnb license requirements directly with local government authorities for Eugene to ensure full compliance before hosting.
(Source: AirROI data, 2026, based on 1% licensed listings)
Top Performing Airbnb Properties in Eugene (2026)
Benchmark your potential! Explore examples of top-performing Airbnb properties in Eugenebased on Trailing Twelve Month (TTM) revenue. Analyze their characteristics, revenue, occupancy rate, and ADR to understand what drives success in this market.
Riverpath Inn
Entire Place • 7 bedrooms

Huge, 16 Room Property - 376 Eugene House
Private Room • 16 bedrooms
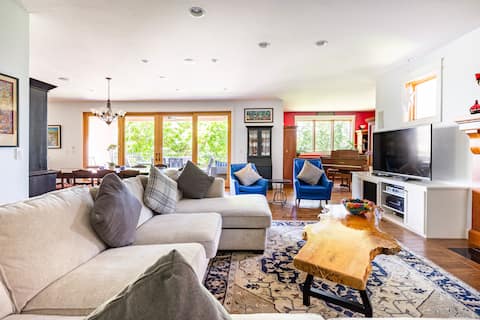
The Big Pink House, near the University of Oregon
Entire Place • 6 bedrooms

Zen Haus Luxe 2 homes in 1, near UO KING beds
Entire Place • 5 bedrooms
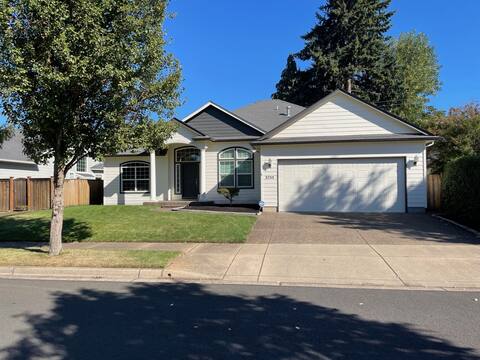
Mark's House
Entire Place • 4 bedrooms

KING Bed•Hot Tub•Parks•Large Patio•4 Bedrooms
Entire Place • 4 bedrooms
Note: Performance varies based on location, size, amenities, seasonality, and management quality. Data reflects the past 12 months.
Top Performing Airbnb Hosts in Eugene (2026)
Learn from the best! This table showcases top-performing Airbnb hosts in Eugene based on the number of properties managed and estimated total revenue over the past year. Analyze their scale and performance metrics.
| Host Name | Properties | Grossing Revenue | Stay Reviews | Avg Rating |
|---|---|---|---|---|
| Janna | 16 | $530,256 | 3588 | 4.91/5.0 |
| Noah | 7 | $412,659 | 484 | 4.88/5.0 |
| Megan | 3 | $339,691 | 97 | 4.98/5.0 |
| Ardyn | 3 | $335,652 | 80 | 4.95/5.0 |
| Mitchell | 16 | $327,195 | 193 | 4.79/5.0 |
| Ryan | 16 | $324,758 | 510 | 4.66/5.0 |
| Evolve | 10 | $324,718 | 219 | 4.55/5.0 |
| Shelly | 5 | $298,451 | 614 | 4.95/5.0 |
| Boyst And Boyst INC | 4 | $272,834 | 189 | 4.87/5.0 |
| Sean | 7 | $269,351 | 195 | 4.74/5.0 |
Analyzing the strategies of top hosts, such as their property selection, pricing, and guest communication, can offer valuable lessons for optimizing your own Airbnb operations in Eugene.
Dive Deeper: Advanced Eugene STR Market Data (2026)
Ready to unlock more insights? AirROI provides access to advanced metrics and comprehensive Airbnb data for Eugene. Explore detailed analytics beyond this report to refine your investment strategy, optimize pricing, and maximize your vacation rental profits.
Explore Advanced MetricsEugene Short-Term Rental Market Composition (2026): Property & Room Types
Room Type Distribution
Property Type Distribution
Market Composition Insights for Eugene
- The Eugene Airbnb market composition is heavily skewed towards Entire Home/Apt listings, which make up 85.7% of the 1,283 active rentals. This indicates strong guest preference for privacy and space.
- Looking at the property type distribution in Eugene, House properties are the most common (63.2%), reflecting the local real estate landscape.
- Houses represent a significant 63.2% portion, catering likely to families or larger groups.
- The presence of 14.3% Hotel/Boutique listings indicates integration with traditional hospitality.
- Smaller segments like outdoor/unique, unique stays (combined 2.1%) offer potential for unique stay experiences.
Eugene Airbnb Room Capacity Analysis (2026): Bedroom Distribution
Distribution of Listings by Number of Bedrooms
Room Capacity Insights for Eugene
- The dominant room capacity in Eugene is 1 bedroom listings, making up 28.9% of the market. This suggests a strong demand for properties suitable for couples or solo travelers.
- Together, 1 bedroom and 2 bedrooms properties represent 50.6% of the active Airbnb listings in Eugene, indicating a high concentration in these sizes.
- A significant 32.3% of listings offer 3+ bedrooms, catering to larger groups and families seeking more space in Eugene.
Eugene Vacation Rental Guest Capacity Trends (2026)
Distribution of Listings by Guest Capacity
Guest Capacity Insights for Eugene
- The most common guest capacity trend in Eugene vacation rentals is listings accommodating 4 guests (20.8%). This suggests the primary traveler segment is likely small families or groups.
- Properties designed for 4 guests and 2 guests dominate the Eugene STR market, accounting for 41.2% of listings.
- 32.9% of properties accommodate 6+ guests, serving the market segment for larger families or group travel in Eugene.
- On average, properties in Eugene are equipped to host 4.1 guests.
Eugene Airbnb Booking Patterns (2026): Available vs. Booked Days
Available Days Distribution
Booked Days Distribution
Booking Pattern Insights for Eugene
- The most common availability pattern in Eugene falls within the 271-366 days range, representing 38% of listings. This suggests many properties have significant open periods on their calendars.
- Approximately 71.2% of listings show high availability (181+ days open annually), indicating potential for increased bookings or specific owner usage patterns.
- For booked days, the 91-180 days range is most frequent in Eugene (34.1%), reflecting common guest stay durations or potential owner blocking patterns.
- A notable 29.5% of properties secure long booking periods (181+ days booked per year), highlighting successful long-term rental strategies or significant owner usage.
Eugene Airbnb Minimum Stay Requirements Analysis
Distribution of Listings by Minimum Night Requirement
1 Night
395 listings
30.8% of total
2 Nights
432 listings
33.7% of total
3 Nights
49 listings
3.8% of total
4-6 Nights
35 listings
2.7% of total
7-29 Nights
43 listings
3.4% of total
30+ Nights
329 listings
25.6% of total
Key Insights
- The most prevalent minimum stay requirement in Eugene is 2 Nights, adopted by 33.7% of listings. This highlights the market's preference for shorter, flexible bookings.
- A strong majority (64.5%) of the Eugene Airbnb data shows acceptance of very short stays (1-2 nights), indicating a dynamic, high-turnover market.
- A significant segment (25.6%) caters to monthly stays (30+ nights) in Eugene, pointing to opportunities in the extended-stay market.
Recommendations
- Align with the market by considering a 2 Nights minimum stay, as 33.7% of Eugene hosts use this setting.
- Explore offering discounts for stays of 30+ nights to attract the 25.6% of the market seeking extended stays.
- Adjust minimum nights based on seasonality – potentially shorter during low season and longer during peak demand periods in Eugene.
Eugene Airbnb Cancellation Policy Trends Analysis (2026)
Super Strict 60 Days
2 listings
0.2% of total
Limited
20 listings
1.6% of total
Super Strict 30 Days
7 listings
0.5% of total
Flexible
254 listings
19.8% of total
Moderate
441 listings
34.4% of total
Firm
425 listings
33.1% of total
Strict
134 listings
10.4% of total
Cancellation Policy Insights for Eugene
- The prevailing Airbnb cancellation policy trend in Eugene is Moderate, used by 34.4% of listings.
- There's a relatively balanced mix between guest-friendly (54.2%) and stricter (43.5%) policies, offering choices for different guest needs.
Recommendations for Hosts
- Consider adopting a Moderate policy to align with the 34.4% market standard in Eugene.
- Using a Strict policy might deter some guests, as only 10.4% of listings use it. Evaluate if potential revenue protection outweighs possible lower booking rates.
- Regularly review your cancellation policy against competitors and market demand shifts in Eugene.
Eugene STR Booking Lead Time Analysis (2026)
Average Booking Lead Time by Month
Booking Lead Time Insights for Eugene
- The overall average booking lead time for vacation rentals in Eugene is 53 days.
- Guests book furthest in advance for stays during June (average 87 days), likely coinciding with peak travel demand or local events.
- The shortest booking windows occur for stays in February (average 23 days), indicating more last-minute travel plans during this time.
- Seasonally, Fall (66 days avg.) sees the longest lead times, while Winter (28 days avg.) has the shortest, reflecting typical travel planning cycles.
Recommendations for Hosts
- Use the overall average lead time (53 days) as a baseline for your pricing and availability strategy in Eugene.
- For June stays, consider implementing length-of-stay discounts or slightly higher rates for bookings made less than 87 days out to capitalize on advance planning.
- Target marketing efforts for the Fall season well in advance (at least 66 days) to capture early planners.
- Monitor your own booking lead times against these Eugene averages to identify opportunities for dynamic pricing adjustments.
Popular & Essential Airbnb Amenities in Eugene (2026)
Amenity Prevalence
Amenity Insights for Eugene
- Essential amenities in Eugene that guests expect include: Wifi, Smoke alarm, Heating. Lacking these (any) could significantly impact bookings.
- Popular amenities like Hot water, Air conditioning, TV are common but not universal. Offering these can provide a competitive edge.
Recommendations for Hosts
- Ensure your listing includes all essential amenities for Eugene: Wifi, Smoke alarm, Heating.
- Prioritize adding missing essentials: Wifi, Smoke alarm, Heating.
- Consider adding popular differentiators like Hot water or Air conditioning to increase appeal.
- Highlight unique or less common amenities you offer (e.g., hot tub, dedicated workspace, EV charger) in your listing description and photos.
- Regularly check competitor amenities in Eugene to stay competitive.
Eugene Airbnb Guest Demographics & Profile Analysis (2026)
Guest Profile Summary for Eugene
- The typical guest profile for Airbnb in Eugene consists of primarily domestic travelers (97%), often arriving from nearby Portland, typically belonging to the Post-2000s (Gen Z/Alpha) group (50%), primarily speaking English or Spanish.
- Domestic travelers account for 96.9% of guests.
- Key international markets include United States (96.9%) and Canada (1%).
- Top languages spoken are English (70.7%) followed by Spanish (13.2%).
- A significant demographic segment is the Post-2000s (Gen Z/Alpha) group, representing 50% of guests.
Recommendations for Hosts
- Target domestic marketing efforts towards travelers from Portland and Seattle.
- Tailor amenities and listing descriptions to appeal to the dominant Post-2000s (Gen Z/Alpha) demographic (e.g., highlight fast WiFi, smart home features, local guides).
- Highlight unique local experiences or amenities relevant to the primary guest profile.
- Consider seasonal promotions aligned with peak travel times for key origin markets.
Nearby Short-Term Rental Market Comparison
How does the Eugene Airbnb market stack up against its neighbors? Compare key performance metrics like average monthly revenue, ADR, and occupancy rates in surrounding areas to understand the broader regional STR landscape.
| Market | Active Properties | Monthly Revenue | Daily Rate | Avg. Occupancy |
|---|---|---|---|---|
| Arch Cape | 78 | $7,909 | $512.29 | 53% |
| South Beach | 10 | $6,948 | $417.34 | 51% |
| Manzanita | 288 | $5,262 | $395.19 | 43% |
| Cannon Beach | 226 | $5,178 | $436.27 | 46% |
| Seal Rock | 39 | $4,852 | $371.44 | 47% |
| Bandon | 158 | $4,810 | $403.75 | 41% |
| Dundee | 71 | $4,771 | $426.97 | 35% |
| Lincoln County | 10 | $4,478 | $377.82 | 41% |
| Yachats | 183 | $4,296 | $287.72 | 48% |
| Nehalem | 100 | $4,215 | $369.69 | 42% |