Vinita Airbnb Market Analysis 2026: Short Term Rental Data & Vacation Rental Statistics in Oklahoma, United States
Is Airbnb profitable in Vinita in 2026? Explore comprehensive Airbnb analytics for Vinita, Oklahoma, United States to uncover income potential. This 2026 STR market report for Vinita, based on AirROI data from February 2025 to January 2026, reveals key trends in the niche market of 32 active listings.
Whether you're considering an Airbnb investment in Vinita, optimizing your existing vacation rental, or exploring rental arbitrage opportunities, understanding the Vinita Airbnb data is crucial. Leveraging the low regulation environment is key to maximizing your short term rental income potential. Let's dive into the specifics.
Key Vinita Airbnb Performance Metrics Overview
Monthly Airbnb Revenue Variations & Income Potential in Vinita (2026)
Understanding the monthly revenue variations for Airbnb listings in Vinita is key to maximizing your short term rental income potential. Seasonality significantly impacts earnings. Our analysis, based on data from the past 12 months, shows that the peak revenue month for STRs in Vinita is typically July, while January often presents the lowest earnings, highlighting opportunities for strategic pricing adjustments during shoulder and low seasons. Explore the typical Airbnb income in Vinita across different performance tiers:
- Best-in-class properties (Top 10%) achieve $6,064+ monthly, often utilizing dynamic pricing and superior guest experiences.
- Strong performing properties (Top 25%) earn $2,970 or more, indicating effective management and desirable locations/amenities.
- Typical properties (Median) generate around $1,453 per month, representing the average market performance.
- Entry-level properties (Bottom 25%) see earnings around $712, often with potential for optimization.
Average Monthly Airbnb Earnings Trend in Vinita
Vinita Airbnb Occupancy Rate Trends (2026)
Maximize your bookings by understanding the Vinita STR occupancy trends. Seasonal demand shifts significantly influence how often properties are booked. Typically, Julysees the highest demand (peak season occupancy), while January experiences the lowest (low season). Effective strategies, like adjusting minimum stays or offering promotions, can boost occupancy during slower periods. Here's how different property tiers perform in Vinita:
- Best-in-class properties (Top 10%) achieve 63%+ occupancy, indicating high desirability and potentially optimized availability.
- Strong performing properties (Top 25%) maintain 39% or higher occupancy, suggesting good market fit and guest satisfaction.
- Typical properties (Median) have an occupancy rate around 24%.
- Entry-level properties (Bottom 25%) average 11% occupancy, potentially facing higher vacancy.
Average Monthly Occupancy Rate Trend in Vinita
Average Daily Rate (ADR) Airbnb Trends in Vinita (2026)
Effective short term rental pricing strategy in Vinita involves understanding monthly ADR fluctuations. The Average Daily Rate (ADR) for Airbnb in Vinita typically peaks in June and dips lowest during February. Leveraging Airbnb dynamic pricing tools or strategies based on this seasonality can significantly boost revenue. Here's a look at the typical nightly rates achieved:
- Best-in-class properties (Top 10%) command rates of $580+ per night, often due to premium features or locations.
- Strong performing properties (Top 25%) achieve nightly rates of $342 or more.
- Typical properties (Median) charge around $222 per night.
- Entry-level properties (Bottom 25%) earn around $133 per night.
Average Daily Rate (ADR) Trend by Month in Vinita
Get Live Vinita Market Intelligence 👇

Explore Real-time Analytics
Airbnb Seasonality Analysis & Trends in Vinita (2026)
Peak Season (July, June, August)
- Revenue averages $4,058 per month
- Occupancy rates average 34.8%
- Daily rates average $324
Shoulder Season
- Revenue averages $2,252 per month
- Occupancy maintains around 29.2%
- Daily rates hold near $271
Low Season (January, February, December)
- Revenue drops to average $1,495 per month
- Occupancy decreases to average 20.9%
- Daily rates adjust to average $247
Seasonality Insights for Vinita
- The Airbnb seasonality in Vinita shows highly seasonal trends requiring careful strategy. While the sections above show seasonal averages, it's also insightful to look at the extremes:
- During the high season, the absolute peak month showcases Vinita's highest earning potential, with monthly revenues capable of climbing to $4,546, occupancy reaching a high of 38.0%, and ADRs peaking at $338.
- Conversely, the slowest single month of the year, typically falling within the low season, marks the market's lowest point. In this month, revenue might dip to $1,255, occupancy could drop to 13.6%, and ADRs may adjust down to $229.
- Understanding both the seasonal averages and these monthly peaks and troughs in revenue, occupancy, and ADR is crucial for maximizing your Airbnb profit potential in Vinita.
Seasonal Strategies for Maximizing Profit
- Peak Season: Maximize revenue through premium pricing and potentially longer minimum stays. Ensure high availability.
- Low Season: Offer competitive pricing, special promotions (e.g., extended stay discounts), and flexible cancellation policies. Target off-season travelers like remote workers or budget-conscious guests.
- Shoulder Seasons: Implement dynamic pricing that balances peak and low rates. Target weekend travelers or specific events. Offer slightly more flexible terms than peak season.
- Regularly analyze your own performance against these Vinita seasonality benchmarks and adjust your pricing and availability strategy accordingly.
Best Areas for Airbnb Investment in Vinita (2026)
Exploring the top neighborhoods for short-term rentals in Vinita? This section highlights key areas, outlining why they are attractive for hosts and guests, along with notable local attractions. Consider these locations based on your target guest profile and investment strategy.
| Neighborhood / Area | Why Host Here? (Target Guests & Appeal) | Key Attractions & Landmarks |
|---|---|---|
| Downtown Vinita | The heart of Vinita, featuring local shops and restaurants. A prime area for guests looking to explore the local culture and history of the town. | Historical Society Museum, Vinita Depot, Local dining options, Antique shops |
| Will Rogers Downs | A popular horse racing venue attracting visitors during racing season. Ideal for guests interested in events and entertainment. | Casino, Horse racing events, Live music, Dining facilities |
| Lake O' the Cherokees | A scenic spot offering outdoor activities like fishing, boating, and camping. Great for nature lovers and families seeking a recreational getaway. | Fishing spots, Boating, Picnic areas, Hiking trails |
| George M. Murrell Home | A historic site that offers a glimpse into the area's past. A good location for history buffs and visitors exploring local heritage. | Historic home tours, Cultural events, Gardens |
| Cherokee Casino | A major entertainment venue, great for visitors looking for gaming, dining, and live entertainment. Attracts a diverse crowd seeking nightlife. | Gaming, Dining, Live entertainment, Spa services |
| Vinita's Downtown Antique District | A treasure trove for antique lovers. Attracts visitors looking to shop for unique items and enjoy a nostalgic atmosphere. | Antique shops, Local craft fairs, Art galleries, Historic buildings |
| Route 66 | Famous historic highway attracting road trip enthusiasts and tourists interested in Americana. A landmark for visitors exploring classic American culture. | Route 66 memorabilia, Quirky roadside attractions, Local diners, Historic markers |
| Nearby Nature Parks | Brings guests close to beautiful natural landscapes and outdoor activities, perfect for relaxation and exploration. | Birdwatching, Nature trails, Picnic areas, Wildlife viewing |
Understanding Airbnb License Requirements & STR Laws in Vinita (2026)
While Vinita, Oklahoma, United States currently shows low STR regulations, specific Airbnb license requirements might still exist or change. Always verify the latest short term rental regulations and Airbnb license requirements directly with local government authorities for Vinita to ensure full compliance before hosting.
(Source: AirROI data, 2026, finding no licensed listings among those analyzed)
Top Performing Airbnb Properties in Vinita (2026)
Benchmark your potential! Explore examples of top-performing Airbnb properties in Vinitabased on Trailing Twelve Month (TTM) revenue. Analyze their characteristics, revenue, occupancy rate, and ADR to understand what drives success in this market.
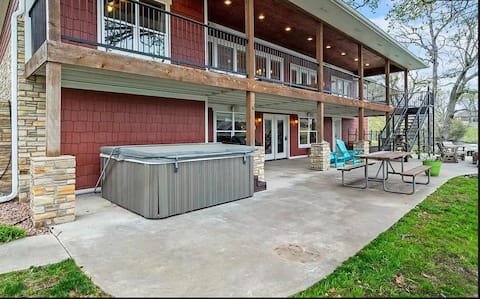
Compound On Lake - Game Room/Pool/Dock - Sleeps 37
Entire Place • 10 bedrooms

Newly Renovated Modern Lakefront House on 1 Acre
Entire Place • 4 bedrooms

Waterfall Lakehouse Lake Views! June specials
Entire Place • 6 bedrooms

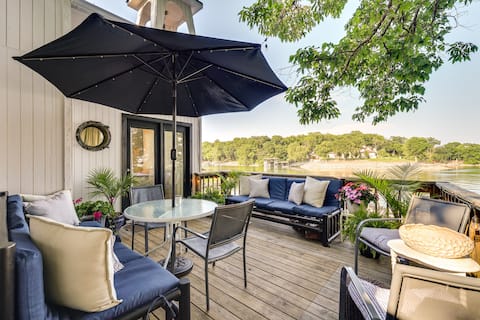
Grand Lake Waterfront View
Entire Place • 3 bedrooms
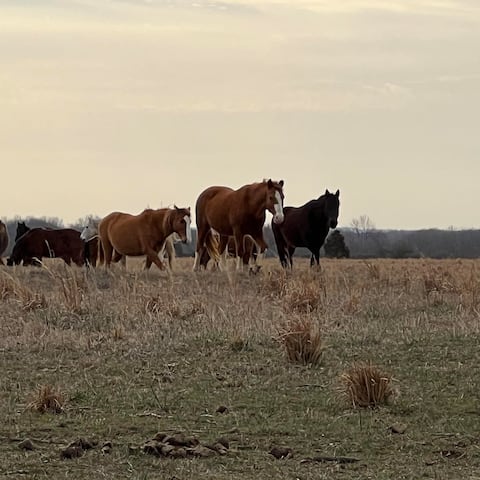
Wild Horse Hideout /private pool
Entire Place • 4 bedrooms
Waterfront Home w/ Dock in South Grand Lake!
Entire Place • 2 bedrooms
Note: Performance varies based on location, size, amenities, seasonality, and management quality. Data reflects the past 12 months.
Top Performing Airbnb Hosts in Vinita (2026)
Learn from the best! This table showcases top-performing Airbnb hosts in Vinita based on the number of properties managed and estimated total revenue over the past year. Analyze their scale and performance metrics.
| Host Name | Properties | Grossing Revenue | Stay Reviews | Avg Rating |
|---|---|---|---|---|
| Tarryn | 1 | $153,594 | 91 | 4.85/5.0 |
| Evolve | 5 | $98,850 | 61 | 4.47/5.0 |
| Mike | 3 | $83,095 | 26 | 4.81/5.0 |
| Water'S Edge RV Resort | 8 | $77,337 | 29 | 4.79/5.0 |
| James | 1 | $71,836 | 64 | 4.95/5.0 |
| Jennifer | 1 | $46,012 | 16 | 4.88/5.0 |
| Gary | 1 | $39,487 | 70 | 4.87/5.0 |
| Wild Horse | 1 | $37,159 | 45 | 4.93/5.0 |
| Rhett | 1 | $23,389 | 10 | 5.00/5.0 |
| Jazton | 1 | $22,291 | 15 | 4.87/5.0 |
Analyzing the strategies of top hosts, such as their property selection, pricing, and guest communication, can offer valuable lessons for optimizing your own Airbnb operations in Vinita.
Dive Deeper: Advanced Vinita STR Market Data (2026)
Ready to unlock more insights? AirROI provides access to advanced metrics and comprehensive Airbnb data for Vinita. Explore detailed analytics beyond this report to refine your investment strategy, optimize pricing, and maximize your vacation rental profits.
Explore Advanced MetricsVinita Short-Term Rental Market Composition (2026): Property & Room Types
Room Type Distribution
Property Type Distribution
Market Composition Insights for Vinita
- The Vinita Airbnb market composition is heavily skewed towards Entire Home/Apt listings, which make up 100% of the 32 active rentals. This indicates strong guest preference for privacy and space.
- Looking at the property type distribution in Vinita, House properties are the most common (68.8%), reflecting the local real estate landscape.
- Houses represent a significant 68.8% portion, catering likely to families or larger groups.
Vinita Airbnb Room Capacity Analysis (2026): Bedroom Distribution
Distribution of Listings by Number of Bedrooms
Room Capacity Insights for Vinita
- The dominant room capacity in Vinita is 3 bedrooms listings, making up 31.3% of the market. This suggests a strong demand for properties suitable for families or small groups.
- Together, 3 bedrooms and 1 bedroom properties represent 59.4% of the active Airbnb listings in Vinita, indicating a high concentration in these sizes.
- A significant 59.4% of listings offer 3+ bedrooms, catering to larger groups and families seeking more space in Vinita.
Vinita Vacation Rental Guest Capacity Trends (2026)
Distribution of Listings by Guest Capacity
Guest Capacity Insights for Vinita
- The most common guest capacity trend in Vinita vacation rentals is listings accommodating 8+ guests (59.4%). This suggests the primary traveler segment is likely larger groups.
- Properties designed for 8+ guests and 4 guests dominate the Vinita STR market, accounting for 90.7% of listings.
- 65.6% of properties accommodate 6+ guests, serving the market segment for larger families or group travel in Vinita.
- On average, properties in Vinita are equipped to host 6.5 guests.
Vinita Airbnb Booking Patterns (2026): Available vs. Booked Days
Available Days Distribution
Booked Days Distribution
Booking Pattern Insights for Vinita
- The most common availability pattern in Vinita falls within the 271-366 days range, representing 68.8% of listings. This suggests many properties have significant open periods on their calendars.
- Approximately 93.8% of listings show high availability (181+ days open annually), indicating potential for increased bookings or specific owner usage patterns.
- For booked days, the 31-90 days range is most frequent in Vinita (53.1%), reflecting common guest stay durations or potential owner blocking patterns.
- A notable 6.3% of properties secure long booking periods (181+ days booked per year), highlighting successful long-term rental strategies or significant owner usage.
Vinita Airbnb Minimum Stay Requirements Analysis
Distribution of Listings by Minimum Night Requirement
1 Night
4 listings
12.5% of total
2 Nights
20 listings
62.5% of total
30+ Nights
8 listings
25% of total
Key Insights
- The most prevalent minimum stay requirement in Vinita is 2 Nights, adopted by 62.5% of listings. This highlights the market's preference for shorter, flexible bookings.
- A strong majority (75.0%) of the Vinita Airbnb data shows acceptance of very short stays (1-2 nights), indicating a dynamic, high-turnover market.
- A significant segment (25%) caters to monthly stays (30+ nights) in Vinita, pointing to opportunities in the extended-stay market.
Recommendations
- Align with the market by considering a 2 Nights minimum stay, as 62.5% of Vinita hosts use this setting.
- If feasible, allowing 1-night stays, especially midweek or during low season, could capture last-minute bookings, as only 12.5% currently do.
- A 2-night minimum appears standard (62.5%). Consider this for weekends or peak periods.
- Explore offering discounts for stays of 30+ nights to attract the 25% of the market seeking extended stays.
- Adjust minimum nights based on seasonality – potentially shorter during low season and longer during peak demand periods in Vinita.
Vinita Airbnb Cancellation Policy Trends Analysis (2026)
Limited
3 listings
9.4% of total
Flexible
3 listings
9.4% of total
Moderate
6 listings
18.8% of total
Firm
16 listings
50% of total
Strict
4 listings
12.5% of total
Cancellation Policy Insights for Vinita
- The prevailing Airbnb cancellation policy trend in Vinita is Firm, used by 50% of listings.
- A majority (62.5%) of hosts in Vinita utilize Firm or Strict policies, indicating a market where hosts prioritize booking security.
Recommendations for Hosts
- Consider adopting a Firm policy to align with the 50% market standard in Vinita.
- Using a Strict policy might deter some guests, as only 12.5% of listings use it. Evaluate if potential revenue protection outweighs possible lower booking rates.
- Regularly review your cancellation policy against competitors and market demand shifts in Vinita.
Vinita STR Booking Lead Time Analysis (2026)
Average Booking Lead Time by Month
Booking Lead Time Insights for Vinita
- The overall average booking lead time for vacation rentals in Vinita is 45 days.
- Guests book furthest in advance for stays during August (average 77 days), likely coinciding with peak travel demand or local events.
- The shortest booking windows occur for stays in February (average 15 days), indicating more last-minute travel plans during this time.
- Seasonally, Summer (72 days avg.) sees the longest lead times, while Winter (22 days avg.) has the shortest, reflecting typical travel planning cycles.
Recommendations for Hosts
- Use the overall average lead time (45 days) as a baseline for your pricing and availability strategy in Vinita.
- For August stays, consider implementing length-of-stay discounts or slightly higher rates for bookings made less than 77 days out to capitalize on advance planning.
- Target marketing efforts for the Summer season well in advance (at least 72 days) to capture early planners.
- Monitor your own booking lead times against these Vinita averages to identify opportunities for dynamic pricing adjustments.
Popular & Essential Airbnb Amenities in Vinita (2026)
Amenity Prevalence
Amenity Insights for Vinita
- Essential amenities in Vinita that guests expect include: Kitchen, Air conditioning. Lacking these (any) could significantly impact bookings.
- Popular amenities like TV, Smoke alarm, Wifi are common but not universal. Offering these can provide a competitive edge.
- Warning: Wifi is not universally provided but is considered essential globally. Ensure reliable Wifi is offered.
Recommendations for Hosts
- Ensure your listing includes all essential amenities for Vinita: Kitchen, Air conditioning.
- Prioritize adding missing essentials: Kitchen, Air conditioning.
- Consider adding popular differentiators like TV or Smoke alarm to increase appeal.
- Highlight unique or less common amenities you offer (e.g., hot tub, dedicated workspace, EV charger) in your listing description and photos.
- Regularly check competitor amenities in Vinita to stay competitive.
Vinita Airbnb Guest Demographics & Profile Analysis (2026)
Guest Profile Summary for Vinita
- The typical guest profile for Airbnb in Vinita consists of primarily domestic travelers (99%), often arriving from nearby Tulsa, typically belonging to the Post-2000s (Gen Z/Alpha) group (50%), primarily speaking English or Korean.
- Domestic travelers account for 99.1% of guests.
- Key international markets include United States (99.1%) and South Korea (0.9%).
- Top languages spoken are English (86.4%) followed by Korean (2.3%).
- A significant demographic segment is the Post-2000s (Gen Z/Alpha) group, representing 50% of guests.
Recommendations for Hosts
- Target domestic marketing efforts towards travelers from Tulsa and Oklahoma City.
- Tailor amenities and listing descriptions to appeal to the dominant Post-2000s (Gen Z/Alpha) demographic (e.g., highlight fast WiFi, smart home features, local guides).
- Highlight unique local experiences or amenities relevant to the primary guest profile.
- Consider seasonal promotions aligned with peak travel times for key origin markets.
Nearby Short-Term Rental Market Comparison
How does the Vinita Airbnb market stack up against its neighbors? Compare key performance metrics like average monthly revenue, ADR, and occupancy rates in surrounding areas to understand the broader regional STR landscape.
| Market | Active Properties | Monthly Revenue | Daily Rate | Avg. Occupancy |
|---|---|---|---|---|
| Carlton Landing | 100 | $3,015 | $417.80 | 29% |
| Little Flock | 17 | $2,955 | $370.27 | 40% |
| Lowell | 30 | $2,905 | $254.69 | 43% |
| Canadian | 44 | $2,897 | $349.28 | 34% |
| Fayetteville | 601 | $2,668 | $258.84 | 40% |
| Bentonville | 739 | $2,640 | $219.38 | 47% |
| Cave Springs | 15 | $2,622 | $146.64 | 62% |
| Hulbert | 20 | $2,536 | $254.57 | 39% |
| Eucha | 51 | $2,492 | $282.33 | 33% |
| Rogers | 385 | $2,465 | $246.52 | 41% |