Tulsa Airbnb Market Analysis 2026: Short Term Rental Data & Vacation Rental Statistics in Oklahoma, United States
Is Airbnb profitable in Tulsa in 2026? Explore comprehensive Airbnb analytics for Tulsa, Oklahoma, United States to uncover income potential. This 2026 STR market report for Tulsa, based on AirROI data from February 2025 to January 2026, reveals key trends in the bustling market of 1,109 active listings.
Whether you're considering an Airbnb investment in Tulsa, optimizing your existing vacation rental, or exploring rental arbitrage opportunities, understanding the Tulsa Airbnb data is crucial. Leveraging the low regulation environment is key to maximizing your short term rental income potential. Let's dive into the specifics.
Key Tulsa Airbnb Performance Metrics Overview
Monthly Airbnb Revenue Variations & Income Potential in Tulsa (2026)
Understanding the monthly revenue variations for Airbnb listings in Tulsa is key to maximizing your short term rental income potential. Seasonality significantly impacts earnings. Our analysis, based on data from the past 12 months, shows that the peak revenue month for STRs in Tulsa is typically October, while February often presents the lowest earnings, highlighting opportunities for strategic pricing adjustments during shoulder and low seasons. Explore the typical Airbnb income in Tulsa across different performance tiers:
- Best-in-class properties (Top 10%) achieve $4,989+ monthly, often utilizing dynamic pricing and superior guest experiences.
- Strong performing properties (Top 25%) earn $3,312 or more, indicating effective management and desirable locations/amenities.
- Typical properties (Median) generate around $2,182 per month, representing the average market performance.
- Entry-level properties (Bottom 25%) see earnings around $1,260, often with potential for optimization.
Average Monthly Airbnb Earnings Trend in Tulsa
Tulsa Airbnb Occupancy Rate Trends (2026)
Maximize your bookings by understanding the Tulsa STR occupancy trends. Seasonal demand shifts significantly influence how often properties are booked. Typically, Marchsees the highest demand (peak season occupancy), while January experiences the lowest (low season). Effective strategies, like adjusting minimum stays or offering promotions, can boost occupancy during slower periods. Here's how different property tiers perform in Tulsa:
- Best-in-class properties (Top 10%) achieve 82%+ occupancy, indicating high desirability and potentially optimized availability.
- Strong performing properties (Top 25%) maintain 69% or higher occupancy, suggesting good market fit and guest satisfaction.
- Typical properties (Median) have an occupancy rate around 50%.
- Entry-level properties (Bottom 25%) average 30% occupancy, potentially facing higher vacancy.
Average Monthly Occupancy Rate Trend in Tulsa
Average Daily Rate (ADR) Airbnb Trends in Tulsa (2026)
Effective short term rental pricing strategy in Tulsa involves understanding monthly ADR fluctuations. The Average Daily Rate (ADR) for Airbnb in Tulsa typically peaks in November and dips lowest during February. Leveraging Airbnb dynamic pricing tools or strategies based on this seasonality can significantly boost revenue. Here's a look at the typical nightly rates achieved:
- Best-in-class properties (Top 10%) command rates of $281+ per night, often due to premium features or locations.
- Strong performing properties (Top 25%) achieve nightly rates of $195 or more.
- Typical properties (Median) charge around $139 per night.
- Entry-level properties (Bottom 25%) earn around $99 per night.
Average Daily Rate (ADR) Trend by Month in Tulsa
Get Live Tulsa Market Intelligence 👇

Explore Real-time Analytics
Airbnb Seasonality Analysis & Trends in Tulsa (2026)
Peak Season (October, June, November)
- Revenue averages $3,142 per month
- Occupancy rates average 53.4%
- Daily rates average $182
Shoulder Season
- Revenue averages $2,711 per month
- Occupancy maintains around 51.7%
- Daily rates hold near $165
Low Season (January, February, December)
- Revenue drops to average $2,087 per month
- Occupancy decreases to average 40.9%
- Daily rates adjust to average $169
Seasonality Insights for Tulsa
- The Airbnb seasonality in Tulsa shows moderate seasonality with distinct peak and low periods. While the sections above show seasonal averages, it's also insightful to look at the extremes:
- During the high season, the absolute peak month showcases Tulsa's highest earning potential, with monthly revenues capable of climbing to $3,272, occupancy reaching a high of 54.5%, and ADRs peaking at $185.
- Conversely, the slowest single month of the year, typically falling within the low season, marks the market's lowest point. In this month, revenue might dip to $1,753, occupancy could drop to 37.3%, and ADRs may adjust down to $150.
- Understanding both the seasonal averages and these monthly peaks and troughs in revenue, occupancy, and ADR is crucial for maximizing your Airbnb profit potential in Tulsa.
Seasonal Strategies for Maximizing Profit
- Peak Season: Maximize revenue through premium pricing and potentially longer minimum stays. Ensure high availability.
- Low Season: Offer competitive pricing, special promotions (e.g., extended stay discounts), and flexible cancellation policies. Target off-season travelers like remote workers or budget-conscious guests.
- Shoulder Seasons: Implement dynamic pricing that balances peak and low rates. Target weekend travelers or specific events. Offer slightly more flexible terms than peak season.
- Regularly analyze your own performance against these Tulsa seasonality benchmarks and adjust your pricing and availability strategy accordingly.
Best Areas for Airbnb Investment in Tulsa (2026)
Exploring the top neighborhoods for short-term rentals in Tulsa? This section highlights key areas, outlining why they are attractive for hosts and guests, along with notable local attractions. Consider these locations based on your target guest profile and investment strategy.
| Neighborhood / Area | Why Host Here? (Target Guests & Appeal) | Key Attractions & Landmarks |
|---|---|---|
| Downtown Tulsa | The heart of the city known for its vibrant cultural scene and historic buildings. Attracts business travelers and tourists with its various events and nightlife. | Tulsa Arts District, BOK Center, Philbrook Museum of Art, Tulsa Performing Arts Center, Gathering Place |
| Cherry Street | A trendy neighborhood known for its unique boutiques, cafes, and restaurants. A favorite spot among locals and visitors looking for a distinctive experience. | Cherry Street Farmers Market, Gathering Place, Local shops and eateries, The Canes Ballroom |
| Brookside | A charming area known for its lively atmosphere, great restaurants, and proximity to the River Parks. Perfect for those seeking a relaxing yet entertaining place to stay. | River Parks, Brookside District shops, Tulsa Zoo, Woodward Park, Gilcrease Museum |
| Midtown | An established neighborhood full of character, known for its historic homes, parks, and a mix of dining options. Popular with families and tourists. | Expo Square, Hunter Park, Tulsa Historical Society, Philbrook Museum of Art |
| Tulsa Hills | A shopping and dining destination featuring a variety of stores and eateries. Attracts travelers looking for convenience and modern amenities. | Tulsa Hills Shopping Center, Bass Pro Shops, AMC Theatre, Restaurants and cafes |
| University of Tulsa | A vibrant area surrounding the university, attracting students and visiting families, providing a youthful atmosphere. | University of Tulsa campus, Lorton Performance Center, LaFortune Park, The Golden Driller |
| West Tulsa | A developing area with access to nature and outdoor activities, appealing to those looking for a quieter stay with access to parks and trails. | Turkey Mountain Urban Wilderness Area, Catoosa's Blue Whale, Parks and trails |
| North Tulsa | An emerging area with cultural significance and historical attractions, providing a different perspective of the city for visitors. | Black Wall Street, Tulsan Historic District, Cyrus Avery Centennial Plaza, Pine Street |
Understanding Airbnb License Requirements & STR Laws in Tulsa (2026)
While Tulsa, Oklahoma, United States currently shows low STR regulations, specific Airbnb license requirements might still exist or change. Always verify the latest short term rental regulations and Airbnb license requirements directly with local government authorities for Tulsa to ensure full compliance before hosting.
(Source: AirROI data, 2026, based on 0% licensed listings)
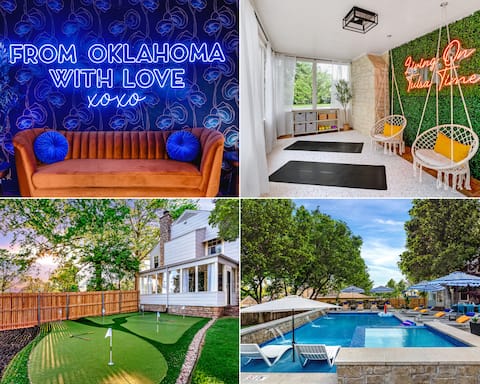
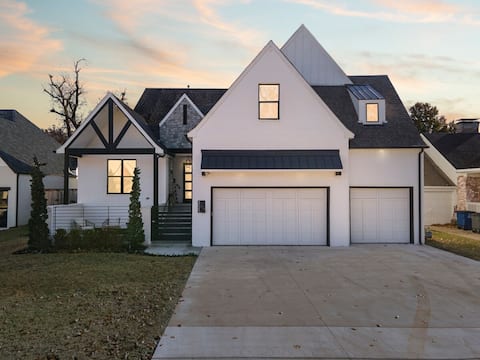
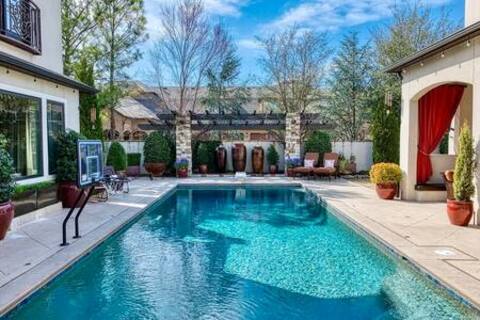
Top Performing Airbnb Properties in Tulsa (2026)
Benchmark your potential! Explore examples of top-performing Airbnb properties in Tulsabased on Trailing Twelve Month (TTM) revenue. Analyze their characteristics, revenue, occupancy rate, and ADR to understand what drives success in this market.

Heated Pool~Pickleball~Hot Tub~Golf~Arcade~Bowling
Entire Place • 5 bedrooms
Heated Pool ~ Spa ~ PuttPutt ~ Arcade ~Yoga Studio
Entire Place • 5 bedrooms
Gathering Place Luxury-Pool/Spa/OutdoorKitchen
Entire Place • 4 bedrooms
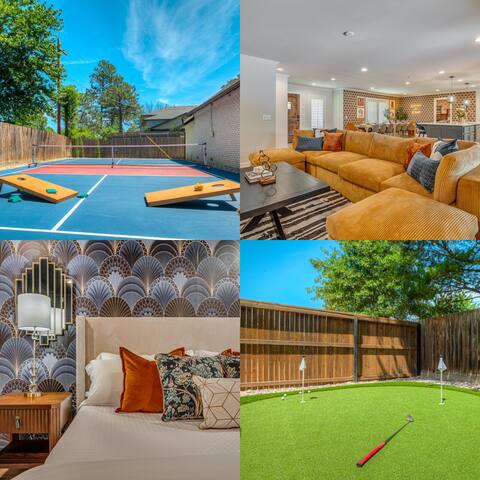
The Birmingham - Pickleball Court & Putting Green
Entire Place • 5 bedrooms

2 Luxury Homes | Utica & Expo | 5 BR 4 BA 8 Beds
Entire Place • 5 bedrooms
Modern Mediterranean Retreat!
Entire Place • 5 bedrooms
Note: Performance varies based on location, size, amenities, seasonality, and management quality. Data reflects the past 12 months.
Top Performing Airbnb Hosts in Tulsa (2026)
Learn from the best! This table showcases top-performing Airbnb hosts in Tulsa based on the number of properties managed and estimated total revenue over the past year. Analyze their scale and performance metrics.
| Host Name | Properties | Grossing Revenue | Stay Reviews | Avg Rating |
|---|---|---|---|---|
| StayInTulsaOK | 34 | $1,694,792 | 1847 | 4.96/5.0 |
| Nadir | 16 | $1,081,405 | 2052 | 4.96/5.0 |
| Laurenda | 31 | $784,967 | 1818 | 4.89/5.0 |
| Tulsa | 9 | $730,629 | 455 | 4.98/5.0 |
| Jennifer | 9 | $572,856 | 1224 | 4.97/5.0 |
| Chelsea And Justin | 13 | $424,566 | 1677 | 4.96/5.0 |
| Evolve | 19 | $412,143 | 363 | 4.76/5.0 |
| Bentley | 9 | $344,447 | 460 | 4.73/5.0 |
| Turnover Tulsa | 13 | $313,761 | 2137 | 4.90/5.0 |
| Jay | 25 | $310,012 | 1333 | 4.83/5.0 |
Analyzing the strategies of top hosts, such as their property selection, pricing, and guest communication, can offer valuable lessons for optimizing your own Airbnb operations in Tulsa.
Dive Deeper: Advanced Tulsa STR Market Data (2026)
Ready to unlock more insights? AirROI provides access to advanced metrics and comprehensive Airbnb data for Tulsa. Explore detailed analytics beyond this report to refine your investment strategy, optimize pricing, and maximize your vacation rental profits.
Explore Advanced MetricsTulsa Short-Term Rental Market Composition (2026): Property & Room Types
Room Type Distribution
Property Type Distribution
Market Composition Insights for Tulsa
- The Tulsa Airbnb market composition is heavily skewed towards Entire Home/Apt listings, which make up 91.8% of the 1,109 active rentals. This indicates strong guest preference for privacy and space.
- Looking at the property type distribution in Tulsa, House properties are the most common (76.5%), reflecting the local real estate landscape.
- Houses represent a significant 76.5% portion, catering likely to families or larger groups.
- The presence of 5.5% Hotel/Boutique listings indicates integration with traditional hospitality.
- Smaller segments like others, outdoor/unique, unique stays (combined 2.2%) offer potential for unique stay experiences.
Tulsa Airbnb Room Capacity Analysis (2026): Bedroom Distribution
Distribution of Listings by Number of Bedrooms
Room Capacity Insights for Tulsa
- The dominant room capacity in Tulsa is 3 bedrooms listings, making up 32.2% of the market. This suggests a strong demand for properties suitable for families or small groups.
- Together, 3 bedrooms and 2 bedrooms properties represent 54.9% of the active Airbnb listings in Tulsa, indicating a high concentration in these sizes.
- A significant 47.0% of listings offer 3+ bedrooms, catering to larger groups and families seeking more space in Tulsa.
Tulsa Vacation Rental Guest Capacity Trends (2026)
Distribution of Listings by Guest Capacity
Guest Capacity Insights for Tulsa
- The most common guest capacity trend in Tulsa vacation rentals is listings accommodating 8+ guests (25.9%). This suggests the primary traveler segment is likely larger groups.
- Properties designed for 8+ guests and 6 guests dominate the Tulsa STR market, accounting for 47.4% of listings.
- 51.1% of properties accommodate 6+ guests, serving the market segment for larger families or group travel in Tulsa.
- On average, properties in Tulsa are equipped to host 5.1 guests.
Tulsa Airbnb Booking Patterns (2026): Available vs. Booked Days
Available Days Distribution
Booked Days Distribution
Booking Pattern Insights for Tulsa
- The most common availability pattern in Tulsa falls within the 181-270 days range, representing 34.4% of listings. This suggests many properties have significant open periods on their calendars.
- Approximately 64.1% of listings show high availability (181+ days open annually), indicating potential for increased bookings or specific owner usage patterns.
- For booked days, the 91-180 days range is most frequent in Tulsa (34.9%), reflecting common guest stay durations or potential owner blocking patterns.
- A notable 37.3% of properties secure long booking periods (181+ days booked per year), highlighting successful long-term rental strategies or significant owner usage.
Tulsa Airbnb Minimum Stay Requirements Analysis
Distribution of Listings by Minimum Night Requirement
1 Night
363 listings
32.7% of total
2 Nights
272 listings
24.5% of total
3 Nights
46 listings
4.1% of total
4-6 Nights
23 listings
2.1% of total
7-29 Nights
58 listings
5.2% of total
30+ Nights
347 listings
31.3% of total
Key Insights
- The most prevalent minimum stay requirement in Tulsa is 1 Night, adopted by 32.7% of listings. This highlights the market's preference for shorter, flexible bookings.
- A significant segment (31.3%) caters to monthly stays (30+ nights) in Tulsa, pointing to opportunities in the extended-stay market.
Recommendations
- Align with the market by considering a 1 Night minimum stay, as 32.7% of Tulsa hosts use this setting.
- Explore offering discounts for stays of 30+ nights to attract the 31.3% of the market seeking extended stays.
- Adjust minimum nights based on seasonality – potentially shorter during low season and longer during peak demand periods in Tulsa.
Tulsa Airbnb Cancellation Policy Trends Analysis (2026)
Super Strict 30 Days
2 listings
0.2% of total
Limited
23 listings
2.1% of total
Flexible
266 listings
24% of total
Moderate
346 listings
31.2% of total
Firm
353 listings
31.9% of total
Strict
118 listings
10.6% of total
Cancellation Policy Insights for Tulsa
- The prevailing Airbnb cancellation policy trend in Tulsa is Firm, used by 31.9% of listings.
- There's a relatively balanced mix between guest-friendly (55.2%) and stricter (42.5%) policies, offering choices for different guest needs.
Recommendations for Hosts
- Consider adopting a Firm policy to align with the 31.9% market standard in Tulsa.
- Using a Strict policy might deter some guests, as only 10.6% of listings use it. Evaluate if potential revenue protection outweighs possible lower booking rates.
- Regularly review your cancellation policy against competitors and market demand shifts in Tulsa.
Tulsa STR Booking Lead Time Analysis (2026)
Average Booking Lead Time by Month
Booking Lead Time Insights for Tulsa
- The overall average booking lead time for vacation rentals in Tulsa is 36 days.
- Guests book furthest in advance for stays during November (average 53 days), likely coinciding with peak travel demand or local events.
- The shortest booking windows occur for stays in February (average 20 days), indicating more last-minute travel plans during this time.
- Seasonally, Fall (44 days avg.) sees the longest lead times, while Summer (32 days avg.) has the shortest, reflecting typical travel planning cycles.
Recommendations for Hosts
- Use the overall average lead time (36 days) as a baseline for your pricing and availability strategy in Tulsa.
- For November stays, consider implementing length-of-stay discounts or slightly higher rates for bookings made less than 53 days out to capitalize on advance planning.
- Target marketing efforts for the Fall season well in advance (at least 44 days) to capture early planners.
- Monitor your own booking lead times against these Tulsa averages to identify opportunities for dynamic pricing adjustments.
Popular & Essential Airbnb Amenities in Tulsa (2026)
Amenity Prevalence
Amenity Insights for Tulsa
- Essential amenities in Tulsa that guests expect include: Air conditioning, Wifi, Smoke alarm, TV, Heating, Kitchen. Lacking these (any) could significantly impact bookings.
- Popular amenities like Hot water, Coffee maker, Free parking on premises are common but not universal. Offering these can provide a competitive edge.
Recommendations for Hosts
- Ensure your listing includes all essential amenities for Tulsa: Air conditioning, Wifi, Smoke alarm, TV, Heating, Kitchen.
- Prioritize adding missing essentials: Air conditioning, Wifi, Smoke alarm, TV, Heating, Kitchen.
- Consider adding popular differentiators like Hot water or Coffee maker to increase appeal.
- Highlight unique or less common amenities you offer (e.g., hot tub, dedicated workspace, EV charger) in your listing description and photos.
- Regularly check competitor amenities in Tulsa to stay competitive.
Tulsa Airbnb Guest Demographics & Profile Analysis (2026)
Guest Profile Summary for Tulsa
- The typical guest profile for Airbnb in Tulsa consists of primarily domestic travelers (98%), often arriving from nearby Tulsa, typically belonging to the Post-2000s (Gen Z/Alpha) group (50%), primarily speaking English or Spanish.
- Domestic travelers account for 97.7% of guests.
- Key international markets include United States (97.7%) and Canada (0.4%).
- Top languages spoken are English (79.2%) followed by Spanish (11.7%).
- A significant demographic segment is the Post-2000s (Gen Z/Alpha) group, representing 50% of guests.
Recommendations for Hosts
- Target domestic marketing efforts towards travelers from Tulsa and Oklahoma City.
- Tailor amenities and listing descriptions to appeal to the dominant Post-2000s (Gen Z/Alpha) demographic (e.g., highlight fast WiFi, smart home features, local guides).
- Highlight unique local experiences or amenities relevant to the primary guest profile.
- Consider seasonal promotions aligned with peak travel times for key origin markets.
Nearby Short-Term Rental Market Comparison
How does the Tulsa Airbnb market stack up against its neighbors? Compare key performance metrics like average monthly revenue, ADR, and occupancy rates in surrounding areas to understand the broader regional STR landscape.
| Market | Active Properties | Monthly Revenue | Daily Rate | Avg. Occupancy |
|---|---|---|---|---|
| Carlton Landing | 100 | $3,015 | $417.80 | 29% |
| Little Flock | 17 | $2,955 | $370.27 | 40% |
| Lowell | 30 | $2,905 | $254.69 | 43% |
| Canadian | 44 | $2,897 | $349.28 | 34% |
| Fayetteville | 601 | $2,668 | $258.84 | 40% |
| Bentonville | 739 | $2,640 | $219.38 | 47% |
| Cave Springs | 15 | $2,622 | $146.64 | 62% |
| Hulbert | 20 | $2,536 | $254.57 | 39% |
| Eucha | 51 | $2,492 | $282.33 | 33% |
| Rogers | 385 | $2,465 | $246.52 | 41% |